


Services on Demand
Journal

Article
 text in
  English (pdf)
 Article in xml format
 Article references
 Send this article by e-mail
Indicators
-
 Cited by SciELO
Related links
-
 Similars in
SciELO
Similars in
SciELO
Share

 Permalink
Industrial Data
Print version ISSN 1560-9146On-line version ISSN 1810-9993
Ind. data vol.26 no.1 Lima Jan./Jun. 2023
http://dx.doi.org/10.15381/idata.v26i1.22874
Production and Management
Application Method of Value Stream Mapping to Increase Competitiveness in a Textile and Apparel Company
1
*
 http://orcid.org/0000-0002-9605-3670
2
http://orcid.org/0000-0002-9657-0408
3
http://orcid.org/0000-0001-5159-8872
1Mechatronic engineer from Universidad Nacional de Ingeniería and PhD in Business Management from Universidad Nacional Mayor de San Marcos (UNMSM). Currently working as associate and postgraduate professor at the School of Industrial Engineering of UNMSM (Lima, Peru). E-mail: jortizp@unmsm.edu.pe
2Industrial Engineering student at UNMSM (Lima, Peru). E-mail: andrei.bancovich@unmsm.edu.pe
3Industrial Engineering student at UNMSM (Lima, Peru). E-mail: taddy.candia@unmsm.edu.pe
4Graduate in Textile and Apparel Engineering from the School of Industrial Engineering of UNMSM. Currently working as an independent consultant (Lima, Peru). E-mail: lisseth.huayanay@unmsm.edu.pe
5Industrial engineer and PhD in Industrial Engineering from UNMSM. Dean of the School of Industrial Engineering of UNMSM (Lima, Peru). E-mail: jsalasb@unmsm.edu.pe
The textile and apparel sector is one of the most relevant and representative in Peru, due to its tradition and its contribution to the national economy. In recent years, however, it has had to become more competitive, largely due to the entry of international textile product suppliers into the local market. Therefore, companies that comprise this sector must adopt tools that will allow them to increase their productivity. In view of this situation, this research aimed to develop and implement an application model using Value Stream Mapping (VSM) in a textile and apparel company that manufactures garments for export, demonstrating at the same time that VSM is the best tool to visualize the entire supply chain in a single document. It also makes it possible to identify areas of opportunity, perceive the contribution of direct value to the products, distinguish forms of waste, and identify bottlenecks. The methodology adopted for the research is a case study, due to the use of various sources of information, including personal and documentary sources, and the conditions for its development. The results show the determination of the optimal takt time (1060.08 s), and the reduction in the lead time from 20.87 days in the current state map to 16.7 days in the future state map, thus contributing to the improvement of the company’s competitiveness.
Keywords: VSM; continuous improvement; competitiveness; textile production; value flow
INTRODUCTION
Value Stream Mapping (VSM) is a visual tool of Lean Manufacturing (Paredes, 2017) that shows the flow of materials and information from the supplier to the buyer. When first used for the description of the process under study, it is handwritten, which is a distinctive feature in the development of the fieldwork (Marudhamuthu et al., 2011; Xia & Sun, 2013). It makes it possible to recognize tasks that do not provide “added value” so that they can be eliminated (Rajadell & Sánchez, 2011; Xia & Sun, 2013). Moreover, it is also a tool that improves competitiveness, as by analyzing the present situation through the current state map and the desired future state map, it is possible to identify and eliminate waste, which leads to the streamlining of key processes, reduction of costs and delivery times as well as increases in quality (Jeong & Yoon, 2016). A VSM analysis starts by plotting the current state map, which it converts into a baseline representation of an organization’s operations. (Lucherini & Rapaccini, 2017).
Xia and Sun (2013) believe that the design of the future state map design should be based on questions that corresponds to three VSM levels. At level 1 (basic), the following questions are asked: What is the company’s production timeline? Will finished products be directed to intermediaries or to end consumers? In which procedures of the value chain can continuous flow processing be included? Where will the company be able to use pull systems? At level 2 (heijunka), also known as production leveling, the following questions are asked: What single point in the production line will be considered as a pacemaker process for operational scheduling? How will the production be leveled at the pacemaker process? What regular labor increment will be used for production and withdrawal at the pacemaker process? Finally, at level 3 (Kaizen or improvement) the question what continuous improvement process will be needed? is asked.
Peruvian textile and apparel companies experience management problems at an organizational and quality level; likewise, the idle capacity of these companies is over 60%, due in large part due to an absence of workload because most do not meet quality requirements demanded by the global market (Arroyo, as cited in Tinoco et al., 2016, p. 2). In turn, Becerra and Carbajal (2019) state that small or medium-sized textile companies exporting cotton knitted garments currently experience the following drawbacks: increase in process costs (15%) caused by the number of defects in their cutting process; exceeding the standard lead time for the manufacture of a sample by 9 days; a high lead time of 23 days compared to the 15 days provided by competitors in other countries; a lead time of 17 days in the purchasing process, being 7 days more than the market standard; and at the national level, a 67% standard efficiency of product development, which is a problem as it is below the established ideal of 80.44%.
Research has been conducted that demonstrates the usefulness of VSM on textile and apparel companies in order to increase their competitiveness. Internationally, Loos et al. (2016) demonstrated its applicability in the textile sample development process and found that people working in these environments do not always discover opportunities for operational improvement. However, using VSM, it was possible to design their workflows and understand which activities did or did not add value, ultimately leading to the development of exclusive samples for customers and to an increase in the company’s sales volume.
At a national level, Lucioni (2018) thanks to VSM, identified overproduction, defective products, inventory accumulation, high waiting time, unnecessary transportation, and defects as types of waste in an export garment manufacturing company. Similarly, Lecaros (2018), using the current VSM, identified overproduction, inventories, transportation, unnecessary movements, waiting times, unnecessary processes, defects, and misused human resources as mudas. As a result, he compared the identified metrics with optimal ones according to the Lean methodology, i.e., the minimum percentage accepted by the industry to be considered a competitive company. In his research, Lecaros (2018) determined an overall equipment efficiency (OEE) of 69.30%, which served as a baseline, and set a target of 75.00%; he calculated the mean time between failures (MTBF) at 109.20 hours, which served as a baseline, and set a target of 163.80 hours. For mean time to repair (MTTR), the baseline was 84.50 minutes, and a target was set at 59.11 minutes.
Similarly, VSM allowed Ruíz (2016) to map the current state of the company’s operations and identify the pace of customer demand by implementing takt time. Results showed an increase of 24.14 % and a reduction of 26.87 days in non-value-added time due to the implementation of value activities related to the delivery percentage indicator. The use of VSM has benefited the cotton garment industry as well as the alpaca fiber-based export garment industry. Moore and Norabuena (2019) applied VSM to analyze the current supply chain, specifically the production process of garments made using weaving sticks in high Andean communities. It revealed deficiencies regarding the timely delivery of orders, poor information flow, and the absence of quality parameters for the raw material required.
It is necessary to indicate what result is needed and it is important to demonstrate the application of VSM to obtain the future map in a textile and garment export company, given that they cater to international markets that increasingly require certified, competitively priced quality products as well as the speedy delivery of orders, which is the basis for this study (Bardales, 2018).
The company under study is located in the department of Lima, Peru. Its main economic activity is the production and manufacture of cotton t-shirts and printed dresses for men and women of all ages. Due to the increase in input costs and the progressive decrease in production resulting from poor management, the company found it necessary to use continuous improvement tools to detect problems in the production flow and identify opportunities for improvement in order to increase its competitiveness. Therefore, this study aims to develop and implement a method for applying the VSM tool to increase the competitiveness of the company. The hypothesis to be tested is that there is a significant difference in the company’s competitiveness before and after implementing the VSM tool application method in the textile and apparel company.
This paper is intended to be relevant and useful for the scientific community and, therefore, presents the development of a VSM application method as an innovative factor that will serve as a guide to implement this renowned tool in the textile industry and improve the competitiveness of Peruvian companies. Based on the results and the hypothesis testing, the practical validity of the method will be demonstrated, opening the door to future research in order to apply it in similar contexts.
Lean Manufacturing
Lean Manufacturing is an organizational and supply chain management paradigm that involves people, materials, machines, and methods. Its main functions are to improve quality and efficiency by continuously eliminating waste and increasing customer satisfaction (Socconini, 2019). The Lean Manufacturing methodology is ideal for contexts where product manufacturing is performed by discrete and repetitive processes, either for small, medium, or large volumes (Soler, 2015). Certain factors must be considered for its correct application, such as having a well-adapted team and a knowledge of information gathering and analysis (Kafuku, 2019).
Supply Chain
A supply chain is defined as an information system that involves people, labor, and goods, and whose interaction enables a product to move from the producer to the consumer. It also encompasses the relationship between the management of suppliers, the purchase of raw materials, and the manufacture and distribution of the final product. However, supply chain should not be limited to the links it comprises, but rather should be characterized by its core operating attributes (Santander et al., 2014).
Value Stream Mapping (VSM)
Value stream mapping (VSM) is a conceptual tool that maps the value chain, emphasizing material and information flow, starting from the supplier and continuing to the customer (Jimmerson, 2017). It is designed to depict the productive activities to identify the value chain, detect where tasks do not add value to the company, and identify the processes with significant waste (Rohac & Januska, 2015).
Application Method of VMS in the Textile Industry
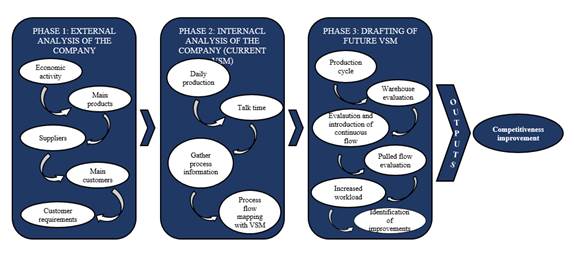
The method presented in this research is based on the application of the VSM tool to improve the competitiveness of a textile and apparel company. Figure 1 illustrates the proposed method.
METHODOLOGY
Our research follows a case study approach. Yin, McCutcheon, and Meredith, cited by Jeong and Yoon (2016), consider this methodology appropriate under three conditions. First, if related to the analysis of a particular situation within its original or natural context; second, if related to the limited or zero ability of the researcher to manipulate the event; and third, if associated with the question “how”. The question in our study was how is VSM applied in order to obtain the future map of the organization under study?
According to Amador and García (2019), VSM is a methodology for the application of value chain mapping, involving the following steps:
Step 1: Select a critical productive area
Step 2: Draft the current state map
2.1. Review existing documentation
2.2. Identify main processes
2.3. Determine non-existing data to be collected
2.4. Gather information
Step 3: Analyze the current state map
Step 4: Future state map
4.1. Calculate takt time
4.2. Determine the desired time
4.3. Execute improvement tools
Data was collected firstly through personal interviews with a total of 16 managers from areas of Spreading, Cutting, Sewing, Embroidery, Stamping, Finishing, and Metal Detection. The current state map was drafted by hand so as not to interfere with the development of the company’s operational activities. It is customary in this type of case study to resort to the method of triangulation of subjects (Díaz et al., 2011) to ensure the quality of the data and results obtained; therefore, the results obtained from the personal interviews conducted with the personnel in charge of each of the areas were contrasted.
RESULTS
Phase 1: External Analysis of the company
1. Economic activity
The company under study specializes in the manufacture of knitwear; it also has two specialized knitting and dyeing plants located in Peru, which manufacture and export their products to markets such as the United States and Brazil.
2. Main products
Smart casual cotton polo shirts for men and women
Printed dresses for women and other products for children
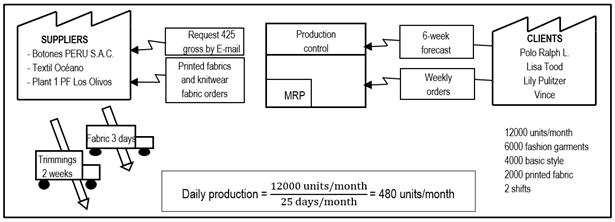
3. Select suppliers
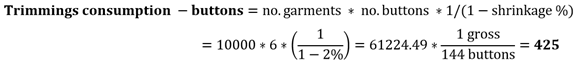
Trimmings supplier
The request is made by e-mail. On average, 6 decorative buttons are needed per garment, with a shrinkage of 2%. Delivery every 2 weeks.
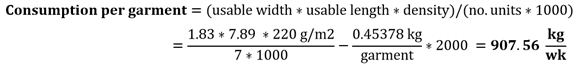
Printed fabric supplier
The request is made by e-mail. Consumption by size XS/1 S/2 M/3 L/1. Delivery every 3 days.
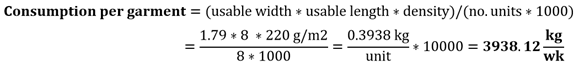
Knitwear supplier of textile and apparel company plant 1 Los Olivos
The request is made by e-mail. Consumption by size S/3 M/2 L/2 XL/2. Delivery every 2 days.
4. Main customers
The company’s direct customers are well-known department stores such as Black Denim, Lilly Pulitzer, Infinity, Polo Ralph Lauren, and Tommy Bahama. Repeat customers tend to place orders on a weekly basis and deliveries are made every 3 weeks per shipment.
5. Identify customer requirements
The customer of polo shirts of a certain brand requires that their garments carry a metal detection sticker indicating that their garments are of high quality and do not contain any harmful metals.
Confecciones Perú requires customers to place orders 6 weeks in advance.
On average, a total of 12 000 units are produced per month for each block: 4000 fashion garments/month, 6000 basic t-shirts/month and 2000 printed fabric garments/month.
Phase 2: Internal Analysis of the company
1. Calculate the daily production
Number of units that the company can produce during a working day

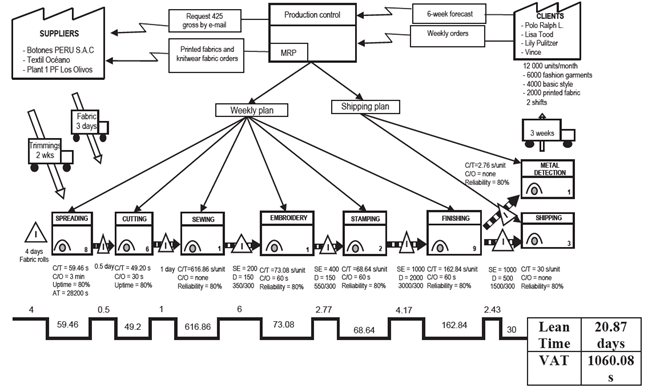
A graphic representation of the information flow is shown in Figure 2, consisting of customers, the company’s Production Control Area, and suppliers.
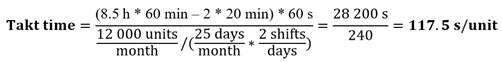
2. Calculate available time and takt time
The company works 25 days a month, two shifts in all areas, each work shift is 8.5 hours plus overtime if necessary, two 10-minute breaks per shift, and the lunch hour is unpaid.
Available time per shift = (8.5 h * 60 min − 2 * 20 min) * 60 s = 28 200 s
3. Gather information and map process flow with VSM
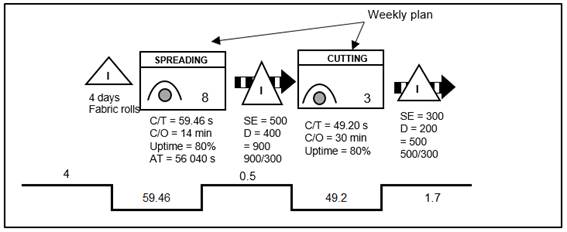
Spreading Area
Manual equipment, 2 operators per spreading table (4 tables), cycle time equal to 59.46 s, changeover time between sizes equal to 2 min, and reliability of 80%. Inventory before the start of the process: 3 days (supplier’s delay), 1 day of fabric rest, and inventory after process: 0.5 days.
Cutting Area
Manual equipment, 1 operator per machine, 3 working modules, cycle time equal to 49.20 s, changeover time between sizes equal to 5 min, and reliability of 100%. Inventory after process: 1 day.
The graphical representation of the Spreading and Cutting areas with their respective inventories in the process is shown in Figure 3.
Source: Prepared by the authors.
Figure 3 Graphical Representation of the Spreading and Cutting Areas.
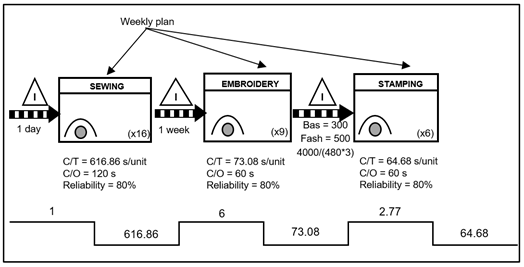
Sewing Area
Manual equipment, 1 operator per operation (average = 16), cycle time equal to 616.86 s/garment, changeover time between sizes equal to 1 min, and reliability of 80%. Inventory after process: 1 week.
Embroidery Area
Manual equipment, 1 operator, cycle time equal to 73.08 s/garment, changeover time between sizes equal to 60 s, and reliability of 100%. Inventory after process: 3500 basic garments and 500 fashion garments.
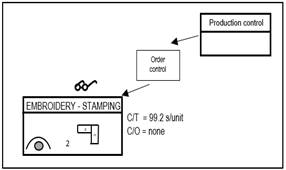
Stamping Area
Manual equipment, 3 operators per machine (2 machines), cycle time equal to 64.68 s/garment, changeover time between sizes equal to 60 s, and 100% reliability. Inventory after process: 4500 basic garments and 500 fashion garments.
The graphical representation of the Sewing, Embroidery, and Printing areas with their respective in-process inventories is shown in Figure 4.
Source: Prepared by the authors.
Figure 4 Graphical Representation of the Sewing, Embroidery, and Stamping Areas.
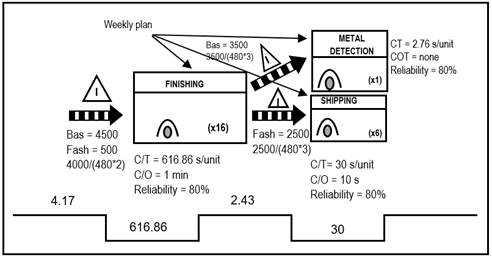
Finishing Area
Manual equipment, 9 operators (3 production lines), cycle time equal to 616.86 s/garment, changeover between sizes equal to 60 s, 100% reliability. Inventory after process: 3500 basic (metal detection area) and 2000 fashion (shipping area).
Metal Detection Area
One operator is needed, cycle time equal to 2.76 s/garment, changeover time between sizes: none, and 100% reliability. Once in the Metal Detection Area, trucks go every 3 weeks to the shipping port.
Shipping
Three operators are required, cycle time equal to 30 s/garment, and, once in dispatch, trucks go every 3 weeks to the port for shipment.
The graphical representation of the Finishing and Shipping areas with their respective in-process inventories is shown in Figure 5.
Source: Prepared by the authors.
Figure 5 Graphical Representation of the Finishing and Shipping Areas (final process).
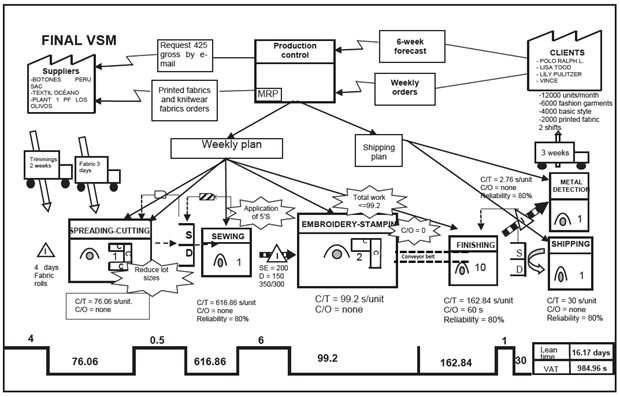
The previous graphical representations (Figures 2, 3, 4 and 5) allow the development of the current VSM of the textile and apparel company under study (Figure 6).
Phase 3: Drafting of future VSM
Question 1: What is the production cycle of the textile and apparel company?
Available time per shift = (8.5 h * 60 min * 60 s) = 30 600 s
Time not spent working = (20 min/shift * 60 s) * 2 shifts = 2400 s
Available time = 30 6000 s − 2400 s = 28 200 s
Customer demand per shift = (12 000/month÷ 25 days)/2 shifts = 240 units/shift
Production cycle = 28 200 s ÷ 240 units = 117.5 s/unit
Question 2: Should the textile and apparel company use its finished goods to restock supermarkets or produce them for direct shipment?
The textile and apparel company has a reliability of 80%, so an inventory of finished goods is unnecessary. If there is a supermarket, it should pass from Sewing to Finishing, inspection should be eliminated and a quality control evaluation should be performed.
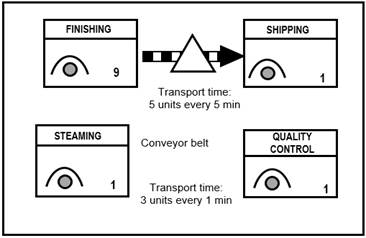
The transport time and number of garments between the finishing and dispatching processes, as well as steaming and quality control, are graphically represented in Figure 7.
Question 3: In which processes of the value chain can the textile and apparel company under study introduce continuous flow?

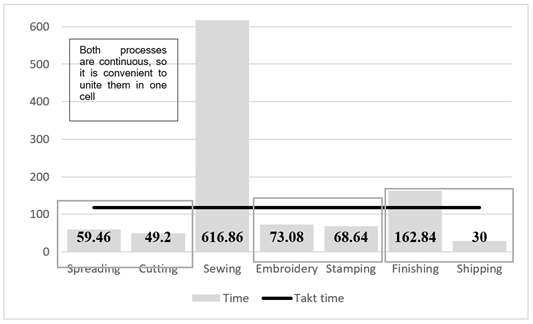
The maximum number of operators in the production cycle should be 9, yet such is not the case. Merging compatible operations and then converting them into cells is an option to improve their cycle time. Figure 8 shows the histogram of the cycle times of each process and its comparison with the takt time. In addition, processes with similar cycle times, such as “spreading” and “cutting”, “embroidery” and “stamping” are shown in Table 1.
Table 1 Time per Machine.
| Item | Machine | Time |
|---|---|---|
| 1 | Spreading | 59.46 s |
| 2 | Cutting | 49.2 s |
| 3 | Sewing | 616.86 s |
| 4 | Embroidery | 73.08 s |
| 5 | Stamping | 68.64 s |
| 6 | Finishing | 162.84 s |
| 7 | Shipping | 30 s |
| 8 | Takt time | 117.5 s |
Source: Prepared by the authors.
Source: Prepared by the authors.
The processes are merged to balance the number of operators since some of them have idle time.
Figure 8 Histogram of the Cycle Times of Each Process and Its Comparison with the Takt Time.
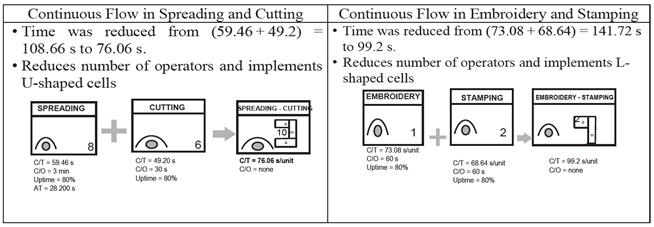
Upon noticing that the cycle times of “spreading” and “cutting”, and “embroidery” and “stamping” are similar, U-shaped and L-shaped cells will be implemented respectively to merge the processes in a continuous flow, thus eliminating in-process inventories and reducing the number of operators (Figure 9).
Source: Prepared by the author.
Figure 9 Improvements in the Continuous Flow in the Spreading and Cutting, Embroidery and Stamping Areas.
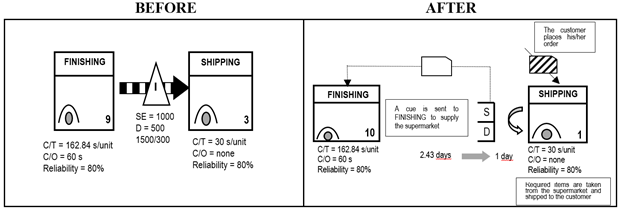
Following the training of personnel in the Shipping Area, only one person was left in charge of this area, and the other one was transferred to the Finishing Area, where more assistance is required in folding the garments (Figure 10).
Source: Prepared by the authors.
Figure 10 Improvements in the Continuous Flow of Inventory in the Finishing and Shipping Areas.
Question 4: Where will the textile and apparel company under study have to use a supermarket pull system?
A supermarket will be needed for fashion, basic, and printed t-shirts since their sales fluctuate greatly during the year; it is also necessary to control the production of fashion, basic, and printed t-shirts for men and women by extracting them from the supermarket (pull flow).
Suggestions
Suitable shelves with sufficient capacity and distributed according to model, size, and color
Increase the frequency of model and size changes (lean manufacturing)
Fashion garments = 6000/25 = 240 units/day
Basic style garments = 4000/25 = 160 units/day
Printed fabric garments = 2000/25 = 80 units/day
Shelf Spacing
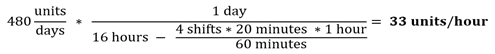
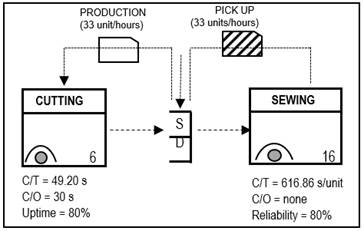
Each shelf space shall have the capacity to store one working hour or 33 garments. Each will have a Kanban card.
The operator transporting the 33 garments/hour from the Cutting to the Sewing cell will leave the Kanban card. The cutting area operator will receive the card and know that he has to produce another batch of 33 garments (Figure 11).
Question 5: What specific point in the production chain will the textile and apparel company choose (as a pacemaker process) to schedule production?
The processes prior to the pacemaker process must be in a continuous flow. The scheduling point for the textile and apparel company is the Embroidery-Stamping cell. Earlier scheduling is impossible since the cycle times of the cutting and sewing areas differ considerably.
Question 6: How could the textile and apparel company level the product mix in the pacemaker process?
In the Embroidery-Stamping cell, the garment mix produced in a shift is leveled through the pull-flow of the picked garments instead of maintaining so much inventory in the Dyeing-Cutting garment supermarket (Figure 12).
Pitch = takt time × number per package (1 package = 10 garments).
Pitch = 117.5 × 10 = 1175 s = 19 min 35 s
Question 7: What regular increment of work will the textile and apparel company use for production and pick-up in the pacemaker process?
There is an increase in work in the embroidery-printing module at the textile and apparel company: 117.5 seconds of production cycle × 33 units = 64.63 minutes. This garment production step corresponds to one card for every 33 garments. Table 2, called the leveling box, shows the scheduling of the production shifts.
Table 2 Production Shift Leveling Box.
| Shift 1 | 08:00 | 09:00 | 10:00 | 11:00 | 12:00 | 01:00 |
| Shift 2 | 03:00 | 04:00 | 05:00 | 06:00 | 07:00 | 08:00 |
| Fashion garments | M | M | ||||
| Basic style garments | B | B | ||||
| Printed fabric garments | E | E |
Source: Prepared by the authors.
Question 8: What process improvements will be needed to achieve the textile and apparel company’s value chain flow as described in the future state map?
The following are the improvements needed:
Reduce product changeover time in the Cutting Area to zero and lower the lot size to zero to reach the goal of “every piece, every shift”.
Eliminate the time (10 min) needed for changeover between garment types (basic, fashion, and printed) to achieve a continuous flow.
Improve production time in the sewing process by implementing 5’S.
These elements can be found in the future state map marked with the Kaizen icon in Figure 13.
Results of the comparison between the current state and the future are positive owing to the leveling of production in the Spreading-Cutting, Embroidery-Stamping, and Finishing-Shipping cells. The company can further reduce the amount of in-process and finished garments stored in supermarkets. Their conditions evidence the importance of equipment reliability and the ability to forecast production as a function of the cycle. Table 3 shows the before, with level-flow production, and with production with total inventory turnover leveling. A reduction in lead times and an increase in total inventory turnover are observed.
Table 3 Reduced Lead Times and Increased Total Annual Inventory Turnover.
| Rolls | Spreading and Cutting | Sewing | Embroidery and Stamping | Metal Detection | Production Lead Time | Total Inventory Turnover | |
| Before | 4 days | 1.5 days | 6 days | 6.94 days | 4.1 days | 2.76 days | 14 days |
| Continuous Flow Production | 3 days | 1 days | 4 days | 3 days | 2 days | 1.9 days | 20 days |
| Production with Leveling | 2 days | 0.5 days | 2.5 days | 1.5 days | 1 days | 1.5 days | 33 days |
Source: Prepared by the author.
Total Inventory turnover = Total days per year / Production lead time
Total days per year: 25 days × 12 = 300
Before: 300/20.87 = 14.37 <> 14
Production with continuous flow: 300/14.9 = 20.13 <> 20
Production with leveled flow: 300/9 = 33.33 <> 33
HYPOTHESIS TESTING
The research question posed in this study was the following: Is the VSM application method capable of increasing competitiveness in a textile and apparel company? Based on this question, a general hypothesis was formulated, as shown below:
Ho = There is no significant difference in competitiveness before and after the implementation of the VSM application method.
Ha = There is a significant difference in competitiveness before and after the implementation of the VSM application method
First, Anderson-Darling normality test was conducted using MINITAB 2018 software to verify the distribution of the data, which yielded a p-value of 0.161. As the significance coefficient was 0.05, it was concluded that the data followed a normal distribution.
Subsequently, a Student’s t-test was performed to test the hypothesis, which yielded a t-value of 8.31 and a p-value of 0.0000. Since the t-value is significantly higher than the p-value, the Ho is rejected, and the Ha is accepted. Therefore, it can be asserted that there is a significant difference in competitiveness before and after the implementation of the VSM application method.
DISCUSSION
A takt time of 117.5 s/unit was obtained through the application of the VSM, that is, the time that the company should take to manufacture the product and satisfy the customer. As for the time elapsed from the start of a production process until it is completed (lead time), the current state map shows a result of 20.87 days, while in the future state map, this was reduced to 16.7 days. In other words, this is the time it will take for the product to be delivered to the customer. Likewise, the current state map shows a value-added time (VAT) of 1060.08 seconds, understood as the time it takes for the product to be manufactured or transformed until the final result is obtained. These results are consistent with those obtained by Lucioni (2018), Lecaros (2018), and Ruíz (2016) on the usefulness of VSM as a tool for diagnosis that, by identifying waste in the operational processes of textile and apparel companies, together with other practices of the Lean methodology, allows them to increase their productivity. It also ratifies Rajadell and Sánchez (2011) and Xia and Sun (2013), who argue that it identifies non-value-added activities since it is a visual tool.
CONCLUSIONS
This study provides a method for the practical application of Value Stream Mapping as a tool for competitiveness in a textile and apparel company that manufactures garments for export, using the single-case methodology to obtain a detailed analysis of the subject under study. The collection of data and information about the company to develop the value stream map made it possible to detect the opportunities for improvement in a company like this one. Using daily operational management, problems were identified via comparative dashboards between standard and actual procedures. Production flow benefited considerably from this measure, as it allowed reducing waste and establishing a continuous product flow. The mentioned factors resulted in a significant reduction of time and waste, which in turn led to a reduction in costs and an increase in productivity and competitiveness in the organization’s processes.
REFERENCIAS
Amador Gandia, A., y García Cantó, M. (2019). Cómo aplicar Value Stream Mapping (VSM). 3C Tecnología. Glosas de innovación aplicadas a la pyme, 8(2), 68-83. http://doi.org/http://dx.doi.org/10.17993/3ctecno/2019. v8n2e30.68-83 [ Links ]
Bardales, E. (9 de febrero de 2018). Empresas de confecciones deben incorporar la innovación tecnológica, ¿cuánto es el costo?. Gestión. https://gestion.pe/economia/empresas-confecciones-deben-incorporar-innovacion-tecnologica-costo-226939-noticia/?ref=gesr [ Links ]
Becerra Guevara, K. M., y Carbajal Alayo, X. M. (2019). Propuesta de implementación de herramientas lean: 5s y estandarización en el proceso de desarrollo de producto en pymes peruanas exportadoras del sector textil de prendas de vestir de tejido de punto de algodón. (Tesis de grado). Universidad Peruana de Ciencias Aplicadas, Lima. https://doi.org/10.19083/tesis/625143 [ Links ]
Díaz De Salas, S. A., Mendoza Martínez, V. M., y Porras Morales, C. M. (2011). Una guía para la elaboración de estudios de caso. Razón y Palabra, 75. http://www.razonypalabra.org.mx/N/N75/varia_75/01_Diaz_V75.pdf [ Links ]
Jeong, B. K., y Yoon, T. E. (2016). Improving IT Process Management Through Value Stream Mapping Approach: A Case Study. Journal of Information Systems and Technology Management, 13(3), 389-404. https://doi.org/10.4301/s1807-17752016000300002 [ Links ]
Jimmerson, C. (2017). Value Stream Mapping for Healthcare Made Easy. Boca Raton, FL, EE. UU.: CRC Press. [ Links ]
Kafuku, J. M. (2019). Factors for Effective Implementation of Lean Manufacturing Practice in Selected Industries in Tanzania. Procedia Manufacturing, 33, 351-358. https://doi.org/10.1016/j.promfg.2019.04.043 [ Links ]
Lecaros Oviedo, F. A. (2018). Análisis y propuesta de mejora del proceso de producción de polos camiseros en una empresa textil utilizando la manufactura esbelta. (Tesis de grado). Universidad Católica San Pablo, Arequipa. https://repositorio.ucsp.edu.pe/bitstream/UCSP/15664/1/LECAROS_OVIEDO_FEL_POL.pdf [ Links ]
Loos, M. J., Silva, S. L., y Taboada Rodriguez, C. M. (2016). Value Stream Mapping: Practical Application in a Textile Company. Revista Espacios, 37 (27). https://www.revistaespacios.com/a16v37n27/16372728.html [ Links ]
Lucherini, F., y Rapaccini, M. (2017). Exploring the impact of Lean manufacturing on flexibility in SMEs. Journal of Industrial Engineering and Management, 10(5), 919-945. https://doi.org/10.3926/jiem.2119 [ Links ]
Lucioni Valcarcel, P. M. (2018). Método para la gestión de órdenes de producción basado en lean manufacturing, en empresas del sector textil confecciones; caso: Textiles Peruanos De Exportación S.A.C. (Tesis de maestría). Universidad Nacional de San Agustín de Arequipa, Arequipa [ Links ]
Marudhamuthu, R., Krishnaswamy, M., y Pillai, D. M. (2011). The Development and Implementation of Lean Manufacturing Techniques in Indian garment Industry. Jordan Journal of Mechanical and Industrial Engineering, 5(6), 527-532 [ Links ]
Moore Torres, R. K., y Norabuena Mendoza, C. H. (2019). Propuesta de normalización de proveedores de hilatura de fibra de alpaca de alta finura semindustrial en comunidades nativas alto andinas. (Tesis de grado). Universidad Del Pacifico, Lima. https://doi.org/http://hdl.handle.net/11354/2478 [ Links ]
Paredes Rodríguez, A. M. (2017). Aplicación de la herramienta Value Stream Mapping a una empresa embaladora de productos de vidrio. Entramado, 13(1), 262-277. https://doi.org/10.18041/entramado.2017v13n1.25103 [ Links ]
Rajadell Carreras, M., y Sánchez García, J. M. (2011). Lean Manufacturing. La evidencia de una necesidad. Madrid, España: Diaz de Santos [ Links ]
Rohac, T., y Januska, M. (2015). Value Stream Mapping Demonstration on Real Case Study. Procedia Engineering, 100, 520-529. https://doi.org/10.1016/j.proeng.2015.01.399 [ Links ]
Ruíz Huamaní, S. (2016). Implementación de herramientas de Lean Manufacturing en el área de producción de una empresa de confección de ropa industrial. (Tesis de grado). Universidad Nacional Mayor de San Marcos, Lima [ Links ]
Santander Mercado, A., Amaya Leal, J., y Viloria Núñez, C. (2014) Diseño de cadena de suministros resilientes. Barranquilla, Colombia: Editorial Universidad del Norte [ Links ]
Socconini, L. (2019). Lean manufacturing. Paso a paso. Barcelona, España: Marge books [ Links ]
Soler, V. G. (2015). Lean manufacturing. Qué es y qué no es, errores en su aplicación e interpretación más usuales. 3C Tecnología, 4(1) [ Links ]
Tinoco Gómez, O., Tinoco Ángeles, F., y Moscoso Huaira, E. (2016). Aplicación de las 5S para mejorar la percepción de cultura de calidad en microempresas de confecciones textiles en el Cono Norte de Lima. Industrial Data, 19(1), 33-37. https://doi.org/10.15381/idata.v19i1.12535 [ Links ]
Xia, W., y Sun, J. (2013). Simulation guided value stream mapping and lean improvement: A case study of a tubular machining facility. Journal of Industrial Engineering and Management , 6(2), 456-476.https://doi.org/10.3926/jiem.532 [ Links ]
Received: May 23, 2022; Accepted: July 05, 2022
 Este es un artículo publicado en acceso abierto bajo una licencia Creative Commons
