


Serviços Personalizados
Journal

Artigo
 texto em
  Inglês (pdf)
 Artigo em XML
 Referências do artigo
 Enviar este artigo por email
Indicadores
-
 Citado por SciELO
Links relacionados
-
 Similares em
SciELO
Similares em
SciELO
Compartilhar

 Permalink
Industrial Data
versão impressa ISSN 1560-9146versão On-line ISSN 1810-9993
Ind. data vol.26 no.1 Lima jan./jun. 2023
http://dx.doi.org/10.15381/idata.v26i1.23745
Production and Management
Digital Transformation Methodology to Increase the Competitiveness of Asset-Light Logistics SMEs in Peru

1MBA from Universidad Peruana de Ciencias Aplicadas (Lima, Peru). Currently working as manager at Entrega2 (Yucatán, Mexico). E-mail: jose.rojas@doctorado.unini.edu.mx
2PhD. Telecommunications engineer. Currently working as manager at Metalkor (Madrid, Spain). E-mail: jlajuria@yahoo.es
3PhD. Telecommunications engineer. Currently working as professor at the School of Engineering of Universidad Europea del Atlántico (Santander, Spain). E-mail: jon.arambarri@uneatlantico.es
The objective of this study was to design and implement a methodology based on digital transformation within a short period of time that allows SMEs in the asset-light logistics sector in Peru to increase their competitiveness. A mixed research approach with an exploratory sequential, observational and experimental design was used. The study population was 750 SMEs with a sample of 255 companies obtained through stratified probabilistic sampling. The inclusion criteria included having well-defined competitive strategies, a minimum of one year of operation, and postal code and operating license. The research instrument was a questionnaire of 189 questions grouped into variables including strategy, profitability, technical level, productivity, quality, and traceability. Based on the results, we conclude that the implementation of the proposed methodology enabled the digital transformation of the companies under study in a period of four months, thus increasing their competitiveness.
Keywords: digital transformation; productivity; competitiveness; logistics; SMEs.
INTRODUCTION
A total of 99.5% of Peru’s business structure is made up of MSMEs, which include micro-enterprises (96.2%), small enterprises (3.2%) and medium-sized enterprises (0.1%); SMEs in the logistics sector stand out among them, as their demand for services is steadily growing, particularly, in the transportation, warehousing, courier, and mail sub-sector, as it grew by 2.17% in 2019 compared to 2018 (Instituto Nacional de Estadística e Informática [INEI], 2021; Instituto de Economía y Desarrollo Empresarial [IEDEP], 2020). Between 2015 and 2018, their supply registered an average growth rate of 59%, though it declined by 29% in 2019 (Ministerio de Transporte y Comunicaciones [MTC], 2020). These companies experience diverse and ongoing problems, as approximately 90% of them operate for only 10 months due to their low level of competitiveness (Sociedad de Comercio Exterior del Perú [ComexPerú], 2020). This is evidenced by a low score in the logistics performance index (LPI), a measure of assessment of country logistics performance based on attributes such as customs service, infrastructure, international shipments, competence of logistics services, tracking and tracing, and timeliness of delivery. Peru obtained a score of 2.69 in 2018, which ranked it 83rd out of 160 countries assessed under that parameter (Jaramillo et al., 2018).
In recent times, companies have been looking for strategies to boost the economy and increase their revenues; thus, e-commerce emerges as a favorable channel to foster the sale of goods and services (Sánchez et al., 2021). E-commerce has been adopted by global and regional logistics companies, focused on improving their delivery process called “the last mile” (understood as the moment when the package arrives at the customer’s door), representing a real opportunity, since it entails short- and long-term benefits (Wilmsmeier et al., 2015). On the basis of the growth rate of e-commerce, Peru reports the highest growth in the region, capitalizing an increase of 131%, although 39% of Peruvians who shop online fear that the products will not be delivered properly (Cámara Peruana de Comercio Electrónico [CAPECE], 2021). Therefore, SMEs logistics performance requires improvement. One of the best ways to improve is through digital transformation, for el 60% de las pymes que se digitalizan logran facturar el doble de las que no se digitalizan [60% of SMEs that digitize manage to have a turnover twice as high as those that do not] (Ministerio de la Producción [PRODUCE], 2019, para. 6); however, it is advisable to consider the implementation time, which ranges between 3 and 4 years (Gil, 2018). Considering this context, the aim of our research was to determine the main factors that have an impact on the competitiveness of asset-light logistics SMEs and, based on the results, to design a methodology focused on digital transformation that can be implemented within a relatively short period. Our research hypothesis stated that competitiveness is positively impacted by factors related to it through the implementation of digital transformation in asset-light logistics SMEs.
Digital Transformation Models Applied to the Supply Chain in the Context of Industry 4.0
Digital transformation (DT) is primarily responsible for changing the industry, hence the expression Industry 4.0, in connection with the so-called fourth Industrial Revolution (Davenport & Harris, 2017). An inherent aspect of DT is its degree of maturity based on its implementation in companies. There are several models to measure maturity, notably the one proposed by Schumacher et al. (2019), which guides companies through a systematic procedure, considering their contact with Industry 4.0 and determining specific fields of action, realization projects and roadmaps.
The supply chain model for Industry 4.0 (Garay et al., 2020) has four pillars: virtual value creation and digital integration, material flow, real-time information and products and services flow; virtual value creation, value availability, digital service value, and digital integration value prevail as integrating elements to achieve this transformation, and data center service management (DCSM) acts as a guiding axis in the change processes.
The e-logistics model also deserves special mention. It aims to increase the traffic of end customers, carriers and companies related to freight transportation; its ultimate goal is to generate a competitive price via reverse online auction, based on the systematization of processes using hardware, software and web platforms (Valderrama et al., 2018). It should be noted that aspects such as the level of service, customization and compliance with delivery schedules were disregarded.
Strategic Model to Improve Last Mile Delivery Performance in E-Commerce Parcel Delivery
Last mile logistics is the most expensive and time-consuming stage in the delivery process (Duarte et al., 2017). It is an activity specific to asset-light logistics companies and is the most important factor in the relationship between the e-commerce retailer and the end customer, as the link between the two actors can be established or broken, directly affecting the customer’s decision to place a new order. Bopage et al. (2019) proposed a three-component strategic model to address the challenges proactively with an effective logistics strategy to drive the operating system in order to improve performance and increase the competitiveness of e-commerce. The strategy component refers to the various actions that converge in the organization’s overall strategy, including business planning and technological and human resources aimed at achieving operational excellence, which is based on the company’s capabilities and the competencies of the available workforce. The last mile operational performance component refers to the use of the organization’s resources, the quality of the services offered, lean systems related to operational efficiency and its impact on the environment. Finally, the benefits component refers to cost reduction, customer satisfaction, retailer satisfaction and external factors.
Model for Measuring the Competitiveness of Companies
The constant pursuit of competitiveness among service companies has led to the identification of factors that can impact it individually or as a whole, the most relevant of which are quality, price, technology, training and distribution channels Bonales et al., 2015), and some other factors such as innovation and productive flexibility ((Ramírez & Ampudia, 2018).
Methodology of Digital Transformation in Peruvian Asset-Light Logistics SMEs
The proposed digital transformation methodology leads to the design of a model that considers the improvement of six factors related to the logistics performance index (LPI) as inputs. The first is strategy, which provides all relevant information about the market sector within which the company operates, as well as the needs of customers, competitors and factors that may affect performance over time. Then comes quality, related to satisfying the needs of current customers and identifying new needs in the future. Then, productivity, related to the efficiency and effectiveness of internal processes, for which reason the existing technology and the performance of internal processes are taken into account. Then, traceability, related to the identification of the status of each goods or services requested to the SMEs, considering the customer’s need for information. Then, technical level, based on the current and future technical capabilities of the organization’s employees. And the last one is profitability, aimed at achieving the economic objectives. As for the outputs, the model is designed to obtain a digital strategy, optimize processes and align and develop competitive advantages (Figure 1).
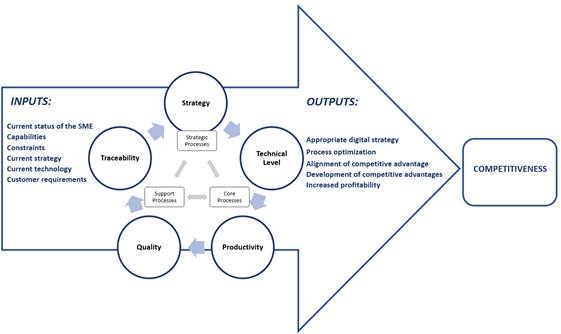
Source: Prepared by the authors
Figure 1 Digital Transformation Model to Increase the Competitiveness of SMEs in the Logistics Sector of Peru.
In the digital transformation model, it is important to consider the three types of processes present in companies: strategic, central and support processes (Ricardo et al., 2015). The digital plan, which must be aligned with the SME’s strategy, is developed in the strategic stage of the model; this is the first stage of the model and methodology that will allow the organization’s resources to be oriented efficiently, based on an analysis of the environment that influences the organization’s performance. The core processes aim to increase productivity and profitability of operations by structuring databases, omnichanneling and digitization of operational processes. Finally, the support processes aim to contribute to the good performance of the organization by means of its digital transformation (Bravo, 2009).
The digital transformation methodology in Peruvian logistics SMEs is broken down as follows:
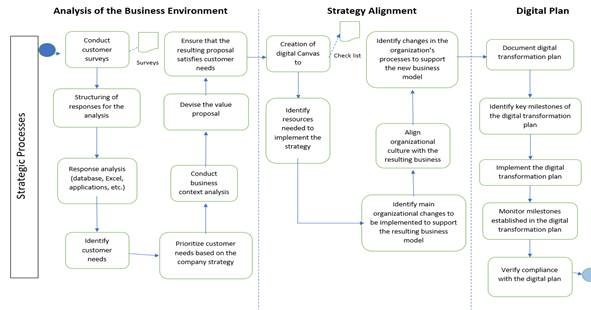
Methodology for Strategic Process
There are three main stages in the strategic process. In the first stage, an analysis of the environment is conducted focusing on the needs of customers and on how they are being met by the company. The second stage involves the alignment of the strategy expressed in a strategic plan that addresses short, medium and long-term components; a comparison of the current state of the strategy with the desired state is conducted to identify opportunities for improvement and determine the stages or actions that should be implemented to address the target market. Finally, the third stage entails deciding which actions to undertake and which will be prioritized; the digital plan is thus established, aimed at aligning current and future resources (human, infrastructure and technology) to the needs of customers and the external factors that affect the performance of asset-light logistics SMEs (Figure 2).
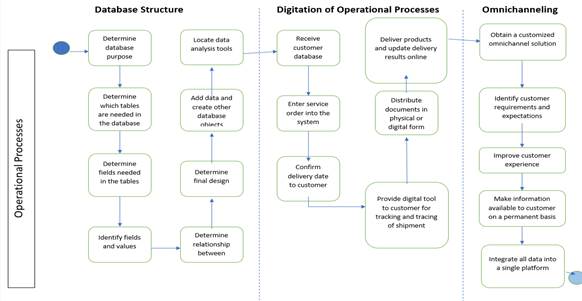
Methodology for Core Processes
The methodology for the core processes begins with the stage known as the structuring of databases of customers destined to receive goods or services. Its purpose is to streamline internal processes and capture the history of each recipient of the goods or services to be distributed based on the response levels of previous orders, as well as to facilitate the distribution process. Address inconsistencies are also detected at this stage, and transmitted to SME customers for correction, thus increasing the odds of delivery and reducing the number of distribution attempts, and ultimately improving productivity. In the second stage occurs the digitation of operational processes, which correlates with the traceability of each shipment requested to the SME. To this end, goods or services must be identified by means of a unique code, allowing customers or users of logistics services to identify the status of each request and its history. Various means of communication are used for this purpose, including websites and apps, among others. Finally, the third stage concerns omnichanneling, that is, communication with the recipients or customers of light-asset logistics SMEs in a two-way flow of information, for which both the applications and the way of accessing traceability information must contemplate multiple communication channels (Figure 3).
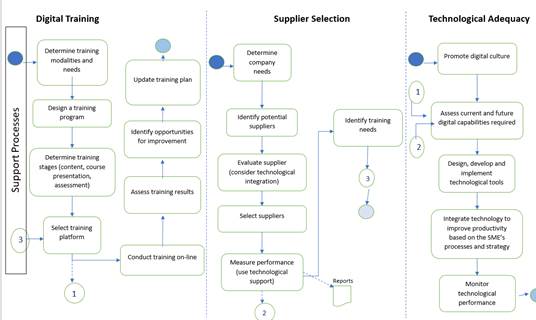
Methodology for Support Processes
The methodology for the support processes was structured in three stages. The first is the digital training process and involves the development of digital competencies in workers. The second is the supplier selection process, focusing on suppliers involved in the distribution processes that have an impact on service quality. The third stage involves technological adequacy, which involves the promotion of digital culture in light-asset logistics SME, and the assessment of the effectiveness of technological implementations (Figure 4).
METHODOLOGY
A mixed approach was used because both quantitative and qualitative methods were applied during the various stages of the research study (Pulido et al., 2012). The exploratory sequential design was also used, because qualitative data were collected and analyzed in the first stage, and quantitative data were collected and analyzed in the second stage, since variables were measured to describe the phenomenon under study. Several data collection strategies were used (documentary review, in-depth interview and questionnaire in companies of the sector), as well as analysis strategies (content, documentary, data by stratification and interviews).
Two types of research design were considered: observational and experimental. For the observational design, the study population consisted of 750 SMEs in the light-asset logistics sector in Peru (MTC, 2020) with a sample of 255 companies, which was obtained using the formula for finite populations. As the number of logistics SMEs in Peru is not homogeneous in each geographical department, stratified probability sampling was applied. There were 129 companies in the city of Lima, 33 in Arequipa, 33 in La Libertad and 12 in Cuzco, Piura, Lambayeque-Chiclayo, Loreto and Cajamarca. The inclusion criteria for the study considered SMEs in the logistics sector with more than one year of operations in the market, competitive strategies such as operational excellence, leadership in products and services and customer intimacy, operating licenses and postal code.
The research instrument was a questionnaire of 189 questions grouped into variables including strategy, profitability, technical level, productivity, quality and traceability (Table 1).
Table 1 Components of the Competitiveness Questionnaire for Light-Asset Logistics SMEs.
| LPI Indicator Component | Digital Canvas Component | Digital Transformation Component | Independent Variables Competitiveness Model | Number of Questions | Methodology Impact Factor |
|---|---|---|---|---|---|
| Competitiveness and quality of logistics services | Market segmentation | - Process - Operational support |
Strategy | 24 | 13% |
| Revenue source | - Process | Profitability | 12 | 6% | |
| Cost structure | |||||
| Key partners | - Process - Operational support |
Technical level | 55 | 29% | |
| Key resources | - Staff capacity - Culture |
||||
| Infrastructure | Key resources | Operational support | Productivity | 40 | 21% |
| Quality | Key activities | Process | Quality | 28 | 15% |
| Tracking and Tracing | Channels | - Process - Operational support |
Traceability | 30 | 16% |
| Customer relationship | Contact points | ||||
| Total | 189 | 100% | |||
Source: Prepared by the authors.
The purpose of the questionnaire was to determine the current level of competitiveness of light logistics SMEs and their level of digital transformation maturity (Schumacher et al., 2019) based on 6 categories (Table 2).
Table 2 Digital Maturity Levels.
| Category | Digital Transformation Level | Characteristics | Digital Transformation Index Value |
|---|---|---|---|
| 1 | Stationary | No digital features, traditional business model, no structured information, processes are manual and not integrated. The SME has not adapted to market demands. | 0.000 - 0.166 |
| 2 | Explorer | Few digital features. The SME has recently adapted to market demands or has recently embarked on an organizational change oriented towards digital transformation and measurement of competitiveness. | 0.167 - 0.333 |
| 3 | Intermediate | Processes have been implemented using basic digital tools. The SME is aware of the technological demands and manages databases, processes and digital tools, though they are not integrated. Customer information is partially monitored. | 0.334 - 0.500 |
| 4 | Revolutionary | The SME has adapted to the digital demands of the market and its processes are structured and supported with digital systems and tools used by highly trained workers. Data management and structuring is also complete. | 0.501 - 0.666 |
| 5 | Competitive | The SME is consolidated in the market and competes with leading companies in digital transformation. It has highly digitized processes and has automated most of its manual operations. Its strategy is based on the information in its structured database and its employees are highly trained in the use of digital tools. | 0.667 - 0.833 |
| 6 | Leader | The SME leads the market in terms of products, services and fully digital processes. It seeks new tools to remain a market leader and has a high level of customer retention. | 0.834 - 1.000 |
Source: Prepared by the authors.
For the scale used, the level of digital transformation considered that leading companies can obtain a maximum value of one (1) as digital transformation index (DTI) and every level lower than “leader” would have a lower index value correlated with the level of digital transformation. The value (1) was obtained by dividing the sum of the result of the total number of questions of the administered questionnaire by the maximum possible value to be reached.
The determination of the variables contained in the questionnaire led to an exploratory factor analysis (Izquierdo et al., 2014). The values obtained revealed that all the factors were relevant; subsequently, the reliability and internal consistency of the data collection instrument was measured using Cronbach’s alpha (Rodríguez & Reguant, 2020), yielding a value of 0.946, thus demonstrating its suitability. The SPSS v27 software was used for data processing.
For the experimental design, a population of 255 SMEs was considered with a sample size of 154 SMEs, which was obtained using the formula for finite populations, was considered. Stratified sampling was also applied; therefore,78 companies in Lima, 20 companies in Arequipa and La Libertad, and 7 companies in Cuzco, Piura, Lambayeque (Chiclayo), Loreto and Cajamarca were considered.
The experimental approach consisted in developing a roadmap, based on the responses obtained from the questionnaire, to identify the level of digital transformation of each company. The score obtained for each variable revealed the level of development of each company in relation to its desired level of development. Subsequently, improvement actions were implemented in each of the variables under study (strategy, profitability, technical level, productivity, quality and traceability). Once the actions had been determined, they were implemented over a period of four months. At the end of this period, the resulting activities were evaluated, and the questionnaire was administered again for a new analysis of the DTI. Each SME chose the direction or variable by which to start, according to the results of the initial analysis.
RESULTS
Digital Transformation Level
The DTI was determined according to the achieved level of the SMEs under study. Most of them were classified as intermediate (58.82 %), followed by revolutionary (18.82 %), competitive (14.51 %) and explorer (7.84 %) (Table 3).
Table 3 Classification of SMEs Based on the Digital Transformation Index Level.
| Digital Transformation Index Value | Digital Transformation Level | Number of SMEs | Percentage of SMEs |
|---|---|---|---|
| 0.000 - 0.166 | Stationary | 0 | 0.00% |
| 0.167 - 0.333 | Explorer | 20 | 7.84% |
| 0.334 - 0.500 | Intermediate | 150 | 58.82% |
| 0.501 - 0.666 | Revolutionary | 48 | 18.82% |
| 0.667 - 0.833 | Competitive | 37 | 14.51% |
| 0.834 - 1.000 | Leader | 0 | 0.00% |
Source: Prepared by the authors.
There is a low level of digital transformation, since approximately 66.66% of the companies do not surpass the intermediate level, hindering the promotion of e-commerce in Peru, as the restrictions that discourage it are related to traceability and the costs of the service.
Digital Transformation Model
The results showed that all variables are highly correlated with the level of digital transformation of each light-asset logistics SME; therefore, by improving such variables, the level of digital transformation and, thereby, the competitiveness of each SME would increase. It should be noted that the highest correlation is observed in the productivity variable (0.9260) and the lowest in the profitability variable (0.8588) (Table 4).
Table 4 Correlation Level of the Variables with Digital Transformation.
| Variable | Correlation with the Level of Digital Transformation |
|---|---|
| Strategy | 0.9081 |
| Profitability | 0.8588 |
| Technical Level | 0.8720 |
| Productivity | 0.9260 |
| Quality | 0.9408 |
| Traceability | 0.9060 |
Source: Prepared by the authors.
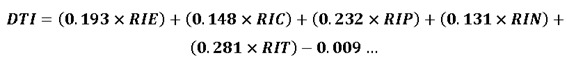
Multiple linear regression was used to determine the coefficients and the equation for predicting the results related to the level of digital transformation, given that each variable affects competitiveness differently. It was found that traceability and productivity are the most relevant variables and the ones that exert the greatest influence on the final model (Table 5).
Table 5 Coefficients of the Variables of the Digital Transformation Model.
| Coefficients | ||||||
|---|---|---|---|---|---|---|
| Model | Unstandardized Coefficients | Standardized Coefficients | t | Sig. | ||
| B | Std. Error | Beta | ||||
| 5 | (Constant) | −0.009 | 0.003 | −2.824 | 0.005 | |
| Quality | 0.148 | 0.007 | 0.229 | 22.051 | 0.000 | |
| Strategy | 0.193 | 0.010 | 0.172 | 19.041 | 0.000 | |
| Productivity | 0.232 | 0.012 | 0.233 | 19.519 | 0.000 | |
| Traceability | 0.281 | 0.008 | 0.304 | 33.218 | 0.000 | |
| Technical Level | 0.131 | 0.009 | 0.153 | 15.009 | 0.000 | |
a. Dependent variable: INDEX.
Source: Prepared by the authors.
Finally, considering the above coefficients, the model was described with the following equation (1):
Validation of Results Obtained by the Application of the Model and Methodology
To validate the impact of the results obtained, normality tests were performed to determine the extent to which the distribution of the observed data differed from that expected under a normal distribution with the same mean and standard deviation. The Kolgomorov-Smirnov and Shapiro-Wilk tests were used for this purpose (Table 6). For the purpose of optimizing data processing, a code was assigned to each variable as follows: code R2, corresponding to quality variable (RIC); code R3, corresponding to productivity variable (RIP); code R4, corresponding to technical level variable (RIN); code R23, corresponding to variables RIC, RIP; code R134, corresponding to the variables RIE, RIP, RIN; code R234, corresponding to the variables RIC, RIP, RIN; code R2345, corresponding to the variables RIC, RIP, RIN, RIT; and code R12345, corresponding to the variables RIE, RIC, RIP, RIN, RIT.
Table 6 Changes in the Digital Transformation Index.
| Tests of Normality, , , | Changes | Test | Result | ||||||
|---|---|---|---|---|---|---|---|---|---|
| Kolmogorov-Smirnov | Shapiro-Wilk | ||||||||
| CODCAM | Statistic | df | Sig. | Statistic | df | Sig. | |||
| R12345 | 0.180 | 4 | 0.984 | 4 | 0.926 | RIERICRIPRINRIT | Shapiro-Wilk | Parametric | |
| R134 | 0.167 | 7 | .200* | 0.974 | 7 | 0.924 | RIERIPRIN | Shapiro-Wilk | Parametric |
| R2 | 0.345 | 7 | 0.012 | 0.732 | 7 | 0.008 | RIC | Shapiro-Wilk | Non-Parametric |
| R23 | 0.089 | 50 | .200* | 0.981 | 50 | 0.581 | RICRIP | Kolmogorov-Smirnov | Parametric |
| R234 | 0.125 | 23 | .200* | 0.951 | 23 | 0.310 | RICRIPRIN | Shapiro-Wilk | Parametric |
| R2345 | 0.344 | 4 | 0.822 | 4 | 0.149 | RICRIPRINRIT | Shapiro-Wilk | Parametric | |
| R3 | 0.133 | 48 | 0.034 | 0.944 | 48 | 0.023 | RIP | Kolmogorov-Smirnov | Non-Parametric |
| R4 | 0.264 | 7 | 0.149 | 0.887 | 7 | 0.262 | RIN | Shapiro-Wilk | Parametric |
*. This is a lower bound of the true significance.
a. DIFER is constant when CODCAM = R123. It has been omitted.
b. DIFER is constant when CODCAM = R1234. It has been omitted.
c. Lilliefors significance correction.
d. DIFER is constant when CODCAM = R1235. It has been omitted.
f. DIFER is constant when CODCAM = R34. It has been omitted.
Source: Prepared by the authors.
The following hypotheses were used for statistical testing:
Ho: The difference of indexes has a normal behavior.
Ha: The difference of indexes does not have a normal behavior.
As the significance level is less than 0.05, which is the established error for the study, the null hypothesis is rejected, and the alternative hypothesis is accepted. Consequently, the behavior of each variable was analyzed using parametric and non-parametric tests.
Analysis Using Parametric Tests
Upon verifying that the variables had parametric behavior, we compared the means of each of them using Student’s t-test for each variable and stating the following hypotheses:
Ho: DTIB = DTIA
Ha: DTIB ≠ DTIA
Where: Ho is the null hypothesis, Ha is the alternative hypothesis, DTIB is the digital transformation index before implementation, DTIA is the digital transformation index after implementation.
Test for Changes in the Variables Under Study
The results show the growth of the mean in the digital transformation index, as for code R12345 with 48.39%, code R134 with 37.42%, code R23 with 5.87%, code R234 with 10.03%, code R2345 with 24.78% and code R4 with 24.78%.
The use of the methodology was validated using the values of the digital transformation index obtained by the light-asset logistics SMEs before the application of the model (DTIB) and after the application (DTIA), as well as the calculation of the deviations and errors in each of the indexes through the Student’s t-test (Table 7).
Table 7 Parametric Analysis of Variables Under Study.
| Coded Variables | Paired Samples Statistics | |||||
|---|---|---|---|---|---|---|
| Description | Mean | N | Std. Deviation | Std. Error | ||
| EN RIERICRIPRINRIT = R12345 | Pair 1 | DTIB | 0.264169 | 4 | 0.012694 | 0.006347 |
| DTIA | 0.392003 | 4 | 0.014983 | 0.007491 | ||
| RIERIPRIN = R134 | Pair 1 | DTIB | 0.301990 | 7 | 0.041841 | 0.015814 |
| DTIA | 0.414990 | 7 | 0.034832 | 0.013165 | ||
| RICRIP = R23 | Pair 1 | DTIB | 0.439883 | 50 | 0.033879 | 0.004791 |
| DTIA | 0.465687 | 50 | 0.029713 | 0.004202 | ||
| RICRIPRIN = R234 | Pair 1 | DTIB | 0.403007 | 23 | 0.019745 | 0.004117 |
| DTIA | 0.443448 | 23 | 0.017874 | 0.003727 | ||
| RICRIPRINRIT = R2345 | Pair 1 | DTIB | 0.316983 | 4 | 0.005736 | 0.002868 |
| DTIA | 0.395543 | 4 | 0.011770 | 0.005885 | ||
| RIN = 4 | Pair 1 | DTIB | 0.769001 | 7 | 0.008273 | 0.003127 |
| DTIA | 0.771159 | 7 | 0.008579 | 0.003243 | ||
Source: Prepared by the authors.
The statistical results reject the null hypothesis (significance value of less than 0.05), proving that the methodology provoked changes in the variables under study. It can therefore be concluded that the variables described are directly impacted by the level of digital transformation, as improvement of processes and implementation of actions based on the needs of light-asset logistics SMEs was demonstrated (Table 8).
Table 8 Pair Samples Test of the Variables Under Study.
| Coded Variables | Description | Paired Differences | T | df | Sig. (2-tailed) | |||||
|---|---|---|---|---|---|---|---|---|---|---|
| Mean | Std. Deviation | Std. Error | 95% Confidence Interval of the Difference | |||||||
| Lower | Upper | |||||||||
| RIERICRIPRINRIT = R12345 | Pair 1 | DTIB - DTIA | -0.127834 | 0.007451 | 0.003726 | -0.139691 | -0.115977 | -34.311 | 3 | 0.000 |
| RIERIPRIN = R134 | Pair 1 | DTIB - DTIA | -0.113000 | 0.010098 | 0.003817 | -0.122340 | -0.103661 | -29.606 | 6 | 0.000 |
| RICRIP = R23 | Pair 1 | DTIB - DTIA | -0.025805 | 0.009465 | 0.001338 | -0.028495 | -0.023115 | -19.279 | 49 | 0.000 |
| RICRIPRIN = R234 | Pair 1 | DTIB - DTIA | -0.040442 | 0.010707 | 0.002233 | -0.045072 | -0.035811 | -18.114 | 22 | 0.000 |
| RICRIPRINRIT = R2345 | Pair 1 | DTIB - DTIA | -0.078560 | 0.009494 | 0.004747 | -0.093667 | -0.063453 | -16.549 | 3 | 0.000 |
| RIN = 4 | Pair 1 | DTIB - DTIA | -0.002158 | 0.000451 | 0.000170 | -0.002575 | -0.001741 | -12.667 | 6 | 0.000 |
Source: Prepared by the authors.
Analysis using nonparametric tests.
Regarding the non-parametric analysis, the Wilcoxon statistical test was used, and the hypotheses posed were as follows:
Ho: DTIB = DTIA
Ha: DTIB ≠ DTIA
Where: Ho is the null hypothesis, and Ha is the alternative hypothesis.
The treatment led to the analysis of the RIP (productivity) and RIC (quality) variables, yielding a 1.15% increase in the mean of digital transformation index for the first variable and 0.53% for the second variable (Table 9).
Table 9 Descriptive Analysis of the Variable Under Study.
| Coded Variables | Descriptive Statistics | |||||
|---|---|---|---|---|---|---|
| Description | N | Mean | Std. Deviation | Min. | Max. | |
| RIP = R3 | DTIB | 48 | 0.524932 | 0.072263 | 0.447332 | 0.726835 |
| DTIA | 48 | 0.530785 | 0.072602 | 0.456266 | 0.730806 | |
| RIC = R2 | DTIB | 7 | 0.783858 | 0.006080 | 0.771542 | 0.791038 |
| DTIA | 7 | 0.788025 | 0.006106 | 0.775077 | 0.794573 | |
Source: Prepared by the authors.
The Wilcoxon test results showed a significance level of less than 0.05; therefore, the null hypothesis was rejected, demonstrating the positive impact of the digital transformation methodology (Table 10).
Table 10 Pair Samples Test of the Variables Under Study.
| Coded Variables | Test Statistics | |
|---|---|---|
| Description | DTIA - DTIB | |
| RIP = R3 | Z | −5.980 |
| Asymp. Sig. (2-tailed) | 0.000 | |
| RIC = R2 | Z | −2.414 |
| Asymp. Sig. (2-tailed) | 0.016 | |
a. Wilcoxon Signed Ranks Test.
b. Based on negative ranks.
Source: Prepared by the authors.
Finally, competitiveness was calculated. It revealed important changes in the SMEs’ level: 5% of SMEs in the explorer level transitioned to the intermediate level, and 3.14% of SMEs in the intermediate level transitioned to the revolutionary level. In terms of the increase in competitiveness, SMEs in intermediate stage registered an increase of 8.59%, SMEs in revolutionary stage registered an increase of 2.62% and SMEs in competitive stage registered an increase of 2.60% (Table 11).
Table 11 Increase in the Competitiveness of SMEs Based on the Implementation of the Digital Transformation Methodology.
| Digital Transformation Level | DTI Range | No. of SMEs after implementation | Percentage of SMEs after implementation | Competitiveness Increase |
|---|---|---|---|---|
| Stationary | y < 0.171 | 0 | 0.00% | N/A |
| Explorer | 0.171 < y < 0.340 | 0 | 0.00% | N/A |
| Intermediate | 0.340 < y < 0.513 | 120 | 77.92% | 8.59% |
| Revolutionary | 0.513 < y < 0.680 | 17 | 11.04% | 2.62% |
| Competitive | 0.680 < y < 0.850 | 17 | 11.04% | 12.60% |
| Leader | y < 0.850 | 0 | 0.00% | 0.00% |
Source: Prepared by the authors.
DISCUSSION
Study results, including that of Schumacher et al. (2019), are used to identify the degree of digital maturity of a company based on qualitative information. Our methodological proposal, on the other hand, quantitatively assesses the degree of digital transformation and determines the state of digital maturity of each light-asset logistics SME. For instance, a low level of digital transformation was determined in the Peruvian scenario, as 66.66% of the SMEs do not surpass the intermediate level, hindering the promotion of e-commerce in Peru. From this, it is possible to plan actions to improve the level of digital transformation.
Research by Bonales et al. (2015), Ramírez and Ampudia (2018) separately identify the variables related to competitiveness; in contrast, the methodology and model described in our research do not only identify variables specific to the logistics sector but also determine the impact of each one of them on competitiveness and suggest concrete actions to quickly obtain them.
It should be noted that existing methodologies and models exhibit limitations in terms of the steps to follow for an adequate digital transformation and quick results; they are not sufficiently flexible to the needs of the companies, as it takes an average of two to three years to increase their level of digital maturity. Conversely, our proposal allows each light-asset logistics SME to identify certain variables based on its needs and capabilities to focus its resources and efforts on clear milestones. As a result, SMEs transition from one stage to another within the first four months of implementation and increase their competitiveness.
CONCLUSIONS
The digital transformation methodology enabled light-asset logistics SMEs to increase their competitiveness in the short term. Companies in the competitive stage showed an increase of 12.60% and companies in the intermediate stage showed an increase of 8.59%, thereby strengthening the Peruvian industry. Each company chose the actions to be implemented based on the resulting roadmap and according to its needs and objectives. Also, the implementation of the digital transformation process was reduced to four (4) months, whereas the current models have implementation times of 3 to 4 years. This reduction extends the lifetime of the SMEs to more than 10 months, which is their current survival period in the market. The proposed methodology is highly flexible to the needs of each light-asset logistics SME, easing its implementation and making it possible to identify variables that are relevant to its competitiveness according to its capabilities and resources.
REFERENCIAS
Bonales Valencia, J., Zamora Torres, A. I., y Ortíz Paniagua, C. F. (2015). Variables e Índices de Competitividad de las Empresas Exportadoras, utilizando el PLS.Cimexus,10(2), 13-32. https://cimexus.umich.mx/index.php/cim1/article/view/222 [ Links ]
Bopage, G., Nanayakkara, J., y Vidanagamachchi, K. (5-7 de marzo de 2019). A Strategic Model to Improve the Last Mile Delivery Performance in E-commerce Parcel Delivery. Proceedings of the International Conference on Industrial Engineering and Operations Management. http://www.ieomsociety.org/ieom2019/papers/531.pdf [ Links ]
Bravo Carrasco, J. (2009). Gestión avanzada de procesos. Santiago de Chile, Chile: Evolución S.A. [ Links ]
Cámara Peruana de Comercio Electrónico (2021). Reporte oficial de la industria Ecommerce en Perú. https://www.capece.org.pe/wp-content/uploads/2021/03/Observatorio-Ecommerce-Peru-2020-2021.pdf [ Links ]
Davenport, T. H., y Harris, J. G. (2017).Competing on Analytics: Updated, with a New Introduction: The New Science of Winning. Boston, MA, EE. UU.: Harvard Business Press. [ Links ]
Duarte Toledo, J. J., Mosquera Castañeda, L., Velásquez Rey, A. F., Sabogal Fernández, J. A., y Bernal Zúñiga, J. A. (2017). Supply chain management y logística empresa Argos SA. (Diplomado de profundización para grado). Universidad Nacional Abierta y a Distancia, Bogotá. https://repository.unad.edu.co/handle/10596/14876 [ Links ]
Garay Rondero, C. L., Martinez Flores, J. L., Smith, N. R., Caballero Morales, S. O., y Aldrette Malacara, A. (2020). Digital supply chain model in Industry 4.0.Journal of Manufacturing Technology Management, 31(5), 887-933. https://doi.org/10.1108/JMTM-08-2018-0280 [ Links ]
Gil Mena, F. (22 de octubre de 2018). ¿Cuánto tiempo puede tomarle a una empresa transformarse digitalmente? Gestión. https://gestion.pe/tecnologia/tomarle-empresa-transformarse-digitalmente-247542-noticia/ [ Links ]
Instituto de Economía y Desarrollo Empresarial. (2020). Perú, programa económico 2016-2021. https://apps.camaralima.org.pe/repositorioaps/0/0/par/iedep2016_libroprogramaecono/libro%20iedep_paraweb.pdf [ Links ]
Instituto Nacional de Estadística e Informática. (2021). Informe Técnico de Comportamiento de la Economía Peruana en el Cuarto Trimestre de 2020. https://www.gob.pe/institucion/inei/informes-publicaciones/2993471-comportamiento-de-la-economia-peruana-en-el-cuarto-trimestre-de-2020 [ Links ]
Izquierdo, I., Olea, J., y Abad, F. J. (2014). El análisis factorial exploratorio en estudios de validación: Usos y recomendaciones. Psicothema, 26(3), 395-400. https://www.redalyc.org/pdf/727/72731656015.pdf [ Links ]
Jaramillo, C. F., Freund, C., Reis, J. G., Arvis, J. F., Wiederer, C. K., Ojala, L. M., Shepherd, B. A., Raj, A. U. L., Dairabayeva, K. S., y Kiiski, T. M. M. (2018). Connecting to Compete 2018: Trade Logistics in the Global Economy - The Logistics Performance Index and its Indicators. World Bank Group. https://policycommons.net/artifacts/1460657/connecting-to-compete-2018/2101890/ [ Links ]
Ministerio de la Producción. (2019). Produce lanzará el Kit Digital 2.0 y rediseñará la plataforma Emprendedor Peruano para potenciar la digitalización de las MYPE. https://www.gob.pe/institucion/produce/noticias/28341-produce-lanzara-el-kit-digital-2-0-y-redisenara-la-plataforma-emprendedorperuano-para-potenciar-la-digitalizacion-delas-mype [ Links ]
Ministerio de Transportes y Comunicaciones. (2020). Concesiones en infraestructura de transporte. https://portal.mtc.gob.pe/transportes/concesiones/concesiones_transportes.html [ Links ]
Pulido, H. G., De la Vara Salazar, R., González, P. G., Martínez, C. T., y Pérez, M. D. C. T. (2012). Análisis y diseño de experimentos. New York, NY, EE. UU.: MCGraw-Hill. [ Links ]
Ramírez Molina, R. I., y Ampudia Sjogreen, D. M. (2018). Factores de competitividad empresarial en el sector comercial. Revista RECITIUTM, 4(1). https://repositorio.cuc.edu.co/handle/11323/2249 [ Links ]
Ricardo Cabrera, H., Medina León, A. M., Nogueira Medina, D., y Núñez Chaviano, Q. (2015). Revisión del estado del arte para la gestión y mejora de los procesos empresariales.Enfoque UTE, 6(4), 1-22. https://doi.org/10.29019/enfoqueute.v6n4.75 [ Links ]
Rodríguez Rodríguez, J., y Reguant Álvarez, M. (2020). Calcular la fiabilidad de un cuestionario o escala mediante el SPSS: el coeficiente alfa de Cronbach.REIRE Revista d'Innovació i Recerca en Educació,13(2), 1-13. https://doi.org/10.1344/reire2020.13.230048 [ Links ]
Sánchez Solís, Y., Palomino Torres, E. F., Salinas Loarte, E. A., Bedoya Campos, Y. Y., y Flores Vilcapoma, L. R. (2021). Entorno económico y niveles de competitividad de las regiones menos competitivas del Perú.Revista Publicando, 8(30), 1-13. https://doi.org/10.51528/rp.vol8.id2195 [ Links ]
Schumacher, A., Nemeth, T., y Sihn, W. (2019). Roadmapping towards industrial digitalization based on an Industry 4.0 maturity model for manufacturing enterprises.Procedia CIRP,79, 409-414. https://doi.org/10.1016/j.procir.2019.02.110 [ Links ]
Sociedad de Comercio Exterior del Perú (2020). Las micro y pequeñas empresas en el Perú: resultados en 2020. https://www.comexperu.org.pe/upload/articles/reportes/reporte-mypes-2020.pdf [ Links ]
Valderrama Pérez, L. W., Yábar Vega, B. Y. P., Velarde Molina, J. F., y Díaz Zelada, Y. F. (2018). Diseño de un modelo de e-logística para un operador logístico peruano.3C Tecnología, 7(4), 86. http://dx.doi.org/10.17993/3ctecno.2018.v7n4e28.86-103/ [ Links ]
Wilmsmeier, G., Johansson, L., y Jallow, D. (2015). El complejo rompecabezas del transporte urbano de mercancías. CEPAL. https://www.cepal.org/es/publicaciones/39299-complejo-rompecabezas-transporte-urbano-mercancias [ Links ]
Received: October 08, 2022; Accepted: December 13, 2022
 Este es un artículo publicado en acceso abierto bajo una licencia Creative Commons
