


Servicios Personalizados
Revista

Articulo
 texto en
  Inglés (pdf)
 Articulo en XML
 Referencias del artículo
 Enviar articulo por email
Indicadores
-
 Citado por SciELO
Links relacionados
-
 Similares en
SciELO
Similares en
SciELO
Compartir

 Permalink
Industrial Data
versión impresa ISSN 1560-9146versión On-line ISSN 1810-9993
Ind. data vol.26 no.1 Lima ene./jun. 2023
http://dx.doi.org/10.15381/idata.v26i1.19666
Production and Management
Impact of Mining Exports and Production on the Economic Growth of the Apurimac Region in 2004-2016

1 Economist from Universidad Nacional Federico Villareal. Master’s degree in Economic Politics from Universidad Nacional Mayor San Marcos (Lima, Peru). Currently teaching at the School of Economic Sciences of Universidad Nacional Mayor San Marcos (Lima, Peru). E-mail: aandresz@unmsm.edu.pe
This study analyzes the impact of mining and agricultural exports on the economic development of the Apurimac region during the period of 2004-2016. It also studies the organization of the region in the period 2004-2016 where agriculturally, potato production is notable, as well as tourism and the mining sector’s production from Las Bambas. The Las Bambas mining megaproject (Las Bambas), which started production in 2016, exports copper and non-traditional products such as coffee and avocado, resulting in a significant change in the economic and financial landscape of Apurimac. The analysis focuses on the economic activity of multiple banking and microfinance companies (including deposits and credits) as well as the region’s overall economic development. Additionally, the study examines the Human Development Index (HDI) of two impoverished provinces located within Las Bambas: Grau, with an HDI of 0.2425, and Cochabambas, with an HDI of 0.2193. Following the start of copper export (2010-2015), the region experienced an economic growth rate of 8.4%, surpassing the national economy’s growth rate of 5.4%. In 2016, as a result of the development of Las Bambas project, the region witnessed a remarkable 141.5% increase in its economy.
Keywords: export; economic growth; tourism; poverty; foresight.
INTRODUCTION
The problem studied in this article is the impact of the mining export and production of Las Bambas on the economic development and quality of life of the inhabitants of the Apurimac region during 2004-2016.
In terms of theoretical framework, previous research of the problem under study found in works and texts is highlighted.
For example, Lustig et al. (2001) state that there is an imbalance in the distribution of all income due to the encounter of economic growth and management activities. The rationale for this content is seen in the heterogeneous nature of wealth creation.
On the other hand, the hypotheses of the present article are presented, which, together with the theoretical framework, guide the development of the subject. Likewise, the independent and dependent variables are determined to indicate the cause-effect relationships between them. Finally, the consistency matrix is presented.
The structure of the study is based on the work of Hernández et al. (2014), who present the quantitative and qualitative methods, their differences, and characteristics. They also explain the information required to test a hypothesis, the limitations of a study and the sources of information needed in a theoretical framework.
The nature of economic stakes should be positively clarified throughout the life cycle of the project and mining operation, as this allows local governments to plan medium and long-term development policies. It also allows local people to make more sensible use of the changing economic revenues that mining brings.
Three economic contributions are commonly mentioned in mining: fiscal resources (mining canon and royalties), investment made or committed, and direct employment. Local people and governments pay more attention to the last two. The population acquires knowledge about employment and fiscal resources through the process and execution of mining operations at Las Bambas.
This study is developed following inductive and deductive research methodology taking into account the basis of the theoretical aspects, their respective hypotheses, and discussion of results.
General Objective
Evaluate the impact of Las Bambas and production on the economic development of Apurimac throughout 2004-2016.
Specific Objectives
O1: Evaluate the impact of economic growth on the level of poverty in Apurimac throughout 2004-2016.
O2: Evaluate the effect of traditional and non-traditional exports on economic growth in Apurimac throughout 2004-2016.
O3: Identify in what sense multiple banking and microfinance have impacted the economic development of Apurimac throughout 2004-2016.
General Hypothesis
Las Bambas and regional exports have had a favorable impact on the economic development and the quality of life of the inhabitants of Apurimac throughout 2004-2016.
Specific Hypotheses
H1: Traditional and non-traditional exports have favorably impacted economic growth in Apurimac throughout 2004-2016.
H2: Economic growth has had a positive impact on the reduction of poverty in Apurimac throughout 2004-2016.
H3: Multiple banking and microfinance have favorably impacted economic development in Apurimac throughout 2004-2016.
Justification
At the theoretical level, this study reviews theoretical aspect related to mining exports, economic growth and international trade of countries and regions.
Cornejo (1996) approaches international and world trade in the global and competitive context in an integral and updated way This information makes it possible to know variables that concern facts about Apurimac throughout 2004-2016.
Background
This study deals with the exploration of theoretical concepts and the review of research literature, that is, the exploration of studies in the mining sector, production, economic growth and poverty.
Aguilar (2013) mentions that the Peruvian economy had an annual 6% increase throughout 2001-2008 and that there was an expansion of the financial sector.
Alarco et al. (1990), as researchers, state the need for diversification of production in Peru through challenges, alternatives to transitional changes, alternatives to eccentricity and proposals for future developments.
Indeed, the percentage of GDP corresponding to the private sector in 2008 increased from 20% to 26%. In contrast, total deposits in the financial system increased from 24% to 26%.
The growth of financial activity is not only the result of the increase in banking, as prescribed by the Superintendecia de Banca, Seguros y AFP [Banking, Insurance and Investments Regulator] (SBS). Furthermore, in order to evaluate the prosperity and expansion of microfinance, data is required from users and/or companies.
Rodríguez (2013) indicates that the role of the banking system was studied based on the theory regarding credit rationality of the New Keynesian school to identify the factors that can cause credit market fragmentation. On the other hand, the new Keynesian literature focuses on analyzing the presence of asymmetric and incomplete information that produces low capital generation, which leads to an inefficient distribution of financial resources and in turn results in theoretical scenarios of clandestine markets in the region.
Pardo and Meller (2002) identify exports as the transcendental source for the growth of the Chilean economy.
Piketty (2015) points out that international capital operations are confronted with various theories, of which the credit market theory stands out. He says that, if the credit market were to work, that is, if one had to invest every time an investment was profitable, initial inequalities in the distribution of capital would eventually diminish. Without imposing any initial family or home country wealth, all labor units would also be committed to being able to invest the same thanks to the credit market. Therefore, this initial capital inequality is unlikely to last.
If credit markets were perfect, a poor person or a heavily indebted country would not have to repay his loan, and his savings would not reach the level of the creditor’s capital immediately.
The traditional model of growth and capital accumulation is mainly predicted by the convergence of rich and poor. Convergence models lead to particularly striking predictions about levels of international inequality, which in theory is the case, while investment capacity does not change systematically between countries.
Problematic Situation
García and Céspedes (2011) show that in a country or region there is no good definition of the relationship between finance and growth. This is because several studies indicate that the variable or independent causes of economic growth are financial. However, other studies indicate that the behavior of finance is determined by economic growth. Hence, the causal relationship between a country’s economic growth variables and the financial system is not clearly defined.
Exports play a leading role in a country’s economic development, and several studies have been carried out in this regard. According to the prediction of one of these studies, higher levels of exports can produce an increase in productivity factors through market expansion.
The importance of exports is confirmed in their performance, in economic growth, and is spread to other parts of the national economy. Thus, economic research has identified exports as an indicator of a clear variable of the economy.
On the other hand, several studies have shown that exports play an important role in the economy; however, the following questions remain: How is this importance reflected in each region of the country? What is the result in terms of economic development, taking into account that a region is more or less oriented towards international markets?
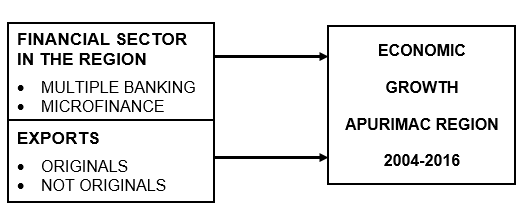
The position of the mining sector in the 2004-2016 period is explained in the economic development by its significant performance, as well as its volume in the financial part and in its exports (Figure 1).
Extractivism, Mining and Economic Growth
The State’s subsidiary role is not the problem in production activities but its lack of capacity to manage different resources generated by the extraction quotations. Large mining companies operating in foreign countries have fully calculated their production in the global market considering economic globalization. The policy of attracting foreign capital is not the cause of the dominance of multinational private capital in mining exploitation in Peru: the problem is the lack of leadership and the lack of knowledge and willingness to have a medium and long-term plan.
In 2014, the Peruvian economy was affected since the average annual rate of increase was 3.1%. This implies questioning the validity of those extraction models that consider the foreign investment line as essential. However, it is essential to maintain this model while waiting for the Chinese economy to grow in two-digit rates. On the other hand, the extraction model requires the analysis of the exploitation state in Peru considering a long-term vision. For this reason, some mining deposits come to a standstill when faced with social opposition from rural residents near the extraction sites.
There are important growth areas from the promotion of effective projects with local and regional impacts, such as:
Sustainable tourism
Sustainable harvesting
Family states
Cultivation and agricultural exploitation
Livestock and agricultural societies and cooperatives
Fair trade
Yip (1993) states that a globalization strategy that systematically accounts for industry conditions and allows for integration and governance is needed to achieve commercial efficiency and competitive advantage. This analysis should evaluate the benefits and costs of this globalization, understanding the different ways in which globalization strategies can be applied.
Money-Related Activities and the Increase in the Value of Currency in the Industry.
The relationship between the momentum of a country’s financial system and the country’s economic growth has been studied from various approaches, with the first theoretical analyses being carried out in the context of neoclassical economic growth models.
In these analyses, it is necessary to include issues such as economic growth and financial activity. Also, current variables that have an effect on facilities, access to financial services and market competition are incorporated.
These surveys showed that, in most cases, the growth of the financial system in the countries has a positive impact on the growth of the economy because the development of finance (instruments, institutions and markets) compensates for information, asymmetries and transaction costs by modifying the structure of incentives and the limitations faced by economic agents.
Figure 2, on financial development, shows the link between economic growth and the development of the financial system, that is to say, the link between the development of economic sectors (instruments, institutions and businesses) and the financial sector.
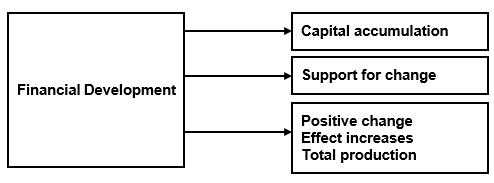
Figure 2 shows, in general terms, five functions of financial systems:
Provide information on investment projects and enable efficient capital allocation.
Enable the monitoring of investments and post-operation corporate governance.
Facilitate diversification and risk management.
Add and mobilize savings sources.
Help to vary goods and services.
The research notes that various studies have concluded that a country’s resources and its level of deployment within the fiscal sector have a positive correlation. In this sense, there is a need for a system that allows promoting the continuous development of companies. There is also a direct impact on the health of households by providing them with financial services that allow them to stabilize consumption and access durable goods (kitchen, cars, etc.), which improves their standard of living.
Finally, it has been confirmed that the financial system is necessary for economic development, but it is not sufficient.
In general, the financial market can overcome the existing friction caused by lack of information and asymmetric transaction costs. Each function is reflected in savings and investment decisions, including the distribution of resources over time, which affects economic growth. Thus, these functions form the mechanism by which the financial system (and its evolution) affects the real economy.
METHODOLOGY
The method used in the article is causal and explains the development factors of regional and national variables related to the export sector in the region and to economic growth and poverty throughout 2004-2016. Also, the conclusions and recommendations suggest boosting the development of regional financial institutions, banking finance and exports to achieve economic growth in Apurimac. It also proposes to analyze poverty reduction.
This study has a foresight approach, as it makes use of a historical series of information corresponding to the period 2004-2016, which allows expanding the theoretical framework and conjectures that facilitate the analysis of the effect of financial and export activities in Apurimac on economic growth and its poverty level. Therefore, the inductive and deductive method was used.
Study Population
The study population is the population of Apurimac, where the goal is to identify the assistance provided to people living in poverty through certain indicators, the most important of which is the creation of a regional road network.
Procedure for the Collection of Systematically Ordered Resources
The information collected in this study was mainly obtained from Apurimac. Consistency was sought first, since the different secondary sources of information, both national and international, did not yield data of the same quality. In terms of quantity, the same variable refers to a different concept. Then information collected was processed, where consistency allowed to elaborate different statistics and figures about the historical evolution of each of the variables in order to carry out a descriptive analysis of each one of them. This descriptive analysis was oriented to facilitate the verification of the hypothesis.
Analysis and Interpretation of the Information
For the development of this study, which focused on Apurimac, consistency was first achieved because different sources of secondary information, both national and international, did not provide data of the same quality.
RESULTS
Apurimac is one of the 24 regions, along with the constitutional province of Callao, that make up the Republic of Peru. It is located on the eastern slope of the Andes, descending several rivers through deep valleys from south to north. Its source originates in the western mountains; Cusco serves as a boundary with the Apurimac River and the Pampa borders Apurimac with Ayacucho.
Figure 3 shows the population of Apurimac.
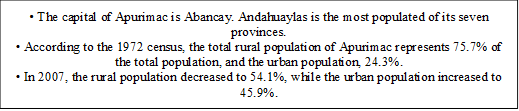
Population
In this diagnosis, the UNDP’s Peruvian Human Development Report 2009 is considered. Apurimac is located in the southern highlands of the country, covering an area of 20 895.75 km2, occupying 1.6% of the country’s region, and is up to 2378 meters above sea level.
The territory corresponds entirely to the highlands region and includes seven provinces, 80 districts, 3552 population centers (of which 3424 are rural), 95 towns directly dependent on the central government with population centers of 467 accredited community farmers and 410 titled agricultural communities.
According to Table 1 of the 2007 census, the population of Apurimac was 404 190 inhabitants, which represented 1.5% of the country’s population and ranked 19th in terms of population.
Table 1 Total Population per Province Classified by Urban and Rural Population of Apurimac, 2007.
| National | Population | ||
|---|---|---|---|
| Department/Provinces | Total | Urban | Rural |
| Peru | 27 412 157 | 20 810 289 | 6 601 868 |
| Apurimac | 404 190 | 185 672 | 218 518 |
| Abancay | 96 064 | 60 811 | 35 253 |
| Andahuaylas | 143 934 | 64 793 | 79 141 |
| Antabamba | 12 267 | 8617 | 3650 |
| Aymaraes | 29 569 | 12 765 | 16 804 |
| Cotabambas | 45 771 | 12 206 | 33 565 |
| Chincheros | 51 583 | 16 593 | 34 990 |
| Grau | 25 090 | 9981 | 15 109 |
Source: Gobierno regional de Apurímac, 2014.
Between 1993 and 2007, the national annual growth rate was 1.5%. Apurimac occupied the last position with an average of 0.4%. The concentration of personnel was 19.3 people per square kilometer, making it the 13th most densely populated province. Also, 45.9% of the population was urban and 100% of the population lived in the natural area of the highlands. The INEI estimated a population projection of 446 813 inhabitants for 2010 and 458 830 inhabitants for 2015.
Poverty
Apurimac is one of the departments that presents a critical situation regarding its poverty indicators, with a poverty rate of 70.3%, which is above the national average of 34.8%. Likewise, Apurimac is the second department in the country with the highest percentage of its population living in extreme poverty (40.3%).
In the last seven years, extreme poverty has increased by 1.0%, while in the last ten years it has decreased by 2.5%. Extreme poverty mostly affected the population in rural areas (13.7%) compared to urban areas (2.9%).
Education
Regarding education, the percentage of primary school dropouts in Apurimac ranges from 3.6% in Abancay to 10.0% in Chincheros. In terms of school backwardness in primary school, all districts are below 20%, although in five provinces, the percentage of students with backwardness is higher than 20%, as is the case of Antabamba (26%).
According to the report issued in 2016 by INEI, education has presented progress in the last 11 years, although still at an insufficient level. Thus, the average years of study of the population in Apurimac increased by 8.1% in the 2008-2016 period, which is still below the national average of 10%. With respect to the level of education attained, the percentage of people over 25 years of age who only completed primary school decreased from 39.1% to 36%. On the other hand, the percentage of people who completed high school increased from 27.7% to 33.7%. At national level, the average rate was 25.6% for primary and 38.7% for high school.
Health
The decentralization of health in the country is progressing slowly, as demonstrated by the case of Apurimac. Although the region has decentralized more than 60%, this progress has been possible due to the great impetus given by the Ministry of Health (MINSA) to the roadmap for the decentralization of the sector and the plan for the transfer of competencies to the regions throughout 2006-2016 period.
Basic Services
In urban areas, drinking water and sewerage coverage by the 50 sanitation service providers (EPS), which are in charge of the country’s provincial municipalities, has increased from 81.20% in 2004 to 92.2% in 2010. This occurred within the framework to prioritize investments in the water sector.
Table 2 shows the difference, where Cotabambas (98.6%) and Chincheros (94.5%) do not have drainage services. Likewise, Cotabambas is the province with the highest population (68.0%) without access to electricity service, which represents 43.4% of the population of Apurimac.
Table 2 Apurimac: Figures and Statistical Data on Basic Services.
| ASPECT | DATA |
|---|---|
| Households with electrical energy for domestic lighting | 56.60% |
| Households with sanitary water service in the public network | 54.1% (indoor network, network inside the building and utility pole) |
| Households with drainage service connected to the public network | 26.8% (interior drainage and drainage inside the building) |
| Main building materials (exterior wall and exterior walls) | Adobe or tapia in 87.5% of households |
Source: BCR, 2012.
Composition of the rural and urban population 2007 in Apurimac
Table 3 shows that Apurimac is the province with the highest population (69.9%), followed by Abancay (63.3%). At the same time, the provinces with the lowest percentage of rural population are Chincheros (32.2%) and Cotabambas (26.6%) despite the fact that Las Bambas is located in those areas.
Table 3. Urban and Rural Population of Apurimac in 2007.
| Urban | Rural | Total | % Urban | % Rural | Total | |
|---|---|---|---|---|---|---|
| Antabamba | 8.60 | 3.70 | 12.30 | 69.9 | 30.1 | 100 |
| Abancay | 60.80 | 35.30 | 96.10 | 63.3 | 36.7 | 100 |
| Andahuaylas | 64.70 | 79.10 | 143.80 | 45.0 | 55.0 | 100 |
| Aymaraes | 12.80 | 16.80 | 29.60 | 43.2 | 56.8 | 100 |
| Grau | 10.00 | 15.10 | 25.10 | 39.8 | 60.2 | 100 |
| Chincheros | 16.60 | 35.00 | 51.60 | 32.2 | 67.8 | 100 |
| Cotabambas | 12.20 | 36.60 | 48.80 | 25.0 | 75.0 | 100 |
| 185.7 | 221.6 | 407.3 | 45.6 | 54.4 | 100 |
Source: Comisión de estudios económicos de la región Apurímac, 2007.
Apurimac’s National GDP
Table 4 shows that Apurimac’s GDP between 2007 and 2015 was only about 0.5% of the national GDP. However, this share increased in 2016 as Las Bambas grew on a large scale between the provinces of Cotabambas and Grau and increased to 1.3% of the country’s GDP annually.
On the other hand, from 2007 to 2015, several years before the massive Las Bambas mining project came into operation, Apurimac’s economy grew on average 4.9% per year, which was below the national economy. The economy grew by an average of 5.3%, but the operation of Las Bambas helped the region grow by 141.5% in 2016. This means that from 2007 to 2016 the region grew by an average of 20.1% annually while the national average growth in the same period was only 5.2%.
Table 4 National and Apurimac Regional GDP in 2007.
| Million soles 2007 | B/A in % | Growth Rate (%) | |||
|---|---|---|---|---|---|
| PBI | National | Apurimac | |||
| National (A) | Apurimac (B) | ||||
| 2007 | 319693 | 1824.2 | 0.6 | ||
| 2008 | 348923 | 1688.6 | 0.5 | 9.1 | -7.4 |
| 2009 | 352584 | 1623.7 | 0.5 | 1.0 | -3.8 |
| 2010 | 392380 | 1765.7 | 0.4 | 1.3 | 8.7 |
| 2011 | 407052 | 1869.4 | 0.5 | 3.7 | 5.9 |
| 2012 | 431273 | 2110.9 | 0.5 | 6.0 | 12.9 |
| 2013 | 456366 | 2342.7 | 0.5 | 5.8 | 11.0 |
| 2014 | 467280 | 2437.4 | 0.5 | 2.4 | 4.0 |
| 2015 | 482797 | 2629.6 | 0.5 | 3.3 | 7.9 |
| 2016 | 501699 | 6349.5 | 1.3 | 3.9 | 141.5 |
| Period | |||||
| 2007-2015 | 5.3 | 4.9 | |||
| Period | |||||
| 2007-2016 | 5.2 | 20.1 | |||
Source: BCR, 2017.
High Business Development in Apurimac
Table 5 presents a review of businesses in Apurimac for the 2004-2016 period. It should be noted that within the 2015-2016 period, the total volume of exports in this region was very low and consisted mainly of the mining sector, especially copper production, which ranged from US$7.7 million to US$12.1 million (C$9 million). Gold and silver are other metals that are also exported; the region also has significant zinc export potential. Other traditional and non-traditional exports are practically non-existent.
Regarding the export development, Renart (2007) argues that the development of export policies for distribution mobilizes resources that companies may not be able to afford. Likewise, not all have the necessary resources to differentiate themselves or operate effectively in external markets, which are sought through synergies or cooperation. The theory of profit sharing between countries is also applicable to companies.
Argandoña (2021) states that the social responsibility of private property must be well organized, regulated and within established laws. An example is the regulation of mines for mining.
Krugman and Obstfeld (2012) propose two variables:
Commercial variable, comprises the trade of the product, its exploitation, its form and procedure.
Financial variable, since it serves to visualize and analyze the finances, growth, exploitation of the product (in this case copper) and the effects it leaves for the sector, city or country.
Table 5 Exports from Apurimac Region.
| 2004 | 2005 | 2006 | 2007 | 2008 | 2009 | 2010 | 2011 | 2012 | 2013 | 2014 | 2015 | 2016 | |
|---|---|---|---|---|---|---|---|---|---|---|---|---|---|
| Traditional | 0.0 | 0.0 | 105.5 | 8.0 | 59.1 | 115.8 | 121.9 | 23.2 | 86.1 | 46.4 | 32.2 | 70.0 | 1546.0 |
| .agriculture | 0.0 | 0.0 | 0.0 | 0.0 | 0.0 | 0.0 | 0.0 | 0.0 | 0.0 | 0.8 | 0.2 | 1.4 | 2.4 |
| .mining | 0.0 | 0.0 | 105.5 | 7.7 | 59.1 | 115.8 | 121.9 | 23.2 | 86.1 | 45.6 | 32.0 | 68.6 | 1543.6 |
| .fishing | 0.0 | 0.0 | 0.0 | 0.3 | 0.0 | 0.0 | 0.0 | 0.0 | 0.0 | 0.0 | 0.0 | 0.0 | 0.0 |
| No tradicionales | 0.0 | 0.0 | 0.3 | 0.1 | 0.3 | 1.7 | 0.2 | 0.0 | 0.0 | 1.1 | 1.5 | 0.2 | 0.3 |
| .agriculture | 0.0 | 0.0 | 0.3 | 0.1 | 0.2 | 1.7 | 0.1 | 0.0 | 0.0 | 1.1 | 1.1 | 0.2 | 0.1 |
| .textile | |||||||||||||
| .metal-works | |||||||||||||
| Exports Total | 0.0 | 0.0 | 105.8 | 8.1 | 59.4 | 117.5 | 122.1 | 23.2 | 86.1 | 47.5 | 33.7 | 70.2 | 1546.3 |
Source: BCR, 2017.
Human Development Index of Peru and Apurimac
Table 6 shows that the national human development index (HDI) was almost three times higher than Apurimac’s index in 2003. However, this difference was reduced in 2012, the year in which the HDI of the country was slightly higher than that of Apurimac, as the latter continued to rise. Between 2003 and 2012, the average HDI of Apurimac was 4.4%, much higher than the growth of the national HDI (0.7%) in the same period.
Table 6 Peru’s HDI.
| HDI | HDI Ratio | ||
|---|---|---|---|
| Peru | Apurimac | Peru/Apurimac | |
| 2003 | 0.685 | 0.2330 | 2.9 |
| 2007 | 0.700 | 0.2860 | 2.4 |
| 2010 | 0.721 | 0.3356 | 2.1 |
| 2011 | 0.725 | 0.3184 | 2.3 |
| 2012 | 0.731 | 0.3444 | 2.1 |
| Average annual growth rate | 0.7 | 4.4 |
Source: Comisión de estudios económicos de la región Apurímac, 2014.
Facts about Las Bambas that comprise the community
Las Bambas produces approximately 2% of the world’s copper. It is currently in a critical situation due to protests by surrounding neighbors, who have blocked the road for almost two years.
The mine has been in conflict since 2014 (when the Swiss company GLENCORE sold it to China’s MMG) and has claimed the lives of five farmers in 2015 and 2016. According to Gestión (2019), the reasons for the protests are as follows:
A section oriented to the national route
A road used as a national highway motivated the villagers’ complaint, as it crosses farming communities, which are affected by the passage of around 250 heavy trucks transporting materials every day.
A mining pipeline that was never built
Farmers did not expect the heavy traffic of trucks loaded with copper, since the original project, conceived by GLENCORE, foresaw the construction of a pipeline to transport ore to another neighboring sector in the department of Cusco: the district of Espinar. This would also receive copper from another mine owned by GLENCORE. Ferrobambas miners and their representatives were detained in Lima. The main complaint of their representatives was about the land mines, since trucks would be allowed to enter these mines in exchange for money (US$30,000).
A relocated and compensated community
A final protest was led by the Ferrobamba community, which had to relocate from the open-pit mines to a metropolis set up for the population in another sector. Money and land were part of the compensation and new lands.
Controversial extortion arrests
The expenses for controversies and deprivations for damages amounted to approximately US$30 million.
Million-dollar banking
The production of Las Bambas was 452 000 tons of copper in 1997, which represented 2% of the 20 million tons produced internationally. Likewise, of the 2.4 million tons produced nationally (Peru), Las Bambas production represented 18.8%. In addition, Chile was the largest copper producer at the international level. The mine had 1800 workers and 8000 indirect workers.
Table 7 shows the HDI for each province in the department of Apurimac throughout 2003-2012. It is worth noting that Apurimac is the city with the highest HDI and that the HDI of its province Abancay (0.4476) exceeded the HDI of the department of Apurimac itself (0.4444) in 2012.
Regarding the growth rate, it can be said that annual growth rate of the quality of life in Abancay and Chincheros exceeded 2% between 2003 and 2012. The population is around 0.5%.
Table 7 HDI of Apurimac’s Provinces.
| 2003 | 2007 | 2010 | 2011 | 2012 | HDI Rates 2003-2012 (%) | ||||||
|---|---|---|---|---|---|---|---|---|---|---|---|
| Population Growth | HDI | Population Growth | HDI | Population Growth | HDI | Population Growth | HDI | Population Growth | HDI | ||
| Apurimac | 470.7 | 0.2330 | 404.2 | 0.2860 | 446.8 | 0.3356 | 449.4 | 0.3184 | 451.9 | 0.3444 | 4.4 |
| Abancay | 125.6 | 0.2901 | 96.1 | 0.3538 | 105.2 | 0.4263 | 105.5 | 0.4289 | 105.7 | 0.4476 | 4.9 |
| Andahuaylas | 155.8 | 0.2340 | 143.8 | 0.2672 | 160.6 | 0.3233 | 162.1 | 0.3197 | 163.7 | 0.3374 | 4.2 |
| Aymaraes | 31.7 | 0.2236 | 29.6 | 0.2462 | 32.5 | 0.2867 | 32.6 | 0.2765 | 32.7 | 0.2838 | 2.7 |
| Chincheros | 60.5 | 0.2137 | 51.6 | 0.2270 | 57.1 | 0.2696 | 57.4 | 0.2579 | 57.8 | 0.2681 | 2.6 |
| Antabamba | 14.0 | 0.2313 | 12.3 | 0.2210 | 13.4 | 0.2599 | 13.4 | 0.2420 | 13.4 | 0.2426 | 0.5 |
| Grau | 29.4 | 0.2230 | 25.1 | 0.2235 | 27.1 | 0.2506 | 27.1 | 0.2393 | 27.0 | 0.2425 | 0.9 |
| Cotabambas | 53.8 | 0.1915 | 45.8 | 0.1951 | 50.9 | 0.2200 | 51.3 | 0.2146 | 51.7 | 0.2193 | 1.5 |
Source: Comisión de estudios económicos de la región Apurímac, 2014.
On the positive side, the HDI of Andahuaylas (0.3374) is similar to the average for the Apurimac area (0.3444). Apurimac has a total of 7 provinces, of which Abancay and Andahuaylas represent 59.6% of the total population. In addition, throughout 2003-2012, the province of Abancay had an HDI of 4.9%, and the province of Andahuaylas saw it grow by 4.2%.
Only two provinces have an HDI that indicates low poverty in Grau province (0.2425) and Cotabambas province (0.2193): both places are located in Las Bambas. Note that the HDI in Abancay province has almost doubled compared to the HDI in Grau and Cotabambas provinces. As there is no HDI record for the 2013-2016 period, the impact of the presence of megaprojects cannot be assessed in either province, nor can its extent or effects.
During this period, the administration and production of goods in Apurimac was covered by large projects such as Las Bambas (2010-2016). As a result, between the years 2010 and 2015, the administration of goods coming from the department of Apurimac increased on average by 8.4% and the national economy by 5.4%. Similarly, in 2016, the year the megaproject began, the Arequipa economy increased by 141.5%, while the Peruvian economy did so at a level of 3.9%.
DISCUSSION
Credit to the financial system in Apurimac grew by an average of 27.1% in the 2004-2016 period, multiplying by almost 17 times in 2012. Thus, it went from S/ 48.1 million in 2004 to S/ 811 million in 2016. The average annual growth rate in the 2004-2013 period was 32.1%, but in the last three years (2014-2016) it decreased to 12.4%.
Multiple banking continued to represent only 6.2% of total non-public credit in the department of Apurimac in 2004 to then represent 23.8% in 2016. This credit has fluctuated many times, more than 64, in a period of 12 years, where it had an average growth per year of 45%. The growth of these credits has gone through three phases, of which, the first is five years, where it was born in the middle of the crisis with medium strength as the average growth in the year was 82.1%. The second phase, of six years, occurred during the 2009-2014 period, where growth was at a lower rate of 23.6%.
Investments represented 93.8% of the credits of the financial system in Apurimac in 2004 and then went on to represent 67% in 2006 and 2015. The total export of Apurimac is very small and is established exclusively by export, mainly mining which fluctuate in approximately US$7.7 million and US$122.9 million. Other mining sectors export gold and silver. The area also has great potential for zinc exports to different global sectors.
The HDI of Apurimac is three times higher than in 2003. Its growth slowed in 2012, when the country’s HDI more than doubled that of Apurimac. This is because the growth rate in the period 2003-2012 the HDI of Apurimac was increasing by up to 4.4% per year, that is, at a much higher rate than the HDI of the country in the same period (0.7%).
Las Bambas is a predominantly bronze project located in Cotabambas and Grau provinces, also with a presence in the Challhuahuacho district. The management was to take advantage of low opening extraction as a conventional mill producing copper concentrates and others, such as gold and silver.
Las Bambas includes several mines: Ferrobamba, Chalcobamba and Sulfobamba, of which the Ferrobamba mine is being exploited and covering 10% of the franchise. The group includes MMG, a subsidiary of MINMETALS CORP China (62.5%), as manager. Maintenance is fully managed by GUOXIN INTERNATIONAL Investment CO. Ltd (22.5%) in addition to CTIC METAL CO where it was limited to 15% of the main shareholder: CHINA MINMETALS CORPORATION, which is listed on the Hong Kong Stock Exchange.
The development and analysis of the financial sector in Apurimac includes a direct relationship between the international competitiveness of a country and the level of development of its financial system. In this sense, a full channel savings system for more efficient activities is essential to promote sustainable business growth. In addition, access to financial services has a direct impact on people’s health forever consistent with time, allowing them to access durable goods (houses, furniture, refrigerators, kitchen, automotive, etc.) and improving the quality of services.
Finally, deep finance in Peru and Apurimac corresponds to the period 2007-2016. The amount of money in business in Apurimac has progressed throughout 2007-2011, as it went from 5.9% of GDP in 2007 to 18.4% of GDP in 2011. However, in the years 2012-2015, dynamism was lost for four years, as GDP increased from 18.4% to only 21.4%. Finally, in 2016, the depth of money movement in the department of Apurimac reached a GDP of 9.6% due to the sharp increase in GDP as copper exports from Las Bambas began.
CONCLUSIONS
Throughout 2015-2016, the total foreign sales of Apurimac, including copper sales, were negative, as they ranged between S/ 7.7 million and S/ 121.9 million.
The HDI of the country is more than double that of Apurimac. In fact, between 2003-2012, the HDI in Apurimac grew favorably and managed to reach an average term per year of 4.4%.
Loans of all financial banking in the department of Apurimac increased in the years 2004 and 2016 to an average term per year of 27.1%. This increase in 12 years increased by 17 times and reached S/ 48.1 million in 2004 and S/ 811 million in 2016.
Multiple banks accounted for 6.2% of total lending to the Peruvian region by Apurimac in 2004 and reached 23.8% in 2016.
The range of loans from microfinance companies went from 93.8% of total loans in Apurimac in 2004 to 67%. The same happened in 2016.
RECOMMENDATIONS
Optimize the road or systematic space in Apurimac, in the poorest sector and in the massive Las Bambas mining project to promote the formation of public business, in order to construct roads through public-private partnerships that, as an effect, will increase the industry production, which will create more employment and, as an effect and with the purpose of growing economic activity in Apurimac, will contribute to regional economic growth.
Support the construction of the Abancay-Puerto Matarani railroad to facilitate not only the transportation of minerals from the different mining projects in the area, but also to strengthen international and national tourism, as well as trade in general.
Support the construction of the cable car from the Huanipaca sector, pertaining to the province of Abanquino and is also within the Choquequirao archaeological complex, in order to strengthen tourism in Apurimac.
Support the business of shipping non-traditional products from Apurimac, such as coffee.
Under the supervision of the Banco de la Nación, strengthen the banking system in the department of Apurimac, especially in poor sectors such as Cotabambas, Antabamba and Grau, which are provinces of Apurimac.
ACKNOWLEDGMENT
This research was carried out with great dedication, for which I thank Ms. Sully Ruth Ortiz Amado for making this study possible.
REFERENCES
Aguilar Andía, G. (2013). Microfinanzas y crecimiento regional en el Perú. Economía, 23(72), 143-173. [ Links ]
Alarco Tosoni, G., Del Hierro, P., y Salas, C. (1990). Economía peruana: 1985-1990: Enseñanzas de la expansión y del colapso. Lima, Perú: Fundación Friedrich Ebert. [ Links ]
Argandoña Ramiz, A. (2021). La responsabilidad social de la propiedad. Empresa y Humanismo, 24(1), Pp. 7-26. https://doi.org/10.15581/015.XXIV.1.7-26 [ Links ]
Cornejo Ramírez, E. (1996). Comercio internacional. Hacia una gestión competitiva. Lima, Perú: San Marcos. [ Links ]
García Carpio, J. M., y Céspedes Reynaga, N. (2011). Pobreza y crecimiento económico: tendencias durante la década del 2000. Banco Central de Reserva del Perú. [ Links ]
Gestión. (28 de marzo de 2019). Las Bambas: Cinco hechos para comprender el conflicto de las comunidades. https://gestion.pe/peru/bambas-5-hechos-entender-brevemente-conflicto-zona-nndc-262703-noticia/ [ Links ]
Hernández Sampieri, R., Fernández Collado, C., y Baptista Lucio, P. (2014). Metodología de la investigación (6ª ed.). México D. F., México: McGRAW-HILL INTERAMERICANO. [ Links ]
Krugman, P. R., y Obstfeld, M. (2012). Economía Internacional (9ª ed.). Madrid, España: Pearson Educación S. A. [ Links ]
Lustig, N., Arias, O., y Rigolini, J. (28-29 de agosto de 2001). Reducción de la pobreza y crecimiento económico: la doble causalidad. Seminario: La teoría del desarrollo en los albores del Siglo XXI, Santiago de Chile, Chile. [ Links ]
Pardo, A., y Meller, P. (2002). El Rol de las Exportaciones en el Crecimiento Económico Regional. (Extracto de tesis de maestría). Universidad de Chile, Santiago de Chile. [ Links ]
Piketty, T. (2015). La economía de las desigualdades. ¿Cómo implementar una redistribución justa y eficaz de la riqueza? Buenos Aires, Argentina: Siglo XXI Editores. [ Links ]
Renart, L. G. (2007). Consorcios de Exportación Enfocados; el Diseño y Puesta en Práctica. (Documento de Investigación). Universidad de Navarra, Barcelona. [ Links ]
Rodríguez Fuentes, C. J. (2013). La banca y el crecimiento económico regional. Una panorámica de la literatura. Ekonomiaz: Revista vasca de economía, (84), 38-65. [ Links ]
Yip, G. S. (1993). Globalización: Estrategias para obtener una ventaja competitiva internacional. Bogotá, Colombia: Norma. [ Links ]
Received: February 26, 2021; Accepted: March 10, 2023
 Este es un artículo publicado en acceso abierto bajo una licencia Creative Commons
