


Servicios Personalizados
Revista

Articulo
 texto en
  Inglés (pdf)
 Articulo en XML
 Referencias del artículo
 Enviar articulo por email
Indicadores
-
 Citado por SciELO
Links relacionados
-
 Similares en
SciELO
Similares en
SciELO
Compartir

 Permalink
Industrial Data
versión impresa ISSN 1560-9146versión On-line ISSN 1810-9993
Ind. data vol.26 no.1 Lima ene./jun. 2023
http://dx.doi.org/10.15381/idata.v26i1.24313
Production and Management
Implementation of Retail Business Strategies and Their Relationship with Consumption Patterns in Department Stores in a COVID-19 Context

1Industrial engineer from Universidad Nacional de Trujillo (Trujillo, Peru). Currently working as an independent consultant (Trujillo, Peru). E-mail: jobandom@unitru.edu.pe
2Industrial engineer from Universidad Nacional Mayor de San Marcos (Lima, Peru). Currently teaching at the Department of Production and Management of the School of Industrial Engineering of the UNMSM (Lima, Peru). E-mail: manuel.godoy@unmsm.edu.pe
3Industrial engineer from Universidad Nacional de Trujillo. Currently teaching at the Escuela de Ingeniería Industrial of the School of Engineering of the UNT (Trujillo, Peru). E-mail: jgonzalezv@unitru.edu.pe
The objective of this study is to determine how retail business strategies are related to consumption patterns in department stores in a COVID-19 context. The methodology employed has a descriptive and correlational approach at a cross-sectional level. The data collection technique was a survey addressed to a sample of 384 consumers. The most significant result is the moderate and strong correlation coefficient of .702 for the variables with a p= .000 < .05. The results obtained show that retail business strategies are closely related to consumption patterns, which means that shopping habits can be created in customers.
Keywords: retail business strategies; e-commerce; consumption patterns; COVID-19
INTRODUCTION
Concern about COVID-19 and its effects is generating important changes in consumer preferences, expectations, and habits. Along these lines, Alfaro (2020) states that consumption patterns that make possible an understanding of evolution within the retail sector are defined based on global trends, the most significant being:
The transformation of digital channels. The isolation of the population to mitigate the spread of the pandemic has further accelerated the use of digital platforms, as retail customers have made more purchases, contracted more services and interacted digitally at an unprecedented level, which represents a trend that is here to stay.
Supply chain flexibility. The resilience and adaptability of large companies’ supply chains have been tested during the pandemic to ensure the continuity of their services and strengthen relationships with their consumers.
Trust during uncertain times. Confidence to make digital purchases will be achieved by demonstrating transparency in the sales process through ease of payment, variety in communication channels with customers, and the guarantee that products arrive to their destination undamaged.
Thus, it is observed that global trends can strengthen the development of business strategies in retail and its digital transformation plans. Given this, this study defines business strategies related to the global trends proposed by Alfaro (2020).
Regarding trend 1, Ma et al. (2016) mention that online stores (strategy 1) allow boosting digital channels, as consumers can shop from the comfort of their homes. On the other hand, Darma and Noviana (2020) point out that digital payment methods (strategy 2) allow incorporating more secure, agile, and sustainable payment methods.
With respect to trend 2, Tang and Veelenturf (2019) argue that the purchase dispatch service (strategy 3) allows for improved product distribution and mitigates the costs associated with transportation.
In this line, trend 3 alludes to online shopping and customer service. For Savastano et al. (2019), online shopping (strategy 4) makes it possible to ensure that each purchase has a privacy policy to avoid transaction fraud, information theft and identity theft. On the other hand, Lee and Lee (2020) argue that customer service (strategy 5) allows for effective communication with consumers. Customer service also implies that the purchase package is sealed and that all contents are inside the package, undamaged and in working order.
The Likert scale was used to measure consumption patterns since the main objective of the research is to measure the frequency of actions and the occurrence of events. According to Joshi et al. (2015), this quantitative data collection instrument makes it possible to obtain information concerning a population’s opinions, assessments, and attitudes about a topic. Therefore, based on global trends, retail business strategies will manage to influence consumption patterns, which will be measured through five indicators.
Regarding strategy 1, Azuela et al. (2019) mention the frequency of online store purchases (pattern 1), which is the number of times a customer purchases a product via digital channels within a specific time period.
For strategy 2, Hashem (2020) considers the frequency of digital payment use (pattern 2) to measure how regularly a customer makes electronic transfers or uses bank cards.
Regarding strategy 3, Lim and Winkenbach (2019) refer to the frequency of demand for order fulfillment service (pattern 3). This indicator measures the number of times consumers request to receive their products in the comfort of their home.
In this line, for strategy 4, Sethuraman et al. (2022) mention the degree of trust in online shopping (pattern 4), which allows determining the level of acceptance of digital transactions and the security of the information entered in the retail store platform.
In relation to strategy 5, Abdirad and Krishnan (2022) define the degree of trust in customer service (pattern 5) as that which measures the level of appreciation of a company’s service based on the shopping experience it provides, its quality products and the transparency of its brand.
This study was conducted in the most relevant retail companies in the province of Trujillo, such as Ripley, Oeschle and Saga Falabella, whose main activity is the sale of various product categories, such as electronics, clothing, footwear, computers, white goods, toys, and home decor. Therefore, this exploration is oriented to determine the influence of retail business strategies on shopping habits in department stores within that province.
The research can be considered novel because there have not yet been studies that show the impact of retail business strategies on consumption patterns in department stores in Peru. The results show that the companies under study, in a COVID-19 context, have had to adapt their online stores, horizontally integrate their supply chain, and generate a new value proposition for their consumers. These changes will remain present within the business model in a post-pandemic environment.
Finally, the methodology employed can also be applied statistically and strategically to specialty stores, supermarkets, and other stores within the retail sector. Furthermore, these results can be generalized to develop more effective business strategies to improve the consumer experience in terms of branding management and sales process.
METHODOLOGY
The research is applicative, with a descriptive-correlational level to analyze retail business strategies and their relationship with consumption patterns in department stores in Trujillo province. The information was obtained using the questionnaire as an evaluation instrument, by means of which a series of questions were asked to the selected sample, which were validated by experts. Table 1 presents the general hypothesis with the two study variables.
According to Tavakol and Dennick (2011), the validity and reliability of the Likert scale can be assessed using the Cronbach’s alpha coefficient. Acceptance criteria for the instrument would fall between 0.70 and 0.95. If the alpha value is below 0.70, it indicates a poor correlation between the variables, so it should be reviewed or potentially discarded.
Table 1 Variables per Hypothesis.
| Hypothesis | Independent Variable (IV) | Dependent Variable (DV) |
|---|---|---|
| There are retail business strategies that are highly related to consumption patterns in department stores in a COVID-19 context. |
Retail business strategies Online stores Digital payment methods Purchase dispatch service Online shopping Customer service |
Consumption patterns Frequency of online store purchases Frequency of digital payment use Frequency of demand for order fulfillment service Degree of trust in online shopping Degree of trust in customer service |
Source: Prepared by the authors.
This research has a quantitative approach and, to test the hypothesis, Spearman correlation was applied, which is a test for variables that are not normally distributed. Spearman’s rank-order correlation is shown in Table 2.
Table 2 Spearman’s Rank-Order (Rho).
| Rank | Correlation Interpretation |
|---|---|
| <0.75 - 1.00] | Strong and perfect |
| <0.50 - 0.75] | Moderate and strong |
| <0.25 - 0.50] | Weak |
| [0.00 - 0.25] | Very weak |
Source: Martínez et al. (2009).
Since the population is not precisely known, the formula for sampling from infinite populations using simple random sampling will be employed. In this formula, the probability of the event occurring is represented by p= 50%, the probability of the event not occurring is represented by q= 50%, the sampling error is represented by E = 5%, and a confidence level of 95% is represented by Z = 1.96. The resulting sample size is 384 customers.
The survey was designed based on 10 questions to analyze the impact of business strategies on shopping habits in department stores in Trujillo, as shown in Table 3. In addition, the responses to the questionnaire were classified using a Likert scale, with the ratings (1) never, (2) rarely, (3) sometimes, (4) often and (5) always.
Table 3 Survey Questionnaire (Instrument).
| 1. Retail business strategies | Q1 Are this company’s business strategies focused on the online store? Q2 Are this company’s business strategies focused on digital payment methods? Q3 Are this company’s business strategies focused on the purchase dispatch service? Q4 Are this company’s business strategies focused on online shopping? Q5 Are this company’s business strategies focused on customer service? |
| 2. Consumption patterns in department stores | Q6 How often do you shop at this company’s online store? Q7 How often do you use digital payment methods with this company? Q8 How often do you use this company’s purchase dispatch service? Q9 Do you feel confident about shopping online from this company? Q10 Do you feel confident about this company’s customer service? |
Source: Prepared by the authors.
Statistical hypotheses are used to test the normality of the data obtained. The null hypothesis (H0) states that the responses follow a normal distribution, while the alternate hypothesis (H1) states that there is no normal distribution in the data. After applying the Kolmogorov-Smirnov test, if the p values have a significance below 0.05, H0 is discarded and H1 is chosen. Therefore, the research variables do not follow a normal distribution, and the correlation must be determined by means of a non-parametric test such as Spearman’s correlation.
RESULTS
General Descriptive Results
With the survey conducted in August 2022 to a sample of 384 respondents, it is concluded that the pandemic caused a significant change in the trajectory of digital payment and retail consumers had to adapt to this new environment. The results obtained are the following:
The frequency of online store purchases went from 37.5% before the pandemic to 71.1% (question 6).
The frequency of digital payment use increased from 21.9% before the pandemic to 68% (question 7).
The frequency demand for order fulfillment service increased from 31.8% before the pandemic to 60.7% (question 8).
The degree of trust in online shopping went from 51.3% before the pandemic to 77.3% (question 9).
The degree of trust in customer service went from 84.6% before the pandemic to 87.8% (question 10).
Validity and Reliability of the Instrument
Table 4 shows that the Cronbach’s alpha coefficient of the data was 0.810, which is higher than the 0.8 taken as the minimum acceptable level, indicating that the research instrument is valid.
Table 4 Reliability Analysis.
| Mean | Variance | Cronbach’s Alpha Coefficient | |
|---|---|---|---|
| Reliability statistic | 0.810 | ||
| Question 1: | 23.6016 | 59.170 | 0.794 |
| Question 2: | 23.2057 | 51.083 | 0.789 |
| Question 3: | 23.6172 | 59.584 | 0.799 |
| Question 4: | 22.9219 | 52.751 | 0.786 |
| Question 5: | 21.5729 | 57.540 | 0.809 |
| Question 6: | 22.7292 | 53.963 | 0.781 |
| Question 7: | 21.4349 | 48.763 | 0.788 |
| Question 8: | 23.0260 | 57.441 | 0.801 |
| Question 9: | 22.1615 | 50.329 | 0.774 |
| Question 10: | 21.3620 | 56.561 | 0.802 |
Source: Reliability in SPSS version 26 based on August 2022 data.
Hypothesis Verification
The null hypothesis (H0) states that there are no retail business strategies that are strongly related to consumption patterns in department stores within a COVID-19 context. While the alternative hypothesis (H1) states that there are retail business strategies that are highly related to these consumption patterns.
The following was determined:
There is a moderate correlation of 70.20%, between retail business strategies and the degree of trust in customer service.
There is a moderate correlation of 52.10% between retail business strategies and the degree of trust in online shopping.
There is a weak correlation of 40.60% between retail business strategies and the frequency of demand for order fulfillment services.
There is a weak correlation of 40.60% between retail business strategies and the frequency of online store purchases.
There is a weak correlation of 26.70% between retail business strategies and the frequency of digital payment use.
Table 5 Factor Correlation Matrix.
| I. V. Retail Business Strategies | D. V. Consumption Patterns | Correlation Coefficient | Significance | N | Interpretation |
|---|---|---|---|---|---|
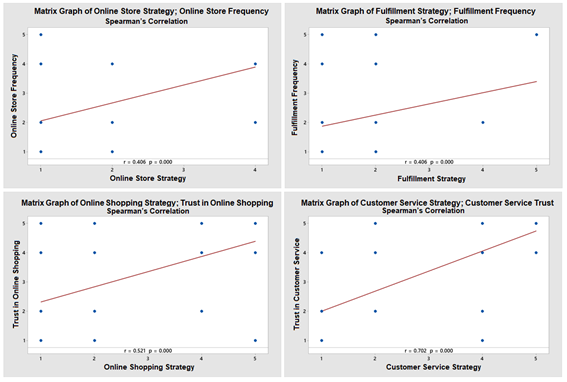
| Online stores | Frequency of online store purchases | .406 | .000 | 384 | Weak |
| Digital payment methods | Frequency of digital payment use | .267 | .000 | 384 | Weak |
| Purchase dispatch service | Frequency of demand for order fulfillment service | .406 | .000 | 384 | Weak |
| Online shopping | Degree of trust in online shopping | .521 | .000 | 384 | Moderate and strong |
| Customer service | Degree of trust in customer service | .702 | .000 | 384 | Moderate and strong |
Source: Statistic analysis in SPSS version 26.
The p-value and nonparametric correlations were calculated in Table 5. Their interpretation, taking the correlations of highest significance for a graphical representation, is shown in Figure 1.
DISCUSSION
As can be observed in the results, there is a weak correlation between retail business strategies and the frequency of online store purchases, with a Spearman correlation coefficient of 40.60%. In this line, Ríos (2020) indicates that the pandemic, through the isolation and confinement of society, led to the acceleration of e-commerce in Mexico, which represents a 59% peak in digital purchases in that country.
On the other hand, it was determined that there is a weak correlation between retail business strategies and the frequency of digital payment use, with a correlation coefficient of 26.70%. Quezada-Ruiz et al. (2020) found that 32% of consumers pay cash for their purchases, 44% pay with credit cards, which is the most popular means of payment, 12% pay with transfers, 5% pay through mobile applications and 7% use other means of payment.
CONCLUSIONS AND RECOMMENDATIONS
The results of the study suggest that the correlation between retail business strategies and department store consumption patterns is moderate and strong, which is reflected in the online shopping and customer service strategies with a correlation coefficient of 0.521 and 0.702 respectively. These strategies are the most significant for the companies under study.
Similarly, the frequency of digital payment use in department stores increased from 21.9% before the pandemic to 68.0%. In the case of the frequency of purchases in online stores, it went from 37.5% to 71.1%. In turn, the number of respondents requesting the service of purchase dispatch increased from 31.8% before the pandemic to 60.7%.
what effects the pandemic has had on the Peruvian retail sector in terms of demand for home delivery service and consumer confidence in online shopping should be studied, as there is insufficient research on these topics.
Finally, it is recommended that this research is replicated in various retail sectors, with the objective of using the results as the basis for designing a study methodology that can be implemented by companies to increase the impact of their business strategies in a digital environment.
REFERENCIAS
Abdirad, M., y Krishnan, K. (2022). Examining the impact of E-Supply Chain on Service Quality and Customer Satisfaction: A Case Study. International Journal of Quality and Service Sciences. 14(2), 274-290. https://doi.org/10.1108/IJQSS-08-2020-0131 [ Links ]
Alfaro, P. (2020). Cinco tendencias globales del sector consumo en la era post COVID-19. KPMG Tendencias. https://www.tendencias.kpmg.es/2020/09/cinco-tendencias-globales-sector-consumo-era-post-covid-19/ [ Links ]
Azuela Flores, J. I., Ochoa Hernández, M. L., y Ayup González, J. (2019). Segmentación del comprador online en México: un estudio con base en la frecuencia de compra electrónica. CIENCIA ergo sum, 26(2), 1-13. https://doi.org/10.30878/ces.v26n2a1 [ Links ]
Darma, G. S., y Noviana, P. T. (2020). Exploring Digital Marketing Strategies during the New Normal Era in Enhancing the Use of Digital Payment. Jurnal Mantik, 4(3), 2257-2262. https://iocscience.org/ejournal/index.php/mantik/article/view/1084 [ Links ]
Hashem, T. N. (2020). Examining the Influence of COVID 19 Pandemic in Changing Customers' Orientation towards E-Shopping. Modern Applied Science, 14(8), 59-76. https://doi.org/10.5539/mas.v14n8p59 [ Links ]
Joshi, A., Kale, S., Chandel, S., y Pal, D. K. (2015). Likert Scale: Explored and Explained. Current Journal of Applied Science and Technology, 7(4), 396-403. https://doi.org/10.9734/BJAST/2015/14975 [ Links ]
Lee, S. M., y Lee, D. (2020). “Untact”: a new customer service strategy in the digital age. Service Business, 14, 1-22. https://doi.org/10.1007/s11628-019-00408-2 [ Links ]
Lim, S. F. W. T., y Winkenbach, M. (2019). Configuring the Last-Mile in Business-to-Consumer E-Retailing. California Management Review, 61(2), 132-154. https://doi.org/10.1177/0008125618805094 [ Links ]
Ma, S., Lin, J., y Zhao, X. (2016). Online store discount strategy in the presence of consumer loss aversion. International Journal of Production Economics, 171(1), 1-7. https://doi.org/10.1016/j.ijpe.2015.10.016 [ Links ]
Martínez Ortega, R. M., Tuya Pendás, L. C., Martínez Ortega, M., Pérez Abreu, A., y Cánovas, A. M. (2009). El coeficiente de correlación de los rangos de Spearman, caracterización. Revista Habanera de CienciasMédicas, 8(2). [ Links ]
Quezada Ruiz, M. B., Gualán Ortega, S. L., y Ávila Rivas, V. A. (2020). Análisis del comportamiento de compra del segmento millenials frente a la pandemia Covid-19. Digital Publisher CEIT, 5(6-1), 300-313. https://doi.org/10.33386/593dp.2020.6-1.406 [ Links ]
Ríos Ruíz, A. A. (2020). Emergencia sanitaria y transacciones electrónicas: Covid-19 caso México. Perfiles de las Ciencias Sociales, 8(15). https://revistas.ujat.mx/index.php/perfiles/article/view/3901 [ Links ]
Savastano, M., Bellini, F., D’Ascenzo, F., y De Marco, M. (2019). Technology adoption for the integration of online-offline purchasing: Omnichannel strategies in the retail environment. International Journal of Retail & Distribution Management, 47(5), 474-492. https://doi.org/10.1108/IJRDM-12-2018-0270 [ Links ]
Sethuraman, R., Gázquez Abad, J. C., y Martínez López, F. J. (2022). The effect of retail assortment size on perceptions, choice, and sales: Review and research directions. Journal of Retailing, 98(1), 24-45. https://doi.org/10.1016/j.jretai.2022.01.001 [ Links ]
Tang, C. S., y Veelenturf, L. P. (2019). The strategic role of logistics in the industry 4.0 era. Transportation Research Part E: Logistics and Transportation Review, 129(1), 1-11. https://doi.org/10.1016/j.tre.2019.06.004 [ Links ]
Tavakol, M., y Dennick, R. (2011). Making Sense of Cronbach's Alpha. International Journal of Medical Education, (2), 53-55. https://doi.org/10.5116/ijme.4dfb.8dfd [ Links ]
Received: December 27, 2022; Accepted: March 08, 2023
 Este es un artículo publicado en acceso abierto bajo una licencia Creative Commons
