


Serviços Personalizados
Journal

Artigo
 texto em
  Inglês (pdf)
 Artigo em XML
 Referências do artigo
 Enviar este artigo por email
Indicadores
-
 Citado por SciELO
Links relacionados
-
 Similares em
SciELO
Similares em
SciELO
Compartilhar

 Permalink
Industrial Data
versão impressa ISSN 1560-9146versão On-line ISSN 1810-9993
Ind. data vol.26 no.1 Lima jan./jun. 2023
http://dx.doi.org/10.15381/idata.v26i1.24580
Production and Management
Application of Lean Manufacturing Tools (5S, Andon and Standard Time) to Increase Productivity in the Production Area of a Metalworking Company

1Industrial engineer from Universidad San Martín de Porres (Lima, Peru). Currently working as an independent consultant (Lima, Peru). E-mail: joseandres.bravo@unmsm.edu.pe
This research focuses on the analysis of the causes of low productivity in the production area of a metalworking company. It also aims to implement Lean Manufacturing tools (5S, Andon and standard time) to increase the company’s productivity. The insertion of these tools begins with an initial diagnosis by means of a value stream map. It is followed by the identification of root causes, the implementation of the tools and the evaluation of results in a period from April to September 2022. The final results were an increase in average productivity, which went from 0.26 tn/soles to 0.33 tn/soles, that is to say, the increase in productivity was achieved in the company under study.
Key words: Lean Manufacturing; 5S; Andon; Standard Time; Value Stream Map
INTRODUCTION
In December 2019, domestic and global businesses were hit by the COVID-19 pandemic, which caused reductions in both perceived sales and resources for large organizations. Losses were heavy and caused the closure of many of these companies, with Small and Medium Enterprises (SMEs) accounting for the largest percentage of those declared bankrupt.
In March 2020, the President of Peru announced the beginning of a state of sanitary emergency, which was the nationwide standstill of all non-essential economic activities and the closing of borders. In this context, the metalworking sector closed all types of activities for a period of 60 days.
The metalworking sector was included in the first reactivation phase, with the International Standard Industrial Classification (ISIC) code 2511. During the initial phase, problems arose in terms of material costs, low operating resources and delays in order delivery, which generated an increase in product prices and a growing concern for improving the efficiency and productivity of operations.
This study aims to improve productivity in a metalworking company by applying three Lean Manufacturing tools: 5S, Andon and Standard Time. The study focuses on the production area and begins with an initial diagnosis through the Value Stream Mapping, followed by the implementation of the Lean Manufacturing tools and, finally, the evaluation of the results obtained.
The study seeks to demonstrate the hypothesis “the implementation of Lean Manufacturing tools (5S, Andon and Standard Time) improves productivity in a metalworking company” through statistical analyses that serve to contrast the hypothesis of the study.
Likewise, this article seeks to serve as an example of the impact produced by the implementation of Lean Manufacturing tools in the metalworking sector, taking as a reference the company under study and resulting in the increase of productivity.
This research work highlights the main problems faced by companies in this sector: the lack of order and cleanliness in the work area, the slow response to failures or abnormal events in the processes, and the lack of clarity in the times used for production scheduling. Emphasis is also placed on how the application of a Lean approach can help mitigate these problems.
Regarding the limitations of the research, this work is focused on companies in the metalworking sector, on the application of some Lean tools that mitigate specific problems in the company (5S, Andon and Standard Time) and on how these have an impact on the company’s productivity.
THEORETICAL FRAMEWORK
Lean Manufacturing
According to Socconini (2019), Lean Manufacturing or Lean Production is defined as the set of continuous and systematic processes of identification and elimination of waste that does not add value to the production system.
Madariaga (2013), points out that it is a new model of organization and management of the productive system, in which all human capital is oriented to the fulfillment of the objective which is the elimination of all activity that does not add value to the organization. Moreover, the methodology has diversified in different areas of the company, originating, for example, Lean Office, Lean Maintenance, Lean Logistic, etc.
It is essential that Lean Manufacturing is built on trust, leadership and respect among all hierarchical levels of the organization because in this way the implementation of the methodology is successful (Garcia, 2011).
Waste
Neely et al. (1995) define wastage as errors that are made in the production system and that generate a great loss of productivity, since the work must be repeated as a result of the production process having not been carried out correctly the first time. The author points out that the possible causes of these wastes are critical to production: unnecessary movements, operator errors and inappropriate techniques regarding product replacement.
Kaizen
The term Kaizen means “change for the better”. The change of people’s attitude, considering their capabilities, leads to the success of the organization. The so-called Kaizen spirit is the attitude generated in the people involved in this philosophy and is the fundamental pillar to win the battle against waste in every organization (Hernández & Vizán, 2013).
The Kaizen model is the continuous improvement that involves all hierarchical levels of the company. The Kaizen philosophy goes much further, it is a lifestyle that leads to a progressive improvement in the family, work, etc., to achieve the objectives set in the short and long term (Masaaki, 2013).
Lean Manufacturing Tools
According to Socconini (2019), there are different tools within Lean Manufacturing that contribute to the achievement of its implementation. The key tools and the basis for a correct sustainment of the methodology are the 5S, Andon and Standard Time.
5S
5S is a methodology that focuses o n optimizing workplace conditions. It is made up of five steps: separate, sort, clean, standardize and discipline. This methodology does not only consist of cleaning and tidying up once or for aesthetic reasons but, on the contrary, it is based on rigor and constancy, as it contributes to the development of discipline within workers (Madariaga, 2013).
Separate (Seiri)
In this stage, the various elements located in the workstations are classified into two categories: necessary and unnecessary. Unnecessary is any element that is not used in the medium or short term in normal production activities, since they hinder the use of the necessary elements and generate large volumes in the area (Rajadell & Sánchez, 2010).
Sort (Seiton)
Hernández and Vizán (2013) mention that in this stage, the elements classified as necessary must be organized so that they can be easily found and returned once their use has been completed. There must be a precise level of order to produce with quality and efficiency and generate an adequate working environment for the employees.
Clean (Seiso)
Dirt is the main cause of breakdowns since it complicates the detection of anomalous situations that cause deterioration in machines and components. This stage focuses on identifying the sources of dirt and eliminating them to maintain a clean workplace and reduce waste generated by dirt (Madariaga, 2013).
Standardize (Seiketsu)
According to Socconini (2019), standardization consists of assuring that that the procedures, activities and practices obtained in the previous stages are continuously executed to ensure the consistency of the initial three S’s in the work area. To do so, it is necessary to standardize procedures for their preservation and provide feedback to those involved in said procedures.
Discipline (Shitsuke)
In this last stage, the standards established in the previous steps must be maintained. For the success of this phase, it will be necessary to carry out periodic audits in order to ensure that the expected level of implementation is reached (Socconini, 2019).
Andon
Within the Japanese context, Andon is defined as a dashboard or panel that helps production operators to give visibility to detected anomalies so that the work team can quickly resolve these problems and thus ensure process continuity and maintain manufacturing standards (Villaseñor & Galindo, 2016).
According to Córdova (2012), the implementation of Andon must follow an eight-stage structure for a correct insertion in the company. The performance of the person in charge of the implementation is crucial for the success of the application and its stages.
Stage I: Train employee in the principles, characteristics, benefits and prerequisites of Andon in the organization.
Stage II: Establish the scope of the tool.
Stage III: Write the overall objective of the application of the tool in terms of the process, which is the main benefit to be achieved.
Stage IV: Show the abnormal situations within the analyzed process.
Stage V: Assign the color ratio for each abnormal and normal situation at the workplace.
Stage VI: Establish the process or work area that will have indicator lights to indicate the working conditions.
Stage VII: Measure the frequency and response time to abnormal situations.
Stage VIII: Monitor the goals achieved.
Value Stream Mapping
The Value Stream Mapping (VSM) is a graphic schematization that uses symbols, material flows and information specific to a family of products within the factory, from the receipt of the order to its delivery. Being a tool that focuses on lead time reduction, VSM may lack the degree of detail necessary to show the different wastes in the production system (Madariaga, 2013).
The steps for the implementation of this tool as a measurement point for diagnosis consist of selecting a product family, creating the current map, giving ideas for improvement, mapping the future situation, recognizing possible pulls in the future map, and generating an improvement plan to add value to the future map (Socconini, 2019).
Standard Time
García (2005) defines standard time as the result, in units of time, of performing an activity, which includes causal elements and contingencies during the development of the time study. It is the normal time plus the allowances of the work itself which makes it possible to determine the standardized time that helps in the planning and determination of the time used for the work.
The evaluation of the operator’s work rhythm and supplements expresses that the performance rating factor is a technique to precisely determine the time in which an operator performs an operation at a normal work rhythm (Escalante & González, 2016).
The calculation of normal time should be determined by the qualification obtained by the employee in his work according to the Westinghouse method that presents four factors to evaluate the employee’s job: skill, effort, conditions, and consistency. The calculation also considers loose time, or allowances, which are the factors inherent to the human being and the environment that generate an additional delay in the execution of the work. The determination of the allowances is added to the normal time to determine the standard time, also known as standardized time, which is calculated for each element of the process. The sum of these elements results in the total standard time of the process (Garcia, 2005).
Lean Manufacturing Methodology
The implementation of the Lean Manufacturing philosophy is a complex task that goes beyond a tool, which is why the involvement of management at all levels of the organization is important (Sarria et al., 2017).
Stage 1
The first stage of the implementation of the Lean Manufacturing methodology should start with a diagnosis of the current situation of the company through the VSM, since it makes it possible to identify hidden problems and activities that do not add value (Sarria et al., 2017).
Stage 2
Following the implementation of the methodology it is important to continue with its diffusion to those involved in the area and subsequently proceed with the implementation of the 5S and standardization of processes (Sarria et al., 2017).
After the implementation of the bases of the methodology, it is necessary to look for Lean tools that favor and support the mitigation of the problems found in the initial diagnosis, in order to subsequently evaluate the results achieved in the implementation process (Sarria et al., 2017).
METHODOLOGY
In this study, a quantitative approach was taken. According to Hernández et al. (2014), a quantitative approach to research refers to a set of sequential and veridical processes, where researchers are concise, given that they conduct organized studies based on numerical and statistical measurements.
The hypotheses formulated are tested to achieve the objective sought through an explanatory level of research. The design followed by the work was pre-experimental. According to Hernández et al. (2014), the pre-experimental design is a study in which one or more independent variables are handled to analyze the consequences they cause on the dependent variables.
The unit of analysis was the production area of the metalworking company under study, where the relevant information for the research was obtained. The processes, causes and defects existing in the main processes of the area were analyzed.
The study population consisted of the different causes identified in the area in a period of 30 days. For the analysis and the taking of indicators over a period of seven months, 100% of the production of the chosen product family was considered. The steps followed in the research are sequenced as follows:
For the initial measurement, the productivity data from April to September 2021 were collected from the production area. They served as a diagnosis for the initial productivity.
The Product-Process Matrix tool was used to identify the product family to be chosen for the construction of the VSM.
The Value Stream Mapping was constructed to identify the critical processes of the area and analyze the flow of value and non-value in the company.
It was decided to take the cutting, painting and shot blasting processes for the implementation of the Lean tools (5 S, Andon and Standard Time) because they are processes that cause delays in the company’s value stream.
The Pareto chart and Ishikawa diagram were used to identify the relevant causes that occur in the critical processes for their subsequent mitigation with Lean Manufacturing tools.
The Lean Manufacturing methodology was followed, starting with the implementation of the 5S tool. For this purpose, an initial diagnosis of the cutting process was carried out first, followed by the implementation of the tool. A chronogram was used that included the implementation of each stage and what was to be achieved.
Andon tool was implemented in the shot blasting area in order to implement visual indicators that would identify the abnormal events that occurred as well as their initial time and posterior time after the implementation time.
The standard time was implemented in the painting area, following the Lean Manufacturing methodology, in order to identify the observed times and then evaluate them by means of the Westinghouse method and determine the normal time. The allowances in the process were evaluated. Finally, the standard time of each element and of the process was obtained.
The initial and posterior implementation results of the Lean Manufacturing tools were compared in order to identify the impact on the implemented areas.
In the final stage of the research, the research hypothesis was contrasted using the statistical tool Student’s t-test with the help of Minitab software. With the results obtained, the acceptance or rejection of the hypothesis were analyzed and determined.
RESULTS
Productivity
The following formula was used to determine the company’s productivity:
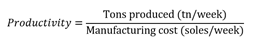
For the initial evaluation of productivity, records were taken from April to September 2021 (Table 1), which resulted in an average productivity of 0.26 tons/soles, which is a result below the company’s expectations.
Table 1 Average Productivity for 2021.
| Month | Productivity (tn/soles) |
|---|---|
| April | 0.26 |
| May | 0.24 |
| June | 0.27 |
| July | 0.26 |
| August | 0.26 |
| September | 0.25 |
Source: Prepared by the author.
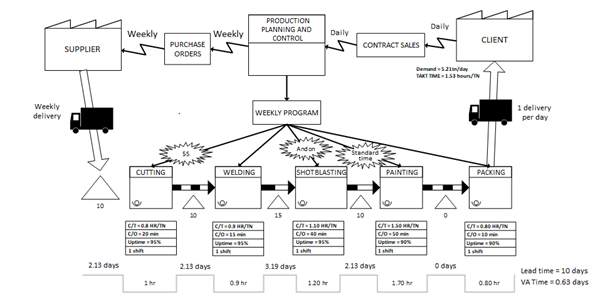
Value Stream Mapping
The VSM is used to construct the initial state of the processes and the lead time of the production system considering the product family identified in Table 2 and the cutting, welding, shot blasting, painting, and packing processes.
Table 2 Product-Process Matrix.
| Products | Cutting | Welding | Shot Blasting | Painting | Packing |
|---|---|---|---|---|---|
| Standard field tents | X | X | X | X | X |
| Igloo tents | X | X | X | X | X |
| Standard screen | X | X | X | X | X |
| Others | X | X | X |
Source: Prepared by the author.
Figure 1 shows that the painting process is critical since the cycle time required is 1.53 hours per ton and this activity exceeds it by taking up to 1.70 hours. The second critical process is shot blasting, followed by cutting.
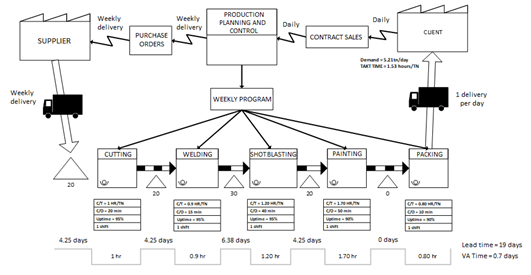
The results of lead time and time that adds value are 19 days and 0.7 days respectively, resulting in only 3.6% of the total time corresponding to activities that do add value.
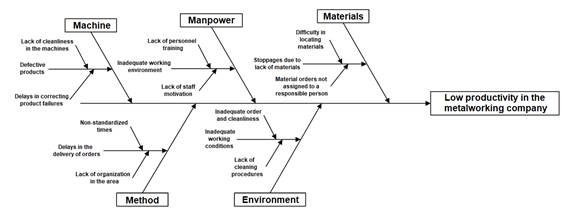
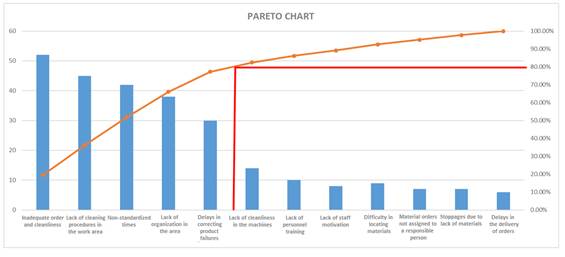
Cause Analysis
A cause-effect diagram was constructed to analyze the identified causes (Figure 2). It sought to relate the causes to each factor that caused the problem. A Pareto chart was then constructed (Figure 3). A 30-day period was taken to determine the frequency of occurrence of each identified cause in order to determine the most relevant causes for mitigation or improvement.
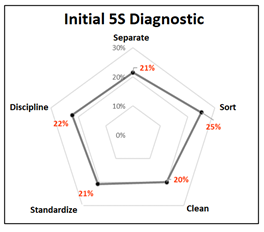
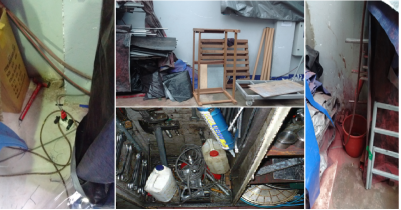
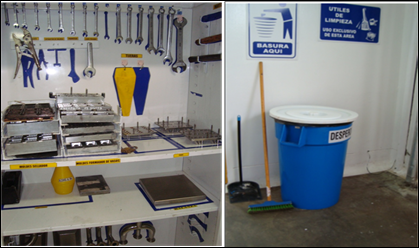
5S Diagnostic
The cutting process is taken to evaluate the initial results of 5S compliance in the work area (Figure 4) and the images of situation in the workplace (Figure 5).
Implementation of the 5S
The insertion of the tool follows the steps described by Madariaga (2013): separate, sort, clean, standardize and discipline. This was done in the following manner:
Construction of the schedule of activities for the entire implementation.
Training of the cutting personnel on the concepts and importance of the 5S.
S1: The operating personnel and the responsible for the area create a list of all unnecessary materials through the use of red cards.
S2: The ideal place is designated for the materials needed in the work with the corresponding signalization.
S3: All area personnel and administrative personnel are summoned for the day of the big cleanup in the work area.
S4: All the signalizations made in the work area and the 5S compliance manual are reviewed.
S5: Auditors are appointed to review compliance with the tool and subsequent observations are made.
Implementation of Andon
Andon is implemented in the shot blasting process to eliminate the high defect rates generated in the area. The stages that were followed are according to Córdova (2012).
Stage I: Training is conducted on basic issues of Andon and its application in the workplace, as well as the impact this has on production and product quality.
Stage II: The area where Andon will be applied is identified. In this case, the place where the tool is implemented is in the shot blasting process area.
Stage III: The objective is to detect, by means of visual tools, abnormal events in the shot blasting process, in order to generate shorter response times and a decrease in defective parts in the production line.
Stage IV: The abnormal situations that occur in the process are: machine breakdown, absence of material, waiting for product replacement, and defective product output.
Stage V: Color codes are established according to each type of abnormal and normal situation (Figure 6).
Stage VI: Color-coded identification signs will be used for abnormal and normal events and will be located at strategic points within the process.
Stage VII: A 30-day sample is taken to monitor the attention given by collaborators to abnormal situations in the shot blasting process (Table 3).
Stage VIII: A mural is prepared exclusively to monitor issues such as safety (accidents), quality (defects achieved in the process) and delivery (delivery delays by the process).
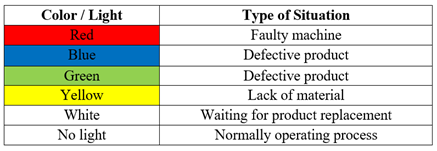
Table 3 Frequency and Response Time in Abnormal Situations.
| Type of Situation | Number of Times It Occurred | Average Response Time without Andon (min) | Average Response Time with Andon (min) |
|---|---|---|---|
| Faulty machine | 10 | 16 | 8 |
| Defective product | 15 | 20 | 9 |
| Lack of material | 9 | 15 | 7 |
| Waiting for product replacement | 6 | 19 | 9 |
Source: Prepared by the author.
Standard Time
The painting process is used to measure the work time. It should be noted that a timing measurement is used using a technique that sets the time back to zero and that the product taken as a reference for the measurement is the standard field tent.
To determine the elements that are part of the process, the process analysis diagram is applied. Fifteen measurements are taken for each element and the average time is calculated, and with the help of the Westinghouse method, the normal time is calculated. After that, the allowances within the process are identified for the calculation of the standard time of each element and of the process (Table 4).
Table 4 Summary of the Standard Time Calculation for Each Element.
| Elements | AT | PR | NT | A% | ST |
|---|---|---|---|---|---|
| Transfer of parts to the paint booth | 1.32 | 96% | 1.26 | 22% | 1.54 |
| Painting of first coat of paint | 3.84 | 96% | 3.69 | 22% | 4.5 |
| Painting of last coat of paint | 4.94 | 96% | 4.74 | 22% | 5.78 |
| Checking part sides | 2.19 | 96% | 2.11 | 22% | 2.57 |
| Moving parts to the drying area | 1.97 | 96% | 1.89 | 22% | 2.31 |
| Checking for imperfections in the paint | 2.98 | 96% | 2.86 | 22% | 3.49 |
| Drying of the product | 7.15 | 96% | 6.87 | 22% | 8.38 |
| Removal to finished product trays | 1.79 | 96% | 1.72 | 22% | 2.09 |
| Transfer to packing area | 2.28 | 96% | 2.19 | 22% | 2.67 |
Source: Prepared by the author.
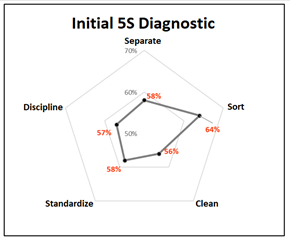
5S Results
Three evaluations were carried out using the audit format. The periods evaluated were April, June and September 2022 (Table 5). The results of the final audit (Figure 7) and the effect of the 5S in the workspace (Figure 8) are shown.
Table 5 5S Evaluation Results.
| Stage | Initial Score | Period 1 | Period 2 | Period 3 |
|---|---|---|---|---|
| Separate | 21% | 43% | 50% | 58% |
| Sort | 25% | 50% | 56% | 64% |
| Clean | 20% | 40% | 48% | 56% |
| Standardize | 21% | 42% | 50% | 58% |
| Discipline | 22% | 44% | 49% | 57% |
| Total | 26 | 52 | 60 | 75 |
Source: Prepared by the author.
Andon Application Results
The results obtained correspond to the periods of April, June, and September 2022, which show how the visual indicators had an impact on stopping abnormal situations in the work execution (Table 6).
Table 6 Andon Application Results.
| Type of Situation | Initial Period (min) | Initial Period 1 | Initial Period 2 | Initial Period 3 |
|---|---|---|---|---|
| Faulty machine | 8 | 8 | 7 | 7 |
| Defective product | 9 | 8 | 7 | 7 |
| Lack of material | 7 | 7 | 6 | 6 |
| Waiting for product replacement | 9 | 8 | 9 | 7 |
Source: Prepared by the author.
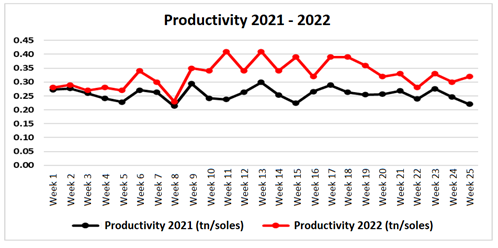
Productivity Result
Measurements are taken for a period of 6 months after the implementation of the tools and divided into weeks, resulting in a take of 25 weeks (Figure 9).
Value Stream Mapping Results
The future VSM, after the implementation of 5S, Andon and standard time in the cutting, shot blasting and painting processes respectively, is observed (Figure 10).
Hypothesis Test
Productivity data for the period 2021 and 2022 are recorded and analyzed for normality with a significance level of α = 0.05 when applying the Anderson-Darling test (Figure 11 and 12). The data are accepted as having a p-value > 0.05 at 95% confidence.
H0: The implementation of Lean Manufacturing tools (5S, Andon and Standard Time) does not improve productivity in a metalworking company.
H1: The implementation of Lean Manufacturing tools (5S, Andon and Standard Time) does improve productivity in a metalworking company.
The results obtained after performing the Student’s t-test is that the p-values are less than the significance level (p-value < α) (Table 7), which results in the rejection of the null hypothesis and the acceptance of the alternative (Table 8), which means that the implementation of Lean Manufacturing tools does improve the productivity of the company under study.
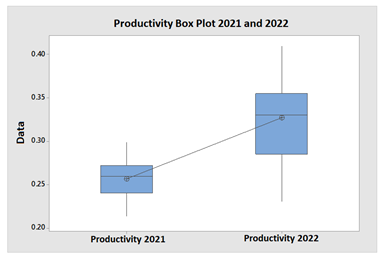
In the box plot performed (Figure 13), an increase in productivity can be observed in 2022 with respect to 2021, which shows an improvement due to the impact of the implementation of Lean tools.
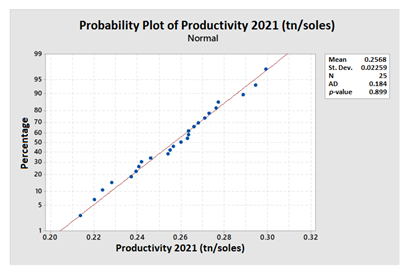
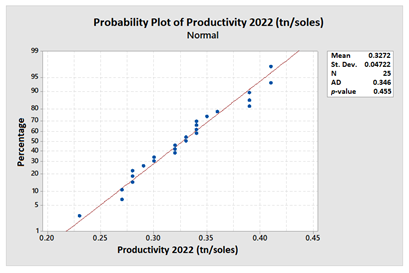
Table 7 Descriptive Statistics Results.
| Sample | N | Mean | St. Dev. | St. Error of the Mean |
|---|---|---|---|---|
| Productivity 2021 | 25 | 0.2568 | 0.0226 | 0.0045 |
| Productivity 2022 | 25 | 0.3272 | 0.0472 | 0.0094 |
Source: Prepared by the author.
DISCUSSION
By applying 5S, an improvement is achieved in terms of organization, order and cleanliness in the cutting area, with a 20% improvement after implementation. Likewise, as with the application of Andon, a reduction of up to 19% in the stoppage time for abnormal events was achieved. By determining the standard time of the painting process, it is possible to determine the standard time of the elements and process, giving a total of 1.50 hours per process.
The results show improvement and have an impact on a 27% increase in productivity compared to 2021. These results are similar to those obtained by Vargas (2022), who states that the implementation of Lean tools, such as 5S, impacted productivity, as it increased by 30%. Likewise, Bermejo (2019) mentions that the application of these tools improved productive times and increased the units produced, which also impacted on the 25% increase in their productivity.
According to the results obtained in the research, the use of Lean Manufacturing tools (5 S, Andon, standard time) manages to impact the productivity of any organization that presents problems of efficiency and effectiveness in its operations, which serves as a starting point to analyze the other tools that are part of the Lean Manufacturing system and how they impact productivity.
CONCLUSIONS
The application of the 5S improves working conditions, as it achieves improvement results of more than 21% in terms of sorting unnecessary objects, 44% in terms of maintaining a tidy workplace and up to 30% in maintaining cleanliness in the cutting area.
With the implementation of the standard time, an improvement is achieved in the standardization of times that were not standardized in the painting process. This has an impact on the processing time, since one ton is actually processed in 1.50 hours, which has an effect on the work that caused bottlenecks in the workflow and, therefore, has an impact on the productivity of the area.
Through the application of the Andon tool, the detection time of different abnormal events in the execution of the shot blasting process was improved, which initially totaled 33 minutes and, after implementation, decreased by up to 19%. This helps correct quality and reprocessing errors that caused high costs and affected the area’s productivity.
The different causes of low productivity in the production area of the company under study were affected by the implementation of Lean tools (5S, Andon and standard time). This resulted in a significant increase in productivity, as it went from an initial average productivity of 0.26 tons/soles to an improvement of 0.33 tons/soles.
The improvement in productivity has a direct impact on the efficiency of the area and helps the company’s lead time, as could be seen in the value stream map, since it went from an initial time of 19 days and a time-to-value of 0.7 days to a reduction resulting in 10 days with a value time of 0.63 days, which shows the effect of the implementations carried out in the organization.
REFERENCIAS BIBLIOGRÁFICAS
Bermejo Díaz, J. L. (2019). Lean Manufacturing para la mejora del proceso de fabricación de calzado para damas. (Tesis de Grado). Universidad Nacional Mayor de San Marcos, Lima. [ Links ]
Córdova Rojas, F. P. (2012). Mejoras en el proceso de fabricación Spools en una empresa metalmecánica usando la manufactura esbelta. (Tesis de grado). Pontificia Universidad Católica del Perú, Lima. [ Links ]
Escalante Lago, A., y González Zúñiga, J. F. D. (2016). Ingeniería industrial: Métodos y tiempos con manufactura ágil. México D. F., México: Alfaomega. [ Links ]
García Criollo, R. (2005). Estudio del trabajo. Ingeniería de métodos y medición del trabajo. México D. F., México: McGraw Hill. [ Links ]
García Cantú, A. (2011). Productividad y reducción de costos: Para la pequeña y mediana industria (2a ed.). México D. F., México: Trillas. [ Links ]
Hernández Matías, J. C., y Vizán Idoipe, A. (2013). Lean Manufacturing: Conceptos, técnicas e implementación. Madrid, España: Escuela de Organización Industrial. [ Links ]
Hernández Sampieri, R., Fernández Collado, C., y Baptista Lucio, P. (2014). Metodología de la investigación. México D.F., México: McGraw Hill. [ Links ]
Madariaga Neto, F. (2013). Lean Manufacturing: Exposición Adaptada a la fabricación repetitiva de familias de productos mediante procesos discretos. Madrid, España: Editorial Bubok. [ Links ]
Masaaki, I. (2013). Kaizen: La clave de la ventaja competitiva japonesa. Ciudad de México, México: Patria. [ Links ]
Neely, A., Gregory, M., y Platts, K. (1995). Performance measurement system design: A literature review and research agenda. Revista International Journal of Operations & Production Management, 15(4), 80-116. https://doi.org/10.1108/01443579510083622 [ Links ]
Rajadell, M., y Sánchez, J. L. (2010). Lean Manufacturing: La evidencia de una necesidad. Madrid, España: Ediciones Díaz de Santos. [ Links ]
Sarria Yépez, M. P., Fonseca Villamarín, G. A., y Bocanegra Herrera, C. C. (2017). Modelo metodológico de implementación de lean manufacturing. Revista Escuela de Administración de Negocios, (83), 51-71. https://doi.org/10.21158/01208160.n83.2017.1825 [ Links ]
Socconini, L. (2019). Lean Manufacturing. Paso a paso. Barcelona, España: Marge Books. [ Links ]
Vargas Crisóstomo, E. L. (2022). Aplicación del Lean Manufacturing para la mejora de la productividad en el proceso de producción de adhesivos acuosos en una empresa manufacturera. (Tesis de maestría). Universidad Nacional Mayor de San Marcos, Lima. [ Links ]
Villaseñor, A., y Galindo, E. (2016). Sistema 5S’s: Guía de implementación. Ciudad de México, México: Editorial Limusa. [ Links ]
Received: January 31, 2023; Accepted: March 13, 2023
 Este es un artículo publicado en acceso abierto bajo una licencia Creative Commons
