


Serviços Personalizados
Journal

Artigo
 texto em
  Inglês (pdf)
 Artigo em XML
 Referências do artigo
 Enviar este artigo por email
Indicadores
-
 Citado por SciELO
Links relacionados
-
 Similares em
SciELO
Similares em
SciELO
Compartilhar

 Permalink
Industrial Data
versão impressa ISSN 1560-9146versão On-line ISSN 1810-9993
Ind. data vol.26 no.2 Lima jul./dic. 2023 Epub 20-Dez-2023
http://dx.doi.org/10.15381/idata.v26i2.24002
Production and Management
Improvement of the Marking and Cutting Processes in a Textile Knitwear Company

1Textile engineer from Universidad Nacional de Ingeniería-UNI (Lima, Peru). Currently working as an independent consultant and adjunct professor at UNI (Lima, Peru). E-mail: g.camborda.p@uni.edu.pe
This research will serve as a precedent for other studies that aim to improve the production processes of textile and apparel companies by proposing a preventive solution for excess fabric waste that results from the production process. The study will also provide insights into reducing the amount of excess fabric waste in the marking and cutting areas via the manufacture of additional clothing items and accessories. Consequently, by efficiently allocating resources to make optimal use of seasonal material, costs can be reduced, ultimately leading to improved profitability for the textile knitwear company.
Keywords: strategy; 5S; evaluation; reliability
INTRODUCTION
In January 2018, exports of manufactured textile products increased by 9.8% when compared to January 2017, reaching a total of US$99 million. It is noteworthy that in 2021, textile product exports have steadily grown for eight consecutive months, with an increase of 18.8%. The top five countries that imported textile products from Peru in January 2018 were Brazil (230.2%), Germany (66.8%), Chile (31.0%, China (17.9%), and the United States (3.4%). In terms of economic blocs, textile exports to the European Union increased by 33.6%, to Asia by 9.6%, and to North America by 4.5%. Exports to Mercosur reached 94.1%.
According to Posada (2020), the relevance of the textile industry within a country’s economy is determined by the contributions of its different exports and the amount of formal employment it generates. In Peru, this sector generates over 400,000 jobs and contributes around 10% to the industrial sector’s gross domestic product (GDP). The textile industry is so important worldwide that it is included in trade agreements, such as the one signed between Peru and the United States. However, as pointed out by Posada (2020), the textile industry has suffered a considerable decline due to the global health crisis caused by the COVID-19 virus. During the first five months of 2020, textile and apparel exports dropped by 42.85%. Several subsectors were severely impacted and did not recover by the end of the year. The fiber subsector decreased by 58.71%, yarns decreased by 49.15%, fabrics decreased by 37.36%, and clothing and other apparel decreased by 40.93%.
Textile companies, like many industrial companies, have ongoing challenges regarding productivity, effectiveness, and resource utilization. They also face high operations and labor costs. To address these issues, companies must conduct timely analysis and evaluation of their processes.
The globalization of markets as well as growth in consumer purchasing power generates increased competition among local and international textile manufacturers, as a result, consumer satisfaction is prioritized. These specific characteristics force textile companies to develop strategies for innovation, technology, quality, and costs to stay competitive.
The production process of the textile company under study involves weaving, dyeing, marking, embroidery, printing, sewing, and finishing. However, it was observed that there was a lack of supervision and control from the start of the production process. Additionally, all areas exhibit excessive fabric waste and downtime, along with insufficient cleaning and general disorder. There is also an excessive movement of in-process products and a high personnel turnover, causing an inconsistent and interrupted flow of production within the company.
The research problem and purpose of this investigation is the marking and cutting process during production. Marking is the process of laying out pattern pieces, in the best possible way, on top of the production fabric to be cut to meet the production order. However, most of the time, patterns are not positioned properly, producing excess scrap fabric that is discarded and sold by weight to third parties for other purposes.
An efficiency analysis conducted in the Cutting Area revealed that during winter seasons, the cutting efficiency of production fabrics for one of the most important clients in the industry (who places orders for large quantities of fabrics, for instance, 50/1 Pima combed Jersey), is only 65%, meaning that 35% of the fabric is wasted. In summer seasons, the cutting efficiency is 70%, so only 30% is wasted.
To address the problems faced by textile companies located in North Lima (Lima Norte), a list of issues was compiled as shown in Table 1.
Table 1 Problems Found in Textile Companies Located in North Lima in 2021.
| Identified Problems | Monthly Frequency |
|---|---|
| 35% of high-quality fabric is discarded in winter season | 30 |
| 30% of high-quality fabric is discarded in summer season | 29 |
| Marker efficiency 65%-70% | 27 |
| Inadequate marking with space leftover | 26 |
| Uncontrolled, inadequate cutting due to fabric defects | 15 |
| Sold excess fabric | 5 |
| Poorly prepared technical specifications | 4 |
| TOTAL | 136 |
Source: Prepared by the author.
Excess fabric from the marking and cutting processes was identified as the main problem (Figure 1).

The hypothesis of this study suggests that, for a textile knitwear company in 2021, improvement in the marking and cutting processes of high quality, seasonal fabric for the production of accessories and additional clothing products, significantly increases production; the better utilization of seasonal fabric; and reduce the amount of scrap material resulting from the cutting process.
This research is relevant as it will set a precedent for future studies that look to improve production processes in textile and apparel companies by proposing preventive solutions. Moreover, by efficiently allocating resources, excess fabric waste in the Marking and Cutting areas can be reduced, leading to cost savings and increased profitability.
The new methodology used in complementary marking will substantially improve quality, reduce costs, and eliminate unnecessary time in the cutting process. This will make the process more efficient, enabling the production of new additional clothing items and accessories using excess high-quality fabric from the cutting process.
Therefore, the production of additional clothing items and accessories using excess fabric can provide the flexibility and innovation needed in the apparel industry. To achieve this, modern techniques based on the Jut-in-time philosophy and the 5S principles can be applied to eliminate and reuse waste or resources that do not add value to the final product.
This research aims to assess how, for a textile knitwear company in 2021, improving the marking and cutting processes by using high-quality excess fabric for the production of clothing items and accessories impacts the increase of production, the usage of seasonal fabric, and the amount of scrap material resulting from the cutting process.
The scope of this research is to develop a methodology that simplifies the calculation of the number of additional clothing items and accessories that can be created using excess fabric. By optimizing the marking and cutting processes in the production stage, the company can enhance its efficiency and profitability.
The research faced some limitations due to the scarce availability of textile sector research results on marking and cutting processes, and the internal difficulties in collecting information from operators in the Marking and Cutting areas.
BACKGROUND
According to Naranjo (2019), every year the textile industry generates a large amount of waste and fabric scraps, most of which, especially the smaller ones, are thrown away instead of being sold or reused. In Colombia, for instance, over 15,000 tons of textile scraps are wasted annually, which negatively impacts the environment. Therefore, there is a need to find ways to make use of this fabric waste and give it a second life.
Generally, the excess fabric generated during the marking and then the cutting process is often stockpiled for the manufacture of low-value products with a short lifespan, not profitable for textile companies (Gómez et al., 2019).
The marking process is the stage where the pattern pieces are laid out on top of the production fabric to be cut in such a way that they occupy the least amount of space (Pumasunta, 2018). Using textile waste can create unique visual effects, where colors, textures, and shapes are mixed to create new garments or accessories (Villalba, 2019). This approach can provide a fresh perspective to the textile industry. Textile companies need to take advantage of the creative potential of their employees to generate new ideas and apply them to product and service creation (Ortiz, 2020). Additionally, textile companies should adopt sustainable practices as part of their production process to significantly reduce textile waste generation (Guerrón, 2019).
Industrial patternmaking often leaves a lot of negative space between patterns. This happens because patterns are designed to fit the human body, and the pieces do not always fit perfectly. The process of industrial patternmaking involves parallel lines, radial lines, single-curved surfaces, double-curved surfaces, and warped surfaces (Guamán et al., 2020). Due to the rise of industrialization and globalization, textile processes have been streamlined to save resources, reduce time, and increase profitability. Technical expertise is essential in patternmaking to ensure that the marking process is carried out properly, and the appropriate patterns are drawn up (Villa, 2020). Before beginning the cutting process, it is crucial to verify that the pieces that will make up the garments are the correct ones to avoid wasting fabric (Gómez, 2019). To achieve streamlined processes, it is important to conduct an inspection in which quality criteria are given priority. This inspection will help reduce the costs associated with reprocessing, defective units, and fabric waste (Arce & Yépez, 2020).
According to Sifuentes (2019), using a technical sheet can provide valuable information on costs, waste, maintenance, and losses. These sheets include details on the design, fabric and inputs, pattern and cutting, production, garment measurements, additional processes, and finishing processes. Sánchez and Quea (2020) suggest that various tools, such as VSM, Lean, 5S, Linear Programming, and Redutex, can be used for the preparation of technical sheets. They also propose creating awareness and a culture of no waste, implementing 6S, and encouraging and maintaining change and continuous improvement to reduce waste. Ramírez (2020) notes that some textile companies still use artisanal production processes which result in disorganization, machine failures, lack of training programs, and inadequate use of raw materials, inputs, and equipment. This leads to waste being produced due to the inappropriate use of resources.
On the other hand, some textile companies lack standardized processes, or in other words, they do not follow the appropriate procedures, which leads to delays in product delivery, customer complaints, discomfort, and increased waste in the cutting process (Gutiérrez & Vega, 2019). Applying visual management techniques can improve the quality, reliability, and productivity of textile products while also reducing costs due to waste reduction (Gallardo, 2019). To achieve this, patterns should be created with seam allowances incorporated and all the necessary specifications included to simplify production processes (Lavado, 2018).
THEORETICAL BASIS
Textile and Apparel Manufacturing Process
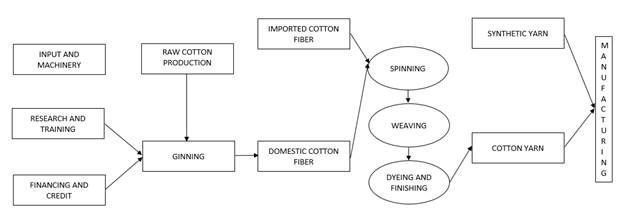
The textile manufacturing process begins in the coastal valleys with the production of raw cotton. This process includes cotton ginning, spinning, weaving domestic and imported cotton fiber, and dyeing and finishing processes (Figure 2).
The apparel manufacturing process consists of four procedures: design, pre-sewing, sewing, and finishing (Figure 3).
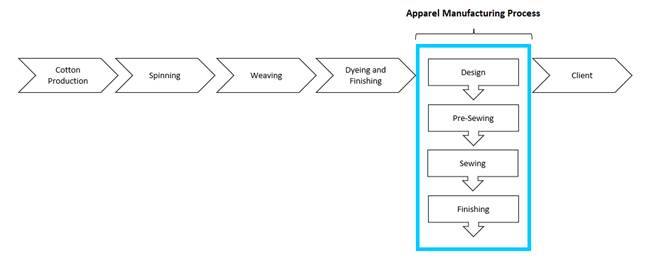
Source: Aliaga et al., 2008, as cited in Schultz, 2017.
Figure 3 Textile and Apparel Manufacturing Process.
Design
According to Schultz (2017), the design process involves creating garment designs based on fashion trends or tendencies. Designs can also be provided by clients with the specific specifications they want. It is important to note that these designs should be approved by customers.
Paredes (2018) outlines the four phases of any design process:
Phase one involves observing and analyzing the environment to determine human needs. In phase two, those needs are analyzed by the company and reinforced. In phase three, a solution is planned and sought, with an emphasis on satisfying the needs or requirements. Mock-ups, molds, patterns, and blueprints are used in this phase to find favorable opportunities. Finally, in phase four, the original idea is constructed and implemented using materials for product development.
These actions occur continuously, depending on the design procedure and requirements.
Pre-Sewing
The pre-sewing process, according to Schultz (2017), involves marking and cutting the fabric based on patterns. To start, the fabric is spread and patterns are placed on it. Next, the contour of the patterns is traced onto the fabric with chalk. Finally, the marked fabric is cut into pattern pieces, which will be used for sewing.
Pattern making, as explained by Paredes (2018), entails creating a set of lines or stripes based on statistical data on body proportions and compositions. These standard measurements are used to create patterns of various sizes. In other words, pattern making involves creating basic patterns or molds for garments from measurements taken from a diverse group of subjects, resulting in standard measurements that can be used to make different sizes of clothes.
According to Vélez et al. (1996), there are three types of patterns: basic pattern, block pattern, and sample pattern.
The basic pattern is the type of pattern that remains unchanged by fashion trends. It is important to know how to work with this pattern and to master it.
The block pattern is the foundation pattern that has been modified according to standardized design specifications. It is important to check for any possible errors.
The sample pattern is the approved pattern with all the modifications.
Size is a standardized representation of measurements used to identify the size of garments. These measurements are directly related to the anatomy of the person wearing the garment, which is explained in size charts.
According to Pumasunta, 2018, the marker making process involves fitting all of the garment patterns into the smallest place possible on the fabric that will be cut. This process can be manual or digital. In manual marker making, the patterns are placed on the fabric according to each pattern grain line to save material. The patterns are then marked on the fabric and cut. On the other hand, in digital marker making, the garment patterns are placed in a software where the layout is developed on a rectangular form that has the measurements of the fabric in terms of width and length set. The assigned worker arranges the patterns using a mouse and the location of the patterns is displayed on the computer screen. Finally, after improving the marker, the pattern is printed using a plotter.
In order to make the best use of the material in the marker making process, it is essential to consider certain quality specifications as stated by Barretto (2013), as cited in Pumasunta, (2018). These specifications are:
Line clarity: The cutting quality is defined by the thin, sharp, and correctly defined strokes.
Cutting clearance freedom: The operator must place patterns in a way that allows more freedom of movement when cutting. This is especially important in areas where there are sharp angles or compact curves.
Appropriate pattern labeling: Each cut pattern piece must be identified with size, model, and pattern number.
Pattern conformity to grain lines: The grain lines of each pattern should be considered and oriented according to the weave of the fabric.
Pattern facing: Depending on the type of overlapping or spreading of the fabric at the time of cutting, there must be a vertical or horizontal pattern facing if all the pieces are considered in the marker.
Pattern count: The number of pieces that are marked according to the use or not of the facing. In other words, whether one or half a garment is obtained per overlapping layer.
Likewise, Barretto (2013), as cited in Pumasunta (2018), suggests that the marker subprocess can be divided into three subprocesses based on the type of spreading, sizes, and models. Concerning the type of spreading, there are face-to-face, where the marker goes face-to-face with the fabric, and nap one-way, where the marker is placed on the right side of the fabric and can go up or down. Concerning the sizes, it is considered whether the marker includes one or several sizes of the same model. Concerning the model, it is considered whether the marker includes one or several models.
There are two methods to calculate marker efficiency. The first method, called percentage utilization, shows that there is a relationship between utilization and waste. Percentage utilization refers to the area used while waste refers to the area not used. It is recommended that the fabric utilization should be 90% and waste should be 10%. The waste generally includes areas like edges, curves, and areas where it is tough to arrange patterns properly, making them unusable for garment assembly. To calculate this, you need to know the area of the patterns and the area of the marker (Barretto, 2013, as cited in Pumasunta, 2018).

The second method is the measurement per garment, which calculates the average amount of material required to produce a garment by dividing the length of the marker plan by the number of patterns marked. It is important to note that this method is indifferent to the fabric’s length or width, unlike the percentage utilization method (Barretto, 2013, as cited in Pumasunta, 2018).
The percentage utilization method is the most commonly used and efficient one in the textile sector. It calculates the amount of material required based on the percentage of the fabric used in the marker plan. On the other hand, the measurement per garment method is useful for accounting purposes, such as tracking direct materials and raw materials and calculating costs.
Sewing
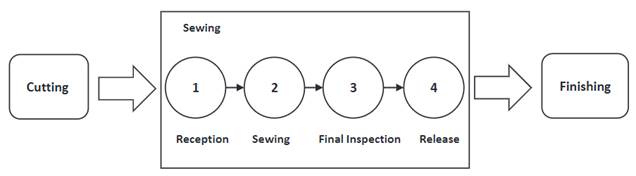
The sewing process involves assembling the fabric pieces that were delivered during the pre-sewing stage (Figure 4). This process leads to the creation of the final garment, which is achieved after the finishing process (Schultz, 2017).
To create the desired garment, fabric pieces are joined together using a sewing machine. Sometimes, the pieces are joined together preliminary to make the process easier (Pumasunta, 2018). Similarly, Fonseca (2020) suggests pinning or basting the pieces together before sewing, after which the garment should be checked to determine if any modifications are needed before sewing permanent stitches with the sewing machine.
According to Chozo and Escriba (2019), sewing involves assembling the cut pieces as per the design to obtain a complete garment through a succession of operations using sewing machines. A traditional garment usually consists of a front bodice, back bodice, sleeves, and collar, but this may vary depending on the model.
Finishing
Finishing is the final stage of apparel manufacturing, which involves a range of complementary processes necessary for garments, such as embroidery, printing, dyeing, or any other finishing required by the customer (Schultz, 2017).
Pumasunta (2018) explains that the finishing process takes place after the sewing process when the assembled garment is ready for delivery. This process includes color assignment, labeling, thread cutting, button attaching, and packaging, among others. The ultimate goal of this process is to ensure that the customer receives a product that is of the highest quality. Fonseca (2020) adds that before cutting excess threads, ironing, and labeling, the garments go through a series of physical tests to ensure that they meet required standards.
METHODOLOGY
This is a non-experimental research study, which means that independent variables were not intentionally modified to observe their impact on other dependent variables (Hernández et al., 2014). The phenomena were observed as they occurred and subsequently analyzed.
During the production process, it was observed that marking was performed on the production fabric. Although marker making is supposed to be the best possible distribution of pieces to be cut for the production order, excess fabric is often produced, which is either discarded or sold by weight to third parties for other purposes.
The research followed a cross-sectional, correlational-causal design, as data was collected at a specific moment in time to describe variables and study their influence and relationship (Hernández et al., 2014). This design enables the examination of correlations and cause-effect relationships. The categories, concepts, and variables (X1 - Y1) are described in Table 2.
Table 2 Non-Experimental Cross-Sectional, Correlational-Causal Design Scheme.
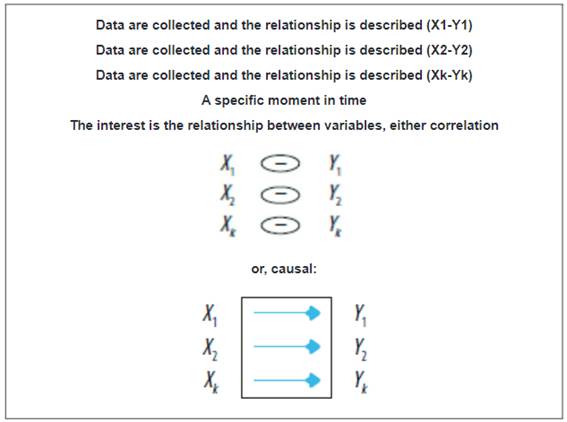
Source: Prepared by the author.
The unit of analysis consisted of the operators working in the marking and cutting area of textile companies located in North Lima. The population consisted of 62 operators working in the marking and cutting area of textile companies located in North Lima.
A sample of 43 operators working in the marking and cutting area of textile companies located in North Lima was selected using simple random probability sampling was used to select the sample. According to, Hernández et al. (2014), this sampling method ensures that all components of the population have an equal chance of being selected for the sample. The sample was selected based on the specific characteristics of the population and the sample size.

Where:
z |
coefficient of the normal distribution for a confidence level of 95%: 1.96 |
N |
sample size |
p |
acceptance percentage (90%) |
q |
rejection percentage (10%) |
N |
population size (62) |
e |
error for finite simples (5%) |
After using the formula, it was found that n = 43, as shown below.


n = 43
The survey technique was used to collect data from operators in the marking and cutting area of selected textile companies (Hernández et al., 2014). A questionnaire was used as the research instrument to gather information on excess fabric and the marking and cutting processes in these companies. As per Bernal (2010), the validity of an instrument depends on what it measures and how well it is executed (p. 247). Expert judgment was used to determine the effectiveness of the research instrument. The experts analyzed the questions based on clarity, pertinence, and relevance criteria. The reliability of the research variables marking and cutting processes in a pilot test administered to marking and cutting operators of textile companies located in the districts of North Lima was evaluated using Cronbach’s alpha, obtaining a coefficient of 0.965. Thus, the instrument was deemed “excellent” in terms of reliability. The reliability of the research variable excess fabric in a pilot test administered to marking and cutting operators of textile companies located in the districts of North Lima was also evaluated using Cronbach’s alpha, obtaining a coefficient of 0.959. Thus, the instrument was deemed “good” in terms of reliability.
RESULTS
Descriptive and inferential analyses were used for data processing.
Descriptive Analysis
The collected survey data was analyzed using descriptive methods. The data was coded, tabulated, and then sorted by dimensions. Statistical analysis was performed using the SPSS software, and frequency tables and figures were prepared with their respective interpretations.
The marking and cutting processes variable was evaluated as a percentage, considering the scales “inadequate”, “slightly adequate”, and “adequate”. Subsequently, data was organized to evaluate the marking process and cutting process dimensions in percentage terms, considering the same scales.
Table 3 Evaluation of Marking and Cutting Processes Variable.
| Frequency | Percentage | Valid percentage | Cumulative percentage | ||
|---|---|---|---|---|---|
| Valid | Inadequate | 18 | 41.9 | 41.9 | 41.9 |
| Slightly Adequate | 17 | 39.5 | 39.5 | 81.4 | |
| Adequate | 8 | 18.6 | 18.6 | 100.0 | |
| Total | 43 | 100.0 | 100.0 | ||
Source: Prepared by the author based on the survey administered to the operators working in the marking and cutting areas.

Table 3 and Figure 5 illustrate the behavior of the sample concerning the marking and cutting processes variable. Forty-one point nine percent (41.9%) of the operators stated that the marking and cutting processes are “inadequate”, 39.5% stated that they are “slightly adequate”, and 18.6% stated that they are “adequate”. Therefore, marking and cutting operators of textile companies located in the districts of North Lima believe that the marking and cutting processes are “inadequate”.
Table 4 Evaluation of Marking Process Dimension.
| Frequency | Percentage | Valid Percentage | Cumulative Percentage | ||
|---|---|---|---|---|---|
| Valid | Inadequate | 17 | 39.5 | 39.5 | 39.5 |
| Slightly Adequate | 18 | 41.9 | 41.9 | 81.4 | |
| Adequate | 8 | 18.6 | 18.6 | 100.0 | |
| Total | 43 | 100.0 | 100.0 | ||
Source: Prepared by the author based on the survey administered to the operators working in the marking and cutting areas.

Table 4 and Figure 6 illustrate the behavior of the sample concerning the marking process dimension. Forty-one point nine percent (41.9%) of the operators stated that the marking process is “slightly adequate”, 39.5% stated that it is “inadequate”, and 18.6% stated that it is “adequate”. Therefore, marking and cutting operators of textile companies located in the districts of North Lima believe that the marking process is “slightly”.
Table 5 Evaluation of Cutting Process Dimension.
| Frequency | Percentage | Valid Percentage | Cumulative Percentage | ||
|---|---|---|---|---|---|
| Valid | Inadequate | 27 | 62.8 | 62.8 | 62.8 |
| Slightly Adequate | 8 | 18.6 | 18.6 | 81.4 | |
| Adequate | 8 | 18.6 | 18.6 | 100.0 | |
| Total | 43 | 100.0 | 100.0 | ||
Source: Prepared by the author based on the survey administered to the operators working in the marking and cutting areas.
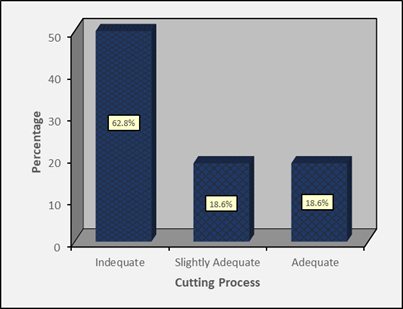
Table 5 and Figure 7 illustrate the behavior of the sample concerning the cutting process dimension. Sixty-two point eight percent (62.8%) of the operators stated that the cutting process is “inadequate”, 18.6% stated that it is “slightly adequate”, and 18.6% stated that it is “adequate”. Therefore, marking and cutting operators of textile companies located in the districts of North Lima believe that the cutting process is “inadequate”.
On the other hand, the excess fabric variable was evaluated as a percentage, considering the scales “inadequate”, “slightly adequate”, and “adequate”. Subsequently, data was organized in percentage terms to evaluate the utilization of seasonal fabric and the amount of scrap material resulting from the cutting process dimensions, considering the scales “high”, “regular”, and “low”.
Table 6 Evaluation of Excess Fabric Variable.
| Frequency | Percentage | Valid Percentage | Cumulative Percentage | ||
|---|---|---|---|---|---|
| Valid | High | 19 | 44.2 | 44.2 | 44.2 |
| Regular | 16 | 37.2 | 37.2 | 81.4 | |
| Low | 8 | 18.6 | 18.6 | 100.0 | |
| Total | 43 | 100.0 | 100.0 | ||
Source: Prepared by the author based on the survey administered to the operators working in the marking and cutting areas.

Table 6 and Figure 8 illustrate the behavior of the sample concerning the excess fabric dimension. Forty-four point two percent (44.2%) of the operators stated that the excess fabric produced is “high”, 37.2% stated that it is “regular”, and 18.6% stated that it is “low”. Therefore, marking and cutting operators of textile companies located in the districts of North Lima believe that the excess fabric produced is “high”.
Table 7 Evaluation of Utilization of Seasonal Fabric Dimension.
| Frequency | Percentage | Valid Percentage | Cumulative Percentage | ||
|---|---|---|---|---|---|
| Valid | High | 20 | 46.5 | 46.5 | 46.5 |
| Regular | 9 | 20.9 | 20.9 | 67.4 | |
| Low | 14 | 32.6 | 32.6 | 100.0 | |
| Total | 43 | 100.0 | 100.0 | ||
Source: Prepared by the author based on the survey administered to the operators working in the marking and cutting areas.
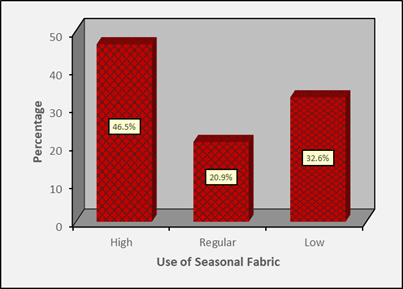
Table 7 and Figure 9 illustrate the behavior of the sample concerning the utilization of seasonal fabric dimension. Forty-six point five percent (46.5%) of the operators stated that the utilization of seasonal fabric is “high”, 32.6% stated that it is “low”, and 20.9% stated that it is “regular”. Therefore, marking and cutting operators of textile companies located in the districts of North Lima believe that the utilization of season fabric is “high”.
Table 8 Evaluation of the Amount of Scrap Material Resulting from the Cutting Process Dimension.
| Frequency | Percentage | Valid Percentage | Cumulative Percentage | ||
|---|---|---|---|---|---|
| Valid | High | 21 | 48.8 | 48.8 | 48.8 |
| Regular | 14 | 32.6 | 32.6 | 81.4 | |
| Low | 8 | 18.6 | 18.6 | 100.0 | |
| Total | 43 | 100.0 | 100.0 | ||
Source: Prepared by the author based on the survey administered to the operators working in the marking and cutting areas.
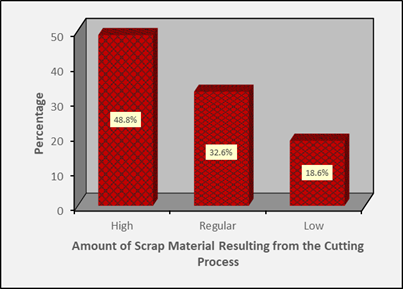
Source: Prepared by the author.
Figure 10 Evaluation of the Amount of Scrap Material Resulting from the Cutting Process Dimension.
Table 8 and Figure 10 illustrate the behavior of the sample concerning the amount of scrap material resulting from the cutting process dimension. Forty-eight point eight percent (48.8%) of the operators stated that the amount of scrap material resulting from the cutting process is “high”, 32.6% stated that it is “regular”, and 18.6% stated that it is “low”. Therefore, marking and cutting operators of textile companies located in the districts of North Lima believe that the amount of scrap material resulting from the cutting process is “high”.
Subsequently, three contingency tables were prepared to show the relationship between the variables. The first table shows the relationship between the variables marking and cutting processes and excess fabric. The second table shows the relationship between the variable marking and cutting processes and the dimension utilization of seasonal fabric. Finally, the third table shows the relationship between the variable marking and cutting processes and the amount of scrap material resulting from the cutting process dimension. All contingency tables were prepared considering the values of each of the variables and the results of their corresponding scales.
Table 9 Contingency Table: Marking and Cutting Processes and Excess Fabric.
| High-Quality Excess Fabric | Total | |||||
|---|---|---|---|---|---|---|
| High | Regular | Low | ||||
| Marking and Cutting Processes | Inadequate | Count | 14 | 4 | 0 | 18 |
| % of Total | 32.6% | 9.3% | 0.0% | 41.9% | ||
| Slightly Adequate | Count | 5 | 12 | 0 | 17 | |
| % of Total | 11.6% | 27.9% | 0.0% | 39.5% | ||
| Adequate | Count | 0 | 0 | 8 | 8 | |
| % of Total | 0.0% | 0.0% | 18.6% | 18.6% | ||
| Total | Count | 19 | 16 | 8 | 43 | |
| % of Total | 44.2% | 37.2% | 18.6% | 100.0% | ||
Source: Prepared by the author based on the survey administered to the operators working in the marking and cutting areas.
Source: Prepared by the author.
Figure 11 Contingency Table: Marking and Cutting Processes and Excess Fabric.
From the data presented in Table 9 and Figure 11, three conclusions were drawn. First, it was observed that 32.6% of the operators reported that the marking and cutting processes were “inadequate”, which also resulted in a “high” excess fabric production. Second, it was observed that 27.9% of the operators stated that the marking and cutting processes were “Slightly Adequate”, which resulted in “regular” excess fabric production. Third, it was observed that 18.6% of the operators stated that the marking and cutting processes were “adequate”, which resulted in a “low” excess fabric production.
Table 10 Contingency Table: Marking and Cutting Processes and Utilization of Seasonal Fabric.
| Utilization of Seasonal Fabric | Total | |||||
|---|---|---|---|---|---|---|
| High | Regular | Low | ||||
| Marking and Cutting Processes | Inadequate | Count | 14 | 4 | 0 | 18 |
| % of Total | 32.6% | 9.3% | 0.0% | 41.9% | ||
| Slightly Adequate | Count | 6 | 5 | 6 | 17 | |
| % of Total | 14.0% | 11.6% | 14.0% | 39.5% | ||
| Adequate | Count | 0 | 0 | 8 | 8 | |
| % of Total | 0.0% | 0.0% | 18.6% | 18.6% | ||
| Total | Count | 20 | 9 | 14 | 43 | |
| % of Total | 46.5% | 20.9% | 32.6% | 100.0% | ||
Source: Prepared by the author based on the survey administered to the operators working in the marking and cutting areas.
Source: Prepared by the author.
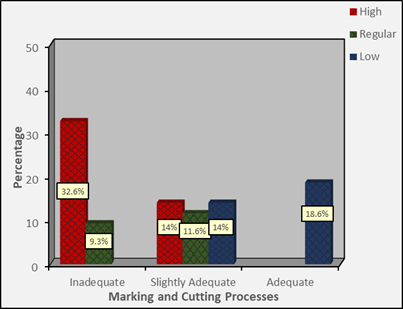
Figure 12 Contingency Table: Marking and Cutting Processes and Utilization of Seasonal Fabric.
From the data presented in Table 10 and Figure 12, three conclusions were drawn. First, it was observed that 32.6% of the operators reported that the marking and cutting processes were “inadequate”, which also resulted in “high” utilization of seasonal fabric. Second, it was observed that 11.6% of the operators stated that the marking and cutting processes were “slightly adequate”, which resulted in “regular” utilization of seasonal fabric. Third, it was observed that 18.6% of the operators stated that the marking and cutting processes were “adequate”, which resulted in “low” utilization of seasonal fabric.
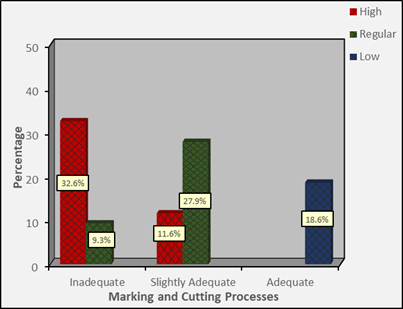
Table 11 Contingency Table: Marking and Cutting Processes and the Amount of Scrap Material Resulting from the Cutting Process.
| Amount of Scrap Material Resulting from the Cutting Process | Total | |||||
|---|---|---|---|---|---|---|
| High | Regular | Low | ||||
| Marking and Cutting Processes | Inadequate | Count | 14 | 4 | 0 | 18 |
| % of Total | 32.6% | 9.3% | 0.0% | 41.9% | ||
| Slightly Adequate | Count | 7 | 9 | 1 | 17 | |
| % of Total | 16.3% | 20.9% | 2.3% | 39.5% | ||
| Adequate | Count | 0 | 1 | 7 | 8 | |
| % of Total | 0.0% | 2.3% | 16.3% | 18.6% | ||
| Total | Count | 21 | 14 | 8 | 43 | |
| % of Total | 48.8% | 32.6% | 18.6% | 100.0% | ||
Source: Prepared by the author based on the survey administered to the operators working in the marking and cutting areas.
Source: Prepared by the author.
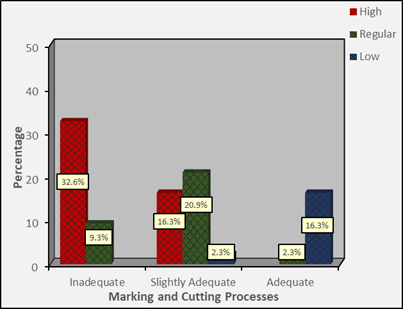
Figure 13 Contingency Table: Marking and Cutting Processes and the Amount of Scrap Material Resulting from the Cutting Process.
From the data presented in Table 11 and Figure 13, three conclusions were drawn. First, it was observed that 32.6% of the operators reported that the marking and cutting processes were “inadequate”, which also resulted in a “high” amount of scrap material resulting from the cutting process. Second, it was observed that 20.9% of the operators stated that the marking and cutting processes were “slightly adequate”, which resulted in a “regular” amount of scrap material resulting from the cutting process. Third, it was observed that 16.3% of the operators stated that the marking and cutting processes were “adequate”, which resulted in a “low” amount of scrap material resulting from the cutting process.
Inferential Analysis
Chi-square hypothesis testing was used for the inferential analysis to determine the impact of the marking and cutting processes on excess fabric.
General Hypothesis Testing
Ho: For the textile knitwear company in 2021, improving the marking and cutting processes using high-quality excess fabric for the production of high-quality clothing items and accessories does not significantly impact the increase in production.
Ha: For the textile knitwear company in 2021, improving the marking and cutting processes using high-quality excess fabric for the production of clothing items and accessories does significantly impact the increase in production.
Test Statistic. The test statistic used is Chi-square, assuming a test significance level (α) of 0.05 in contrast to the statistical significance value of the p-value.
Table 12 Chi-Square Test of the General Hypothesis.
| Value | df | Asymptotic Significance (2-sided) | |
|---|---|---|---|
| Pearson Chi-Square | 53.125a | 4 | .000 |
| Likelihood Ratio | 49.914 | 4 | .000 |
| Linear-by-Linear Association | 27.726 | 1 | .000 |
| N of Valid Cases | 43 |
a. 5 cells (55.6%) have expected count less than 5. The minimum expected count is 1.49.
Source: Prepared by the author based on the survey administered to the operators working in the marking and cutting areas.
As shown in Table 12, the Chi-square value was calculated at 53.125, which is greater than the value specified in the table (9.4877). Additionally, the likelihood ratio was found to be p = 0.000, which is less than the threshold value of p < 0.05. These findings indicate that the null hypothesis is rejected and the alternative hypothesis is accepted. Therefore, for the textile knitwear company in 2021, improving the marking and cutting processes using high-quality excess fabric for the production of clothing items and accessories does impact the increase in production.
Testing of Specific Hypothesis 1
Ho: For the textile knitwear company in 2021, improving the marking and cutting processes using high-quality excess fabric for the production of high-quality clothing items and accessories does not significantly impact the utilization of seasonal.
Ha: For the textile knitwear company in 2021, improving the marking and cutting processes using high-quality excess fabric for the production of high-quality clothing items and accessories does significantly impact the utilization of seasonal fabric.
Test Statistic. The test statistic used is Chi-square, assuming a test significance level (α) of 0.05 in contrast to the statistical significance value of the p-value.
Table 13 Chi-Square Test of Specific Hypothesis 1.
| Value | df | Asymptotic Significance (2-sided) | |
|---|---|---|---|
| Pearson Chi-Square | 27.313a | 4 | .000 |
| Likelihood Ratio | 33.888 | 4 | .000 |
| Linear-by-Linear Association | 22.712 | 1 | .000 |
| N of Valid Cases | 43 |
a. 5 cells (55.6%) have expected count less than 5. The minimum expected count is 1.67.
Source: Prepared by the author based on the survey administered to the operators working in the marking and cutting areas.
As shown in Table 13, the Chi-square value was calculated at 27.313, which is greater than the value specified in the table (9.4877). Additionally, the likelihood ratio was found to be p = 0.000, which is less than the threshold value of p < 0.05. These findings indicate that the null hypothesis is rejected and the alternative hypothesis is accepted. Therefore, for the textile knitwear company in 2021, improving the marking and cutting processes using high-quality excess fabric for the production of clothing items and accessories does impact the utilization of seasonal fabric.
Testing of Specific Hypothesis 2
Ho: For the textile knitwear company in 2021, improving the marking and cutting processes using high-quality excess fabric for the production of high-quality clothing items and accessories does not significantly impact the amount of scrap material resulting from the cutting process.
Ha: For the textile knitwear company in 2021, improving the marking and cutting processes using high-quality excess fabric for the production of high-quality clothing items and accessories does significantly impact the amount of scrap material resulting from the cutting process.
Test Statistic. The test statistic used is Chi-square, assuming a test significance level (α) of 0.05 in contrast to the statistical significance value of the p-value.
Table 14 Chi-Square Test of Specific Hypothesis 2.
| Value | df | Asymptotic Significance (2-sided) | |
|---|---|---|---|
| Pearson Chi-Square | 36.185a | 4 | .000 |
| Likelihood Ratio | 33.794 | 4 | .000 |
| Linear-by-Linear Association | 22.869 | 1 | .000 |
| N of Valid Cases | 43 |
a. 5 cells (55.6%) have expected count less than 5. The minimum expected count is 1.49.
Source: Prepared by the author based on the survey administered to the operators working in the marking and cutting areas.
As shown in Table 14, the Chi-square value was calculated at 36.185, which is greater than the value specified in the table (9.4877). Additionally, the likelihood ratio was found to be p = 0.000, which is less than the threshold value of p < 0.05. These findings indicate that the null hypothesis is rejected and the alternative hypothesis is accepted. Therefore, for the textile knitwear company in 2021improving the marking and cutting processes using high-quality excess fabric for the production of clothing items and accessories does impact the amount of scrap material resulting from the cutting process.
DISCUSSION
Regarding the general hypothesis, it was determined that improving the marking and cutting processes using high-quality excess fabric for the production of clothing items and accessories does significantly impact the increase in production for the textile knitwear company in 2021. This was confirmed by the calculated Chi-square value of 52.123, which is greater than the value specified in the table (9.4877). Additionally, the likelihood ratio was found to be p = 0.000, which is a value lower than p < 0.05. These results were further corroborated by Villalba (2019), who indicated that using textile waste can create unique visual effects, where colors, textures, and shapes are mixed to create new garments or accessories. This approach can provide a fresh perspective to the textile industry. Textile companies need to take advantage of the creative potential of their employees to generate new ideas and apply them to product and service creation (Ortiz, 2020). Additionally, textile companies should adopt sustainable practices as part of their production process to significantly reduce textile waste generation (Guerrón, 2019).
On the other hand, some textile companies lack standardized processes, in other words, they do not follow the appropriate procedures, which leads to delays in product delivery, customer complaints, discomfort, and increased waste in the cutting process (Gutiérrez & Vega, 2019). Applying visual management techniques can improve the quality, reliability, and productivity of textile products while also reducing costs due to waste reduction (Gallardo, 2019). To achieve this, patterns should be created with seam allowances incorporated and all the necessary specifications included to simplify production processes (Lavado, 2018).
Regarding specific hypothesis 1, it was determined that improving the marking and cutting processes using high-quality excess fabric for the production of clothing items and accessories does significantly impact the utilization of seasonal fabric for the textile knitwear company in 2021. This was confirmed by the calculated Chi-square value of 27.313, which is greater than the value specified in the table (9.4877). Additionally, the likelihood ratio was found to be p = 0.000, which is a value lower than p < 0.05. These results were further corroborated by Naranjo (2019), who pointed out that the textile industry generates a large amount of waste and fabric leftovers every year, most of which, especially the smaller ones, are thrown away instead of being sold or reused. In Colombia, for instance, over 15,000 tons of textile waste are wasted annually, which negatively impacts the environment. Therefore, there is a need to find ways to make use of this fabric waste and give it a second life. The excess fabric generated during the marking and cutting processes is often stockpiled to manufacture low-value products with a short lifespan, not profitable for textile companies (Gómez et al., 2019). The marking process is the stage where the pattern pieces are laid out on top of the production fabric to be cut in such a way that they occupy the least amount of fabric space (Pumasunta, 2018).
Due to the rise of industrialization and globalization, textile processes have been streamlined to save resources, reduce time, and increase profitability. Technical expertise is essential in patternmaking to ensure that the marking process is carried out properly, and the appropriate patterns are drawn up (Villa, 2020). Before beginning the cutting process, it is crucial to verify that the pieces that will make up the garments are the correct ones to avoid wasting fabric (Gómez, 2019). To achieve streamlined processes, it is important to conduct an inspection in which quality criteria are given priority. This inspection will help reduce the costs associated with reprocessing, defective units, and fabric waste (Arce & Yépez, 2020).
Regarding specific hypothesis 2, it was determined that improving the marking and cutting processes using high-quality excess fabric for the production of clothing items and accessories does significantly impact the amount of scrap material resulting from the cutting process for the textile knitwear company in 2021. This was confirmed by the calculated Chi-square value of 36.185, which is greater than the value specified in the table (9.4877). Additionally, the likelihood ratio was found to be p = 0.000, which is a value lower than p < 0.05. These results are further corroborated by Sifuentes (2019), who stated that using a technical sheet can provide valuable information on costs, waste, maintenance, and losses. These sheets include details on the design, fabric and inputs, pattern and cutting, production, garment measurements, additional processes, and finishing processes. Sánchez and Quea (2020) suggest that various tools, such as VSM, Lean, 5S, Linear Programming, and Redutex, can be used for the preparation of technical sheets. They also propose creating awareness and a culture of no waste, implementing 6S, and encouraging and maintaining change and continuous improvement to reduce waste. Ramírez (2020) notes that some textile companies still use artisanal production processes which result in disorganization, machine failures, lack of training programs, and inadequate use of raw materials, inputs, and equipment. This leads to waste being produced due to the inappropriate use of resources.
CONCLUSIONS
It was concluded that improving the marking and cutting processes using high-quality excess fabric for the production of clothing items and accessories does significantly impact the increase in production for the textile knitwear company in 2021. This was confirmed by the calculated Chi-square value of 52.123, which is greater than the value specified in the table (9.4877). Additionally, the likelihood ratio was found to be p = 0.000, which is a value lower than p < 0.05.
It was concluded that improving the marking and cutting processes using high-quality excess fabric for the production of clothing items and accessories does significantly impact the utilization of seasonal fabric for the textile knitwear company in 2021. This was confirmed by the calculated Chi-square value of 27.313, which is greater than the value specified in the table (9.4877). Additionally, the likelihood ratio was found to be p = 0.000, which is a value lower than p < 0.05.
It was concluded that improving the marking and cutting processes using high-quality excess fabric for the production of clothing items and accessories does significantly impact the amount of scrap material resulting from the cutting process for the textile knitwear company in 2021. This was confirmed by the calculated Chi-square value of 36.185, which is greater than the value specified in the table (9.4877). Additionally, the likelihood ratio was found to be p = 0.000, which is a value lower than p < 0.05.
RECOMMENDATIONS
The company is advised to prepare a proposal for improving the marking and cutting processes. This can be done by using the excess of high-quality fabric to increase the production of additional clothing items and accessories. The proposal should focus on ensuring the correct utilization of seasonal fabric and reducing the amount of scrap material resulting from the cutting process.
The company should implement processes that cater to this new activity, cater to this new activity, while also ensuring the correct utilization of seasonal fabric. The company should also ensure that the materials are cut to appropriate measurements, to avoid excess waste. It is also important to provide adequate training to the personnel responsible for the marking and cutting processes. Additionally, the company must frequently look for ways to optimize processes and activities.
The company should consider presenting a proposal to enhance the marking and cutting processes by using high-quality excess fabric. This can be achieved by modernizing the cutting machines, which will help to reduce the amount of scrap material resulting from the cutting process during the production of additional clothing products and accessories. The modernization of cutting machines can help in achieving this goal. Additionally, it is suggested to work with formal suppliers to source quality products with the appropriate measurements and weight. Furthermore, the implementation of a control area can enable better management of the materials entering the cutting area.
REFERENCIAS
Arce Espinoza, K. L., y Yépez Moreira, R. I. (2020). Construcción de un instrumento para medir los criterios de calidad del proceso de corte de tela para la confección de prendas de vestir. Revista Observatorio de la Economía Latinoamericana. [ Links ]
Bernal Torres, C. A. (2010). Metodología de la investigación: administración, economía, humanidades y ciencias sociales. México D.F., México: Pearson Educación. [ Links ]
Chozo Gonzales, M. I., y Escriba Gutierrez, M. G. (2019). Propuesta de mejora en el proceso de costura de las PYME del sector exportador de confecciones de prendas de vestir de tejido de punto de algodón aplicando herramientas Lean basadas en celdas de manufactura flexible y sistema Pull. (Tesis de grado). Universidad Peruana de Ciencias Aplicadas, Lima. [ Links ]
Fonseca Mendoza, E. A. (2020). Prototipo en tejido plano y aseguramiento de la calidad. (Tesis de grado). Universidad Nacional de Educación Enrique Guzmán y Valle, Lima. [ Links ]
Gallardo Huamaní, A. B. (2019). Análisis y propuesta de mejora del proceso productivo de una empresa de confecciones de prendas femeninas mediante el uso de herramientas de manufactura esbelta y un sistema tecnológico RFID. (Tesis de grado). Pontificia Universidad Católica del Perú, Lima. [ Links ]
Gómez Gómez, J. F., González Madariaga, F. J., y Rossa Sierra, L. A. (2019). Nuevos materiales a partir de residuos textiles: Una perspectiva del diseño industrial. RChD: Creación y pensamiento, 4(7). https://doi.org/10.5354/0719-837X.2019.49872 [ Links ]
Gómez Muñoz, C. I. (2019). Automatización del corte en el sector textil confección. (Proyecto de grado). Universidad EAFIT, Medellín. [ Links ]
Guamán Egas, S. A., Viera Alulema, E. F., Escobar Guanoluisa, T. E., y López Barrionuevo, N. M. (2020). Sistema de patronaje lineal cero residuos: Patrones sostenibles sin mermas pre-consumo. Revista Inclusiones, 8, 52-69. [ Links ]
Guerrón Quiroz, K. D. (2019). Métodos de patronaje cero residuos: Una aproximación a la indumentaria infantil. (Proyecto de Investigación previo a la obtención del título). Universidad Técnica de Ambato, Ambato. [ Links ]
Gutiérrez Arenas, E. A. , y Vega Espinoza, S. L. (2019). Plan de mejora para incrementar la productividad en el área de producción de la empresa Josatex - Chiclayo 2017. (Tesis de grado). Universidad Señor de Sipán, Pimentel. [ Links ]
Hernández Sampieri, R., Fernández Collado, C., y Baptista Lucio, P. (2014). Fundamentos de metodología de la investigación. México D.F., México: McGraw Hill. [ Links ]
Lavado Zavala, M. H. (2018). Patronaje como técnica en el aprendizaje de industria del vestido con estudiantes de secundaria. I.E. Nº 89009. (Tesis de grado). Universidad San Pedro, Chimbote. [ Links ]
Naranjo Bedoya, A. (2019). Categorización de los residuos textiles del denim. (Trabajo de grado). Universidad Pontificia Bolivariana, Medellín. [ Links ]
Ortiz Bolaños, E. F. (2020). Aplicación del Design Thinking al rediseño de procesos productivos. Estudio de caso: Empresa del sector de confección textil en Ecuador. (Tesis de maestría). Universidad Nacional de Colombia, Bogotá. [ Links ]
Paredes Campos, S. (2018). Diseño, patronaje y proceso de confección de pantalones para damas para diferentes ocasiones. (Monografía para optar al título profesional de licenciado). Universidad Nacional de Educación Enrique Guzmán y Valle, Lima. [ Links ]
Posada, C. (13 de julio de 2020). Sector textil debe aprovechar TLC para ganar mercado en EE.UU. La Cámara. https://lacamara.pe/sector-textil-debe-aprovechar-tlc-para-ganar-mercado-en-ee-uu/ [ Links ]
Pumasunta Achote, B. G. (2018). Prototipo de una maquina CNC para imprimir patrones de prendas de vestir. (Trabajo de graduación). Universidad Técnica de Ambato, Ambato. [ Links ]
Ramírez Arana, E. A. (2020). Optimización del área de producción para incrementar la productividad de la empresa de confecciones, Cielybeth, Lima 2018. (Tesis de grado). Universidad César Vallejo, Chiclayo. [ Links ]
Sánchez Lezama, K. F., y Quea Saravia, S. C. (2020). Método ágil y sostenible para implementar 6S en MYPES peruanas de confección textil. (Trabajo de suficiencia profesional). Universidad Peruana de Ciencias Aplicadas, Lima. [ Links ]
Schultz Lajo, T. P. (2017). Propuesta de modelo de éxito para la planificación y control de la producción en las medianas empresas del sector textil rubro confecciones de Lima. (Tesis de grado). Universidad Peruana de Ciencias Aplicadas, Lima. [ Links ]
Sifuentes López, J. M. (2019). Fichas técnicas y su aplicación en el diseño, patronaje y proceso de confección de falda y pantalón forrado para damas en el sistema industrial. (Monografía para optar al título profesional de licenciado). Universidad Nacional de Educación Enrique Guzmán y Valle, Lima. [ Links ]
Vélez Sánchez, M., García Vasco, M. E., y Hincapié Echeverri, L. A. (1996). Patronaje y escalado línea interior y deportiva. SENA Regional Antioquia. https://repositorio.sena.edu.co/handle/11404/4811 [ Links ]
Villa Portilla, M. S. (2020). Método de patronaje simplificado de indumentaria casual masculina. (Proyecto de investigación previo a la obtención del título). Universidad Técnica de Ambato, Ambato. [ Links ]
Villalba Peñafiel, B. E. (2019). Elaboración de bolsos con el uso de remanentes textiles. (Proyecto integrador previo a la obtención del título). Universidad Técnica de Ambato, Ambato. [ Links ]
Received: November 17, 2022; Accepted: April 17, 2023
 Este es un artículo publicado en acceso abierto bajo una licencia Creative Commons
