


Serviços Personalizados
Journal

Artigo
 texto em
  Inglês (pdf)
 Artigo em XML
 Referências do artigo
 Enviar este artigo por email
Indicadores
-
 Citado por SciELO
Links relacionados
-
 Similares em
SciELO
Similares em
SciELO
Compartilhar

 Permalink
Industrial Data
versão impressa ISSN 1560-9146versão On-line ISSN 1810-9993
Ind. data vol.26 no.2 Lima jul./dic. 2023 Epub 20-Dez-2023
http://dx.doi.org/10.15381/idata.v26i2.24038
Production and Management
The Lima Traffic Light Network Operations and Management System

1PhD. Master’s degree in Transportation Engineering. Transport engineer (CIP 71380). Currently working as director at Ingeniería de Transportes del Perú SAC, and adjunct professor at the Graduate School of Universidad Nacional Federico Villarreal (Lima, Peru). E-mail: ftarquino@unfv.edu.pe
The research problem arose from the need to implement a system to remotely manage the traffic operations of the network of traffic lights to reduce vehicular congestion. The procedure involved designing the placement of electronic sensors to track the number of vehicles in the area. This allowed for the testing of different operational strategies for modifying the timing of the traffic light signals. A simulation model was used to test these strategies in seven intersections on Av. Petit Thouars in Lima, between Av. Alejandro Tirado and Av. 28 de Julio. Detectors were installed at the access points of secondary access streets to the main road (Av. Petit Thouars) which yielded cumulative positive results. Alternatives 1 and 2 produced a 59% reduction in queues, thus demonstrating the validity of the general hypothesis.
Keywords: actuated traffic signal timing; vehicular congestion estimation; intelligent systems
INTRODUCTION
This paper represents an academic effort to supplement technical guidelines on the management of traffic light systems that are not included in the Manual on Uniform Traffic Control Devices for Street and Highways of Peru and other Latin American countries. These guidelines serve as the basis for various concepts related to Urban Traffic Engineering.
A traffic control system must accurately reflect a city’s policy goals and objectives. Managing traffic signals is crucial as it directly impacts the quality of the transportation system, which is used by almost everyone, every day. Drivers generally assume that traffic signals work if they display red, yellow, and green lights. However, they are unaware that optimizing intersection signal timing can significantly reduce metrics such as delays, number of stops, fuel consumption, vehicular emissions, and crashes (Federal Highway Administration [FHWA], 2020). Therefore, a traffic signal that does not provide sufficient time for someone to cross a street is likely to cause a bad experience and might discourage walking altogether. Similarly, significant delays may lead to street users violating the traffic signal or taking unsafe risks while entering intersections (National Association of City Transportation Officials [NACTO], 2013, p. 126).
According to economic theory applied to transportation systems, changes in infrastructure service levels are expected to affect demand (Day et al., 2014). Although retiming traffic signal systems has direct benefits for urban road networks, quantifying these benefits in terms of cost reduction and environmental impact can be challenging (Day et al., 2010). For instance, a traffic signal timing project involving 60 intersections in Boston’s Back Bay neighborhood showed cost-benefit improvements equal to 61:1 ($1,205,400 and $1,718,000 per year in Phase 1 and Phase 2 implementation, respectively) (Boston Transportation Department & Howard/Stein-Hudson Associates, Inc., 2010). Improving traffic signal operation is an effort that requires specific expertise, experience, and resources, and it is often underrated in budgeting and staffing levels by many transportation agencies, including those in the United States.
Recalculation and permanent updating of traffic light green phases and allocation is a fundamental and permanent activity of traffic control systems (National Operations Center of Excellence, 2019; National Cooperative Highway Research Program [NCHRP], 2010). Mathematical algorithms in timing optimization models in software designed for urban traffic analysis use data from traffic sensors to adapt traffic light timings to current conditions. This efficient management of engineering in actuated traffic signal timing reduces the need for human3 and financial resources to update the system’s database, while also ensuring smoother traffic displacement over the network (Virginia Center for Transportation Innovation and Research, 2015).
The objective of this research study was to create a technical proposal that incorporates internationally accepted and adopted approaches for the operational management of signalized intersections in Lima. The system is aimed at addressing the excessive traffic congestion that is experienced 16 hours of the day, 7 days a week. The hypothesis was based on the presumption that implementing the proposed system would lead to a reduction of up to 30% in traffic congestion throughout the year.
The Proyecto Especial para la Gestión de Tránsito en Lima Metropolitana [Special Project for Traffic Management in Metropolitan Lima], known as Protránsito, was created in 2016 under the Municipal Authority of Metropolitan Lima. The project manages and plans traffic management comprehensively through the Centralized Traffic Light Network and all its components (Protránsito, n.d.). On the last working day of 2017, the Metropolitan Municipality of Lima signed a contract worth almost 120 million soles for the Proyecto de Adquisición e Implementación y Puesta en Marcha de los Proyectos de Semaforización de la Provincia de Lima [Project for the Acquisition and Implementation and Star-up of Traffic Light Projects of the Province of Lima] through public tender No. 015-2017-CS/MML. This research study is justified based on the fact that the project has been in operation for over four years without any proven success in reducing travel times for Lima. The author has evaluated and tested the hypothesis using information-gathering resources and vehicular simulation tools already available to him; therefore, he has not found any limitations regarding evaluation and testing.
Types of Traffic Signal Control
According to the United States Road Capacity Manual (Transportation Research Board [TRB], 2022), which serves as a source document for Transportation and Traffic Engineering in Peru and Latin America, there are two types of traffic signal controllers used today: pre-timed and actuated controllers.
Pre-timed or fixed-time controllers employ a fixed sequence of operation phases, which generate a repetitive order of the movement session. Each phase has a fixed duration, and the combination of phase sequence and fixed times provides a constant cycle length in seconds.
On the other hand, actuated controllers have a predefined sequence of operation stages where each stage’s start and close depends on whether the phase is in recovery or if a service call has been made through a detector. The green time is determined by the vehicle information obtained from the detector, subject to preset minimum and maximum limits. A call for service from a conflicting vehicular movement is required to terminate an active phase. If no user demand is detected, the operation of a phase can be skipped.
Initial Signal Timing Considerations
Table 1 summarizes the basic information a practitioner might investigate as part of the first three steps of the outcome based process (TRB, 2015).
Table 1 Initial Signal Timing Considerations.4
| Outcome Based Process | Initial Signal Timing Considerations | |
|---|---|---|
| STEP 1 Define the Operating Environment | Multi-Jurisdictional Impacts | Is the system of signal located in multiple jurisdictions? |
| If multiple, is signal timing performance consistent across jurisdictional boundaries? | ||
| Is there an existing agreement in place that defines certain signal timing parameters to establish a consistent system? | ||
| Roadway Classification | How are the roadways classified (major street and minor street)? | |
| Are there specific pedestrian, bicycle, freight, or transit route needs? | ||
| Transportation Network | How closely spaced are the signalized sections? | |
| Is there a reason to consider a network system? | ||
| Is the minor street coordinated? | ||
| Is there a nearby rail (freight or passenger) requiring preemption? | ||
| STEP 2 Identify Users | What is the existing mix of users (e.g., pedestrians, bicycles, light vehicles, heavy vehicles including trucks and transit vehicles, priority vehicles, and rail including freight and passenger)? | |
| Does the mix of users change by time of day? | ||
| STEP 3 Establish User and Movement Priorities | Who are the critical users at the intersection(s)? | |
| Does the critical user change by time of day? | ||
| Does the jurisdiction have any policies related to user priorities? | ||
| What are the critical movements? | ||
Source: Prepared by the author, adapted from TRB (2015), NCHRP Report 812, Exhibit 3-5.
Detection
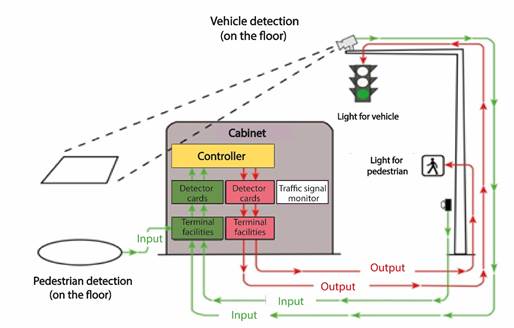
Figure 1 illustrates the flow of inputs and outputs to and from the various pieces of signal equipment at an individual signalized intersection. There are three main categories of signal equipment at an intersection: (1) detection, (2) cabinet equipment, and (3) displays. Detectors sense users and provide the cabinet equipment with information about their presence at an intersection. The cabinet equipment (the controller in particular) interprets the inputs from the detectors and translates them to outputs based on the signal timing plan. The output information is then forwarded to the displays in order to allow users to move through the intersection (TRB, 2015).
Source: Prepared by the author, adapted from TRB (2015), NCHRP Report 812, Exhibit 4-1.
Figure 1 Flow of Inputs and Outputs Among Signal Cabinet Equipment and Displays.
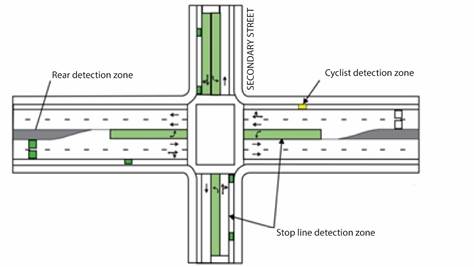
Detection zones can vary based on location issues, the type of detection technology used, and the approach speed. Figure 2 illustrates a basic approach for detection zone placement at the intersection of a major street (shown left/right) and a minor street, low-speed approach (shown top/bottom) (TRB, 2015).
Source: Prepared by the author, adapted from TRB (2015), NCHRP Report 812, Exhibit 4-4.
Figure 2 Basic Detection Design.
Table 2 summarizes the primary objectives for different types of detection.
Table 2 Detection Objectives.
| Type of Detection | Primary Objective(s) |
|---|---|
| High-Speed-Approach Vehicle Detection | Serving the standing queue at the beginning of green |
| Safely terminating the phase once there is a conflicting call | |
| Low-Speed-Approach Vehicle Detection | Calling phases on low-speed approaches |
| Serving the standing queue at the beginning of green | |
| Minimizing delay by reducing calls on permitted movements | |
| Left-Turn-Lane Vehicle Detection | Calling left-turn phases |
| Serving the standing queue at the beginning of green | |
| Minimizing delays by reducing inefficient transitions | |
| Preventing vehicles from being stranded in the intersection | |
| Right-Turn-Lane Vehicle Detection | Minimizing delay by reducing calls due to right-turn-on-red |
| Calling right-turn phases (if used) | |
| Pedestrian Detection | Calling pedestrian phases |
| Bicycle Detection | Calling either associated motorized vehicle phases or independent bicycle phases |
| Preventing accidental motorized actuations if using independent bicycle phases | |
| Eliminating need for bicycles to use pedestrian phases | |
| Emergency Vehicle Detection | Enabling preferential treatment options for emergency vehicles |
| Bus Detection | Enabling preferential treatment options for transit |
| Rail Detection | Ensuring safe and efficient signal timing sequencing before, during, and after train arrivals |
Source: Prepared by the author, adapted from TRB (2015), NCHRP Report 812, Exhibit 4-5.
Phasing Overview
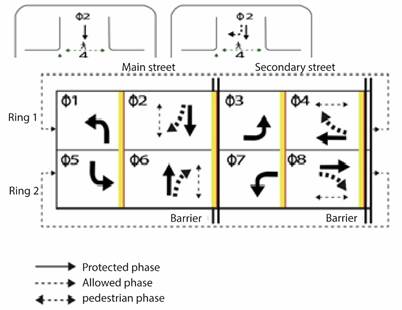
Phasing (Φ s ) represents the fundamental method by which a traffic signal accommodates the various users at an intersection safely and efficiently. Over the years, the description of the individual movements of the dual-ring 8-movement controller as phases has blurred into common communicated terminology of movement number being synonymous with phase number. This is a mistake. Most signal designs and all controllers sold today provide eight standard phases within the signal controller. However, a four-phase intersection is commonly referred to in the literature to represent a standard four-legged intersection with protected left turns on all approaches. A phase is defined as a controller timing unit associated with the control of one or more movements (FHWA, 2008, p. 93).
Two additional terms that are important for improving the use of terminology are movement and interval. A movement reflects the user’s perspective and is defined by the user type and the action that is taken (turning movement for a vehicle or pedestrian crossing). A simple example of the concept of movements is the intersection of one-way streets shown in Figure 3. In this example, the intersection is operated by two phases (2 and 4) and pedestrians are accommodated as concurrent movements to the traffic. Phase 2 will include a through and a right turn movement, while phase 4 will have a through and a left turn movement (appropriate turning movements are omitted from the diagram for simplicity). The right turn on phase 2 must yield to pedestrian traffic crossing the west leg of the intersection. An interval is a duration of time during which the signal indications do not change. For example, a pedestrian phase contains three intervals-Walk, Flashing Don’t Walk, and solid Don’t Walk-and within the Walk and Flashing Don’t Walk intervals, the corresponding through movement will remain green (FHWA, 2008, p. 93).
Source: Prepared by the author, adapted from FHWA (2008), Figures 4-2 and 4-4.
Figure 3 Phasing, Movement, and Ring-and-Barrier Diagram for the Intersection of Two One-Way Streets.
Coordination of Traffic Signals
Coordination, also known as progression, refers to the time at which traffic signals allow a platoon of cars (or other network users such as bicyclists) to travel down a street to reach a succession of green lights and pass through multiple intersections without stopping. A well-coordinated traffic signal system can improve traffic flow, minimize delays, and reduce pollution. Arterial streets and downtown networks are examples of where this can be applied. Several factors influence the decision to use coordination, but the most important consideration for a practitioner is the operating environment, the users, and their priorities.
Coordination should only be used to meet specific objectives, as it may not be appropriate in all situations. While coordination can reduce travel time, stops, delays, and queuing for coordinated movements, which reduces fuel consumption and improves air quality, it can also have negative impacts on uncoordinated operations (FHWA, 2008).
Simple and complex procedures can be used to identify which intersections to coordinate (FHWA, 2005). Typically, it is beneficial to coordinate intersections that are close together (roughly 800 m), especially when the volumes between them are significant. However, if the distance between intersections is greater than 800 m, traffic volumes and potential for platoons should be carefully reviewed to determine if coordination would benefit system operations.
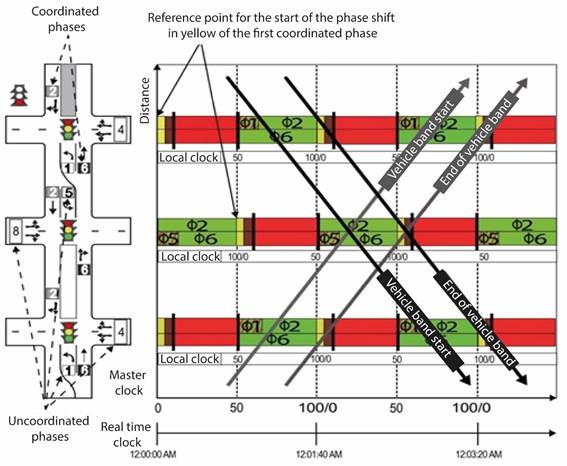
Figure 4 provides a visual representation of the traffic flow through a signalized intersection using a time-space diagram. This diagram plots the ideal vehicle trajectories through a series of traffic-signalized intersections. The intersection locations are shown on the distance axis, and vehicles travel in both directions on a two-way road. The traffic signal timing sequence and traffic signal timing splits for each intersection are plotted along the time axis, which illustrates what motorists will experience as they travel along the arterial streets. Left turns are represented as lines at an angle, operating with a concurrent green in the same direction or not (TRB, 2015).
Source: Prepared by the author, adapted from TRB (2015), NCHRP Report 812, Exhibit 7-1.
Figure 4 Time-Space Diagram of a Coordinated Plan.
METHODOLOGY
The approach of the project involves theoretical groundwork and simulation modeling, which includes prosing sensor placement for traffic signal control strategies in the field. The focus was on measuring the response that actuated control generated on the queue length of the current situation of fixed-time traffic signalization, without implementing such control. The benefits were measured by comparing and evaluating two scenarios: 1) fixed-time traffic signal operation system with existing control schemes and 2) actuated control system with new hardware and software technologies for optimizing existing schemes. Figure 5 illustrates the proposed methodology.
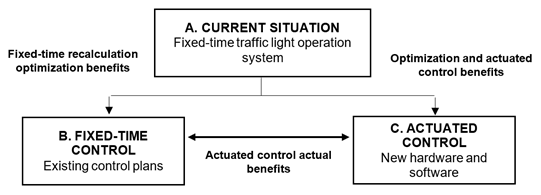
Comparing B versus C provides the true benefits of actuated control of the Traffic Management Center (TMC).
Source: Prepared by the author, adapted from Skabardonis (1996).
Figure 5 Measurement of the Benefits of Actuated Operational Control at Intersections with Traffic Signals.
Simulation Modeling
There is a wide range of computational tools available for modeling the operational conditions of traffic signal systems. However, only a few allow the evaluation of sensor data provided by actuated system control. Aimsun Next was selected for simulating control strategies as it enables the visualization of timing control plan improvements and assessment of actuated control performance.
Calibrating Baseline Conditions
Calibrating a traffic simulation model is crucial to ensure that it reflects the actual behavior of the study area. Therefore, reliable information on the road network, traffic patterns, and multimodal traffic algorithms must be collected.
For the road network, it is essential to gather information on the geometry (profiles, heights, radii, turning movements, and sections), as well as control charts for multimodal speed, turning movements, and traffic lights (phases, times, and lags).
To accurately analyze traffic patterns, it is essential to gather data on the inflow into the study area and the percentage of movements at intersections. Additionally, one must choose dynamic traffic assignment models that allow for route modeling, and calibrate and distribute traffic to balance the road network.
For multimodal traffic algorithms, information on modes, lane changes, gap acceptance, etc. should be collected if the software allows calibration of such behaviors, such as aggressive driver, relaxed driver, rainy situation, etc.
The GEH Calibration Statistic
The GEH statistic (Eq. 01) is used in Traffic Engineering to compare two traffic datasets. It is an empirical formula that has proven to be quite definitive (Beeston et al., 2021). The statistic was named after Geoffrey E. Havers, who developed it in the 1970s when he was working as a transportation planner in London, England. To validate the simulation model, a comparison was made between the field-measured inflow and the model’s inflow. Both are consistent with the parameters described in Table 3.
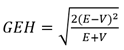 Eq. 01
Where:
GEH = Statistic indicator; E = Modelled flow; and V = Observed flow
Table 3 Description of the Parameters of the GEH statistic.
| GEH | Statistic Indicator |
|---|---|
| < 5.0 | Acceptable variation |
| 5.0 - 10.0 | Research is warranted |
| 10.0 or more | The likelihood of an issue with the model is high |
Source: Prepared by the author, adapted from Beeston et al. (2021), Table 12, Geoffrey E. Havers equation, 1970.
Selection of the Study Area
The reason behind choosing the section of Av. Petit Thouars (between Av. Alejandro Tirado and Av. 28 de Julio) is that a traffic light coordination project was implemented there by the MML in 2010. However, this project did not take into account the calibration of cross street flows and was not developed through a simulation model like the proposed one. Also, it failed to consider the increase in the rate of vehicle traffic, which is typical of any capital city (around 2.5% per year for Lima). Therefore, it is essential to study this proposal which involves modeling five (05) traffic-light controlled intersections and two (02) priority or uncontrolled intersections as shown in Figure 6 and Table 4.
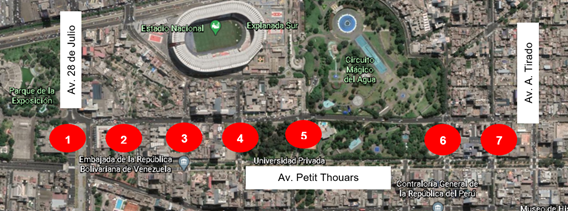
Table 4 Road Network Intersections Analyzed.
| Intersection: Av. Petit Thouars and | Type of Traffic Control |
|---|---|
| Av. 28 de Julio | Traffic Lights |
| Jr. Hernán Velarde | Stop Sign |
| Jr. Manuel Corpancho | Traffic Lights |
| Jr. Saco Oliveros | Traffic Lights |
| Jr. Madre de Dios | Stop Sign |
| Jr. Emilio Fernández | Traffic Lights |
| Av. Alejandro Tirado | Traffic Lights |
Source: Prepared by the author.
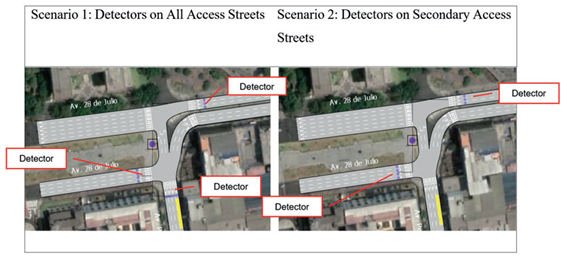
Proposed Analysis Scenarios for Modeling
The five traffic signalized intersections evaluated currently have fixed-time traffic signals, except for the two with stop signs. Two scenarios have been proposed to improve traffic control. The first scenario suggests placing detectors at all the entrances of the five intersections. Each detector will record and transmit the number of vehicles circulating in a given period. The second scenario suggests placing detectors for control only on the cross streets or secondary streets to Av. Petit Thouars. This is to ensure that the current traffic light coordination of the direct movements of this avenue is maintained. Figure 7 provides an example of where the detectors will be located for both proposed scenarios. These proposals will be repeated across the entire network.
RESULTS
Model Validation
The results shown in Table 5 support the validity of the traffic simulation models in all scenarios, given that the GEH indicators are less than 5 (see Table 3) in all access streets analyzed.
Table 5 Calibration Results of the GEH Statistic of the Model in Aimsun Next.
| APPROACH | Current Situation | Scenario 1 | Scenario 2 | ||||||
|---|---|---|---|---|---|---|---|---|---|
| Input Flow (veh/hr) | GEH | Input Flow (veh/hr) | GEH | Input Flow (veh/hr) | GEH | ||||
| Simulation | Actual | Simulation | Actual | Simulation | Actual | ||||
| Av. 28 de Julio (W) | 1223 | 1135 | 2.55 | 1200 | 1136 | 1.87 | 1152 | 1136 | 0.47 |
| Av. 28 de Julio (E) | 1457 | 1357 | 2.60 | 1444 | 1358 | 2.30 | 1328 | 1358 | 0.82 |
| Jr. Hernán Valverde (W) | 16 | 16 | 0.00 | 16 | 16 | 0.00 | 12 | 16 | 1.07 |
| Jr. Hernán Valverde (E) | 52.1 | 53.1 | 0.14 | 52 | 53 | 0.14 | 52 | 53 | 0.14 |
| Jr. Manuel Corpancho | 522 | 538 | 0.74 | 564 | 537 | 1.15 | 504 | 537 | 1.45 |
| Jr. Saco Oliveros (W) | 425 | 374 | 2.54 | 420 | 373 | 2.36 | 396 | 373 | 1.17 |
| Jr. Saco Oliveros (E) | 261 | 314 | 3.14 | 268 | 313 | 2.64 | 276 | 313 | 2.16 |
| Jr. Madre de Dios (W) | 285 | 220 | 4.09 | 284 | 219 | 4.10 | 256 | 219 | 2.40 |
| Jr. Madre de Dios (E) | 190 | 184 | 0.45 | 188 | 182 | 0.44 | 196 | 182 | 1.02 |
| Jr. Emilio Fernández (W) | 209 | 230 | 1.56 | 200 | 231 | 2.11 | 248 | 231 | 1.10 |
| Jr. Emilio Fernández (E) | 205 | 220 | 1.04 | 204 | 219 | 1.03 | 260 | 219 | 2.65 |
| Av. Alejandro Tirado (W) | 417 | 385 | 1.58 | 412 | 384 | 1.40 | 408 | 384 | 1.21 |
| Av. Alejandro Tirado (E) | 445 | 396 | 2.22 | 428 | 398 | 1.48 | 380 | 398 | 0.91 |
| Av. Petit Thouars | 1195 | 1207 | 0.33 | 1216 | 1208 | 0.23 | 1252 | 1208 | 1.25 |
| Average GEH | 1.64 | 1.52 | 1.27 | ||||||
Source: Prepared by the author based on the results of the Aimsun Next simulation model.
Scenario Comparison
In the previous example, we analyzed the intersection of Av. Petit Thouars and Av. 28 de Julio. Figure 8 displays the variations in delays (in seconds) for 15-minute periods, comparing each scenario with the current situation.
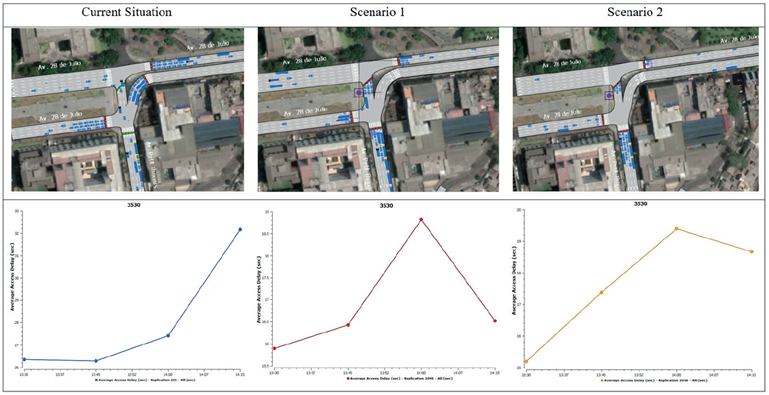
Source: Prepared by the author based on the results of the Aimsun Next simulation model.
Figure 8 Comparison of Average Vehicular Delay (in seconds) at the Intersection of Av. Petit Thouars and Av. 28 de Julio.
Similarly, Table 6 presents the effectiveness measures (MOEs) for vehicular congestion analysis, comparing the current situation with two proposed scenarios.
Table 6 Operational Results of the Modeled Road Network by Scenario Considering the Measures of Effectiveness (MOEs).
| MOEs | Current Situation | Scenario 1 | Scenario 2 | |||
|---|---|---|---|---|---|---|
| Value | σ* | Value | σ* | Value | σ* | |
| Average Queue Length (veh) | 74.00 | NC** | 43.00 | NC** | 52.00 | NC** |
| Stops (veh/km) | 0.10 | NC** | 0.10 | NC** | 0.10 | NC** |
| Delays (s/km) | 99.00 | 95.00 | 64.00 | 60.00 | 66.00 | 51.00 |
| Travel Time (s/km) | 165.00 | 95.00 | 130.00 | 58.00 | 133.00 | 52.00 |
| Speed (km/h) | 29.00 | 16.00 | 32.00 | 12.00 | 31.00 | 12.00 |
* Standard deviation
** No calculation
Source: Prepared by the author based on the results of the Aimsun Next simulation model.
Table 7 demonstrates the difference in MOE indicators between the scenarios. Both scenarios show improvements, but scenario 1 has a higher speed due to the progression of platoon flow on the main road of Av. Petit Thouars compared to scenario 2.
Table 7 Difference in MOEs Between Modeled Scenarios.
| MOEs | Current Situation vs. Scenario 1 | Current Situation vs. Scenario 2 |
|---|---|---|
| Average Queue Length (veh) | −31.00 | −22.00 |
| Stops (veh/km) | 0.00 | 0.00 |
| Delays (s/km) | −33.00 | −31.00 |
| Travel Time (s/km) | −35.00 | −32.00 |
| Speed (km/h) | 3.00 | 2.00 |
Source: Prepared by the author based on the results of the Aimsun Next simulation model.
DISCUSSION
The results of the model show that scenario 1 is better overall, with significant improvements in MOEs. These include a reduction of average queues in the network by approximately 31 vehicles, zero total vehicle stops, a reduction of delays in the road network by approximately 34 s/km/veh, a reduction of travel times by approximately 35 s/km/veh, and an increase of more than 2 km/h for each vehicle circulating in the network. However, the implementation of traffic light coordination on the main road of Av. Petit Thouars, which previously favored motorists on this road, has been lost. This has led to more delays and queues on secondary roads, especially during peak hours.
Based on the findings presented above, it is recommended to develop a proposal for traffic signal coordination that covers a wide area in a network of intersections, grid or mesh, as opposed to the current axis-based system on Av. Petit Thouars. This proposal should balance the benefits to users of secondary streets.
It is important to note that the numerical results of the modeling correspond to one hour of simulation during the most congested hour of the day. Therefore, the benefits and performance of the proposed system over the entire city network could be easily identified by using the methodology presented here. An economic evaluation of the investment required for the implementation of such a system could also be performed. This is important because the benefits for society could be very high, even higher than those observed in North American cities, which exceed US$ 40:1 investment (FHWA, 2005).
CONCLUSIONS
The design of traffic light timing and phasing are key parameters for traffic signal control projects. These projects should be carried out by highly qualified practitioners with expertise in urban traffic control systems. However, this aspect is often neglected in the terms of reference of urban traffic signal control projects in the municipalities of Peru, mainly due to the lack of training of engineers in charge of implementing these projects. It is important to understand that urban traffic signalization projects are not limited to the acquisition of equipment and civil works at an intersection. They require specialized expertise and should be developed accordingly.
To ensure effective control of traffic flow on roads, actuated or adaptive control strategies must have a baseline model calibrated to the current situation. This model will help to analyze the traffic flow arrangement in detail, including its relationship with the traffic signal system conditions such as cycle time, green splits, and coordination offsets with nearby intersections. Any timing changes resulting from actuated control are implemented based on the dynamic traffic variability in the study area.
Predicting the behavior of urban mobility is always a complex task, particularly when implementing technology-intensive systems and services like telecommunications applied to urban traffic control systems. However, Departments of Transportation of countries that have had state-of-the-art traffic light systems in place for years, including broadband wireless communications and radio frequency identification (RFID) systems, are continuously testing new technologies in this field. These technologies are been tested for regular mobility users and people with reduced mobility. The latter group is the most vulnerable when crossing intersections with traffic lights.
REFERENCES
Beeston, L., Blewitt, R., Bulmer, S., y Wilson, J. (Eds.). (2021). Traffic Modelling Guidelines. Version 4.0. Transport for London. [ Links ]
Boston Transportation Department, y Howard/Stein-Hudson Associates, Inc. (2010). The Benefits of Retiming/Rephasing Traffic Signals in the Back Bay. [ Links ]
Day, C. M., Brennan, T. M. Jr., Premachandra, H., Hainen, A. M., Remias, S. M., Sturdevant, J. R., Richards, G., Wasson, J. S. y Bullock, D. M. (2010). Quantifying Benefits of Traffic Signal Retiming. (Report No.: FHWA/IN/JTRP-2010/22). Indiana Department of Transportation. [ Links ]
Day, C. M., Bullock, D. M., Li, H., Remias, S. M., Hainen, A. M., Freije, R. S., Stevens, A. L., Sturdevant. J. R., y Brennan, T. M. (2014). Performance Measures for Traffic Signal Systems: An Outcome-Oriented Approach. West Lafayette, IN, EE. UU.: Purdue University. https://doi.org/10.5703/1288284315333 [ Links ]
Federal Highway Administration. (2005). Signal timing on a shoestring (Publication number. FHWA-HOP-07-006). [ Links ]
Federal Highway Administration. (2008). Traffic Signal Timing Manual (Publication number: FHWA-HOP-08-024). [ Links ]
Federal Highway Administration. (2020). A Methodology and Case Study: Evaluating the Benefits and Costs of Implementing Automated Traffic Signal Performance (Publication number: FHWA-HOP-20-003). [ Links ]
National Association of City Transportation Officials. (2013). Urban Street Design Guide. NY, EE. UU.: Island Press. [ Links ]
National Operations Center of Excellence. (2019). Traffic Signal Benchmarking and State of the Practice Report (December 2019). [ Links ]
National Cooperative Highway Research Program. (2010). Traffic Signal Retiming Practices in the United States. A Synthesis of Highway Practice. (NCHRP Synthesis 409). Transportation Research Board of the National Academies. [ Links ]
Protránsito. (s.f.). Proyecto Especial para la Gestión de Tránsito en Lima Metropolitana. http://protransito.munlima.gob.pe/index.php/es-es/protransito/objetivos [ Links ]
Skabardonis, A. (1996). Determination of Timings in Signal Systems with Traffic-Actuated Controllers. Transportation Research Record, 1554(1), 18-26. https://doi.org/10.1177/0361198196155400103 [ Links ]
Transportation Research Board. (2015). Signal Timing Manual. Second Edition. (NCHRP Report 812). https://transops.s3.amazonaws.com/uploaded_files/Signal%20Timing%20Manual%20812.pdf [ Links ]
Transportation Research Board. (2022). Highway Capacity Manual 7th Edition: A Guide for Multimodal Mobility. Washington D. C., EE. UU.: National Academies Press. [ Links ]
Virginia Center for Transportation Innovation and Research. (2015). Evaluation of the Virginia Department of Transportation Adaptive Signal Control Technology Pilot Project (Report No. VCTIR 15-R24). [ Links ]
2Synchronizing an intersection is simply a matter of assigning times to the traffic light signals, whether or not they are the most appropriate. Optimizing these times is a more advanced synchronization technique that utilizes mathematical algorithms to determine the best times based on traffic demand. Coordination is the term used to describe a sequence of timing and phases between two or more synchronized intersections, which ensure the flow of traffic in the intended direction.
Received: November 17, 2022; Accepted: April 13, 2023; pub: December 20, 2023
 Este es un artículo publicado en acceso abierto bajo una licencia Creative Commons
