


Serviços Personalizados
Journal

Artigo
 texto em
  Inglês (pdf)
 Artigo em XML
 Referências do artigo
 Enviar este artigo por email
Indicadores
-
 Citado por SciELO
Links relacionados
-
 Similares em
SciELO
Similares em
SciELO
Compartilhar

 Permalink
Industrial Data
versão impressa ISSN 1560-9146versão On-line ISSN 1810-9993
Ind. data vol.26 no.2 Lima jul./dic. 2023 Epub 20-Dez-2023
http://dx.doi.org/10.15381/idata.v26i2.25462
Production and Management
Lean Six Sigma and Productivity Improvement in a Metalworking Company’s Mining Equipment Repair Service

1Industrial engineer. Currently working as project planner at metalworking company Recolsa (Lima, Peru). E-mail: chris.im1704@gmail.com
The article discusses a proposal to improve the productivity of a metalworking company by implementing Lean Six Sigma (LSS). The company aims to reduce defects in the repair of heavy machinery components for mining activities. The study describes the simulation process of the original data to propose a limit for the defect level, effectiveness, and efficiency goals to achieve better productivity levels. The DMAIC system stages were used to define the productivity problem in repairing category V components. The original data revealed a Cp of 0.91 and a Cpk of −0.64. The simulation utilized KANBAN and HEINJUNKA tools, resulting in a Cp of 1.09 and a Cpk of 0.95. The study concludes that the LSS methodology is feasible and beneficial for metalworking companies.
Keywords: productivity; Lean Six Sigma; DMAIC; SIPOC; Pareto; capability
INTRODUCTION
The paper presents a case study where the Lean Six Sigma (LSS) methodology, based on the DMAIC principle, was applied to improve the repair processes in a metalworking company. The study aims to enhance the repair services of heavy machinery components used in the mining industry.
The application of this methodology in metalworking companies is a novelty. Proper implementation of the Lean Six Sigma approach can help companies increase their productivity, resulting in higher customer satisfaction since machinery downtime will be reduced and production can proceed smoothly.
The study was conducted in a metalworking company that repairs heavy machinery components used in mining, whose name will not be disclosed due to company policy.
The company is facing low productivity in various areas of the repair processes, including Planning, Welding, Machining, Assembly, and Quality Control. To address this issue, the study proposed implementing a methodology to improve these processes, increase productivity, and minimize defects in the repaired components.
After analyzing data from the 2021 period, it was found that the level of defects reached around 50%, with a sigma level ranging between 2.19 and 2.57. The effectiveness was found to be between 70% to 87%, resulting in a productivity range of 0.77 to 0.85.
This study outlines the stages of the DMAIC system and the tools applied, such as SIPOC, Pareto charts, control charts, capability analysis, and T-pairing.
Finally, recommendations will be made for the use of tools that can help improve productivity and meet the needs of customers. It will also be demonstrated that implementing Lean Six Sigma is feasible.
Objective
Improve the productivity of a metalworking company by reducing defective repairs of heavy machinery components used in mining activities.
Specific Objectives
Improve compliance in the agreed-upon time for repairing heavy machinery components for mining, with a goal of at least 90% compliance.
Reduce the level of non-conforming products (NCP) by a maximum of 25%
Research Question
How to improve productivity in the repair of heavy machinery components with the application of Lean Six Sigma methodology?
Hypothesis
Ho: Applying the Lean Six Sigma methodology in the repair of heavy machinery components, the productivity of 2022 is equal to the productivity in 2021.
Ha: Applying the Lean Six Sigma methodology in the repair of heavy machinery components, the productivity of 2022 is higher than the productivity in 2021.
THEORETICAL FRAMEWORK
The repair time for heavy machinery components is crucial for mining production. The company in question specializes in category V1 components repair, which include chassis, frames, front axles, buckets, and more. The repair process involves the element going through the welding section, where among other things, cracks, lodgings, and seats are repaired, and components are welded. Next, the element passes through the machining area to execute the machining process of the housings to restore standard measurements. After that, the element goes through respective inspections, and finally, it is prepared for assembly (if required). The company needs to improve productivity, which is understood by Bernal (2019) as the product manufactured per resource used for production. It is also known as the ratio of the index of effectiveness over efficiency, i.e., the results obtained per unit of resources used properly.
Efficiency has various definitions depending on different aspects, as stated by Bernal (2019). For instance, in the case of time units, efficiency is the ratio of actual process time to standard process time. In the case of resources, efficiency refers to the proper utilization of resources. Efficiency is also the ratio of dispatched jobs to projected jobs.
On the other hand, effectiveness is the reason for addressing both risks and opportunities that arise in the market (customers). It is also defined as the results achieved that meet the objectives set by organizations (see Table 1).
Table 1 Difference Between Efficiency and Effectiveness.
| Efficiency | Effectiveness |
|---|---|
| Emphasis on means | Emphasis on results |
| Doing things the right way | Doing the right things |
| Solving problems | Achieving objectives |
| Saving resources | Optimize resource utilization |
| Comply with tasks and obligations | Obtain results |
| Train subordinates | Train effective subordinates |
Source: Prepared by the author based on Bernal (2019).
Yield is a crucial metric for assessing the performance of production processes. According to Alvarez (2019), it measures the quality of output by calculating the ratio of units produced without defects to those with defects. In the context of Lean Six Sigma, yield is a key performance indicator (KPI) for process improvement projects. This metric is also used to monitor the effectiveness of improvement processes and project activities.
Olabarrera (2021) argues that Lean Six Sigma is a business strategy that combines the principles of Lean manufacturing and Six Sigma methodologies. The goal of this approach is to optimize process performance and increase customer satisfaction. It focuses on continuous improvement and production volume in organizations. The foundation of Lean Six Sigma is the DMAIC (Define, Measure, Analyze, Improve, and Control) discipline, which aims to reduce production process variability.
Define involves recognizing the main internal and external factors that affect the company.
Measure involves utilizing statistical tools to collect data to analyze production processes.
Analyze involves identifying the root causes of any issues with the system.
Improve involves proposing possible solutions to minimize or eradicate root causes that affect the system.
Control involves establishing a control plan to prevent the reoccurrence of these issues.
The primary objectives of Lean Six Sigma are to eliminate waste, reduce cycle time, and reduce process variability by eliminating activities that do not add value to the product or service. In comparison, the objectives of the benchmark company are to achieve an efficiency greater than 90%, achieve an effectiveness greater than 90%, and reduce the number of defects to 3.4 parts per million.
Figure 1 displays a visual representation of these objectives.
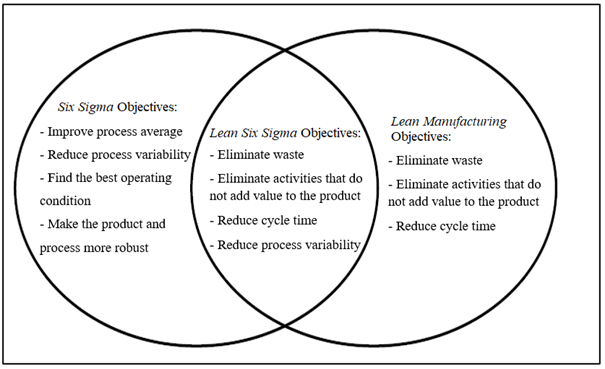
The Lean Six Sigma methodology requires the use of statistical tools such as the Pareto chart, which involves classifying incidences from highest to lowest and minimizing or eradicating them. Another tool is the Kanban board, which allows for job classification based on stages and priorities to effectively program production activities. The HEINJUNKA tool involves setting goals to level production and improve results.
METHODOLOGY
A quantitative approach was adopted in this research to collect data on efficiency, effectiveness, and quality performance from a metalworking company workshop. The data collected will be used in a simulation. The research study is non-experimental and cross-sectional since the data was collected at a single point in time. It is also descriptive as it shows a comparison between the current and simulation results to determine the feasibility of using the Lean Six Sigma methodology.
RESULTS
Stage 1: Define
Results from the study showed that the company has a low level of productivity, which could make it challenging to meet customer requirements. The repair processes of category V components, accounting for 45% of the company’s sales, were the least productive. Additionally, the costs of these repairs were valued at over $50,000 (see Table 2).
Table 2 Repair Costs of Category V Components.
| CHASSIS | FRAME | BUCKET | LOADER | FRONT AXLE | ||
|---|---|---|---|---|---|---|
| Direct Material | 2500 x 2500 x 12.5 mm Steel Sheet | $ 500.00 | $ 800.00 | $ 950.00 | $ 500.00 | $ 400.00 |
| E71 Flux Core | $ 64.30 | $ 130.00 | $ 150.00 | $ 200.00 | $ 100.00 | |
| Welding Rode Supercito E80 1/4" | $ 3,520.00 | $ 210.84 | $ 110.00 | $ 100.00 | $ 90.00 | |
| Welding Rode Tenacito E80 1/4" | $ 0.00 | $ 0.00 | $ 0.00 | $ 70.28 | $ 100.00 | |
| Spare Parts Import | $ 50,000.00 | $ 76,000.00 | $ 50,000.00 | $ 60,000.00 | $ 65,000.00 | |
| Total Direct Material | $ 54,084.30 | $ 77,140.84 | $ 51,210.00 | $ 60,870.28 | $ 65,690.00 | |
| Direct Labor | Welders | $ 2,677.00 | $ 3,355.00 | $ 7,500.00 | $ 2,600.00 | $ 3,900.00 |
| Machine Operators | $ 1,500.00 | $ 1,650.00 | $ 1,754.00 | $ 2,112.00 | $ 1,771.00 | |
| Inspections | $ 576.00 | $ 300.00 | $ 400.00 | $ 492.00 | $ 480.00 | |
| Mechanics | $ 1,150.00 | $ 1,020.00 | $ 1,110.00 | $ 1,200.00 | $ 1,080.00 | |
| Total Labor | $ 5,903.00 | $ 6,325.00 | $ 10,764.00 | $ 6,404.00 | $ 7,231.00 | |
| Repair Cost | $ 59,987.30 | $ 83,465.84 | $ 61,974.00 | $ 67,274.28 | $ 72,921.00 |
Source: Prepared by the author.
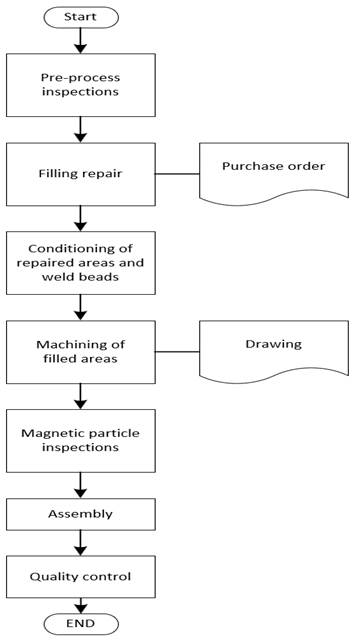
Based on Arcos and Cerda (2019), the low level of productivity in the repair process is due to the non-compliance of repair times and a high rate of defects in the repaired components. The entire repair process is illustrated in Figure 2.
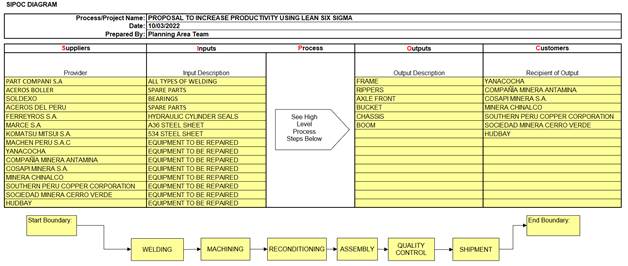
To describe how to repair category V components, the SIPOC tool was used. This tool helps outline the steps involved in repairing components in this category. Suppliers and customers provide materials, inputs, and components to be repaired, as described in the tool and Figure 3 (Canahua, 2020; Castillo, 2021; Corzo & Teccsi, 2019).
Stage 2: Measure
After identifying the problem, the sigma level corresponding to category V components was measured (Alvarez, 2019; Castillo, 2019; Carrillo et al., 2021; Valverde & Reyes, 2021) as shown in Table 3.
Table 3 Sigma Level of Repair of Category V Components - 2021.
| Months | Category V Components | No. NCP | Defects 21 (%) | Opportunity | DPMO | DPO | Yield (NCP) | Sigma Level 21 |
|---|---|---|---|---|---|---|---|---|
| Jan-21 | 15 | 10 | 66.67% | 3 | 222222.222 | 0.22222222 | 77.78% | 2.37 |
| Feb-21 | 20 | 12 | 60.00% | 3 | 200000 | 0.2 | 80.00% | 2.46 |
| Mar-21 | 20 | 14 | 70.00% | 3 | 233333.333 | 0.23333333 | 76.67% | 2.32 |
| May-21 | 10 | 8 | 80.00% | 3 | 266666.667 | 0.26666667 | 73.33% | 2.19 |
| Jun-21 | 25 | 15 | 60.00% | 3 | 200000 | 0.2 | 80.00% | 2.46 |
| Jul-21 | 15 | 9 | 60.00% | 3 | 200000 | 0.2 | 80.00% | 2.46 |
| Sep-21 | 20 | 15 | 75.00% | 3 | 250000 | 0.25 | 75.00% | 2.25 |
| Oct-21 | 25 | 15 | 60.00% | 3 | 200000 | 0.2 | 80.00% | 2.46 |
| Nov-21 | 25 | 13 | 52.00% | 3 | 173333.333 | 0.17333333 | 82.67% | 2.57 |
| Dec-21 | 15 | 9 | 60.00% | 3 | 200000 | 0.2 | 80.00% | 2.46 |
| Total | 190 | 98 | 51.58% | 78.46% |
Source: Prepared by the author.
As shown in Table 3, the sigma level obtained in 2021 ranged from 2.19 to 2.57. The target sigma level was 3.4. Moreover, it is observed that the number of non-conforming products ranged from 8 to 15 units, resulting in defects of 52% to 80% in 2021.
Finally, the productivity of repaired parts in category V was measured using the company’s effectiveness and efficiency indicators, which are shown in Table 4.
Table 4 Total Productivity of Repaired Category V Components.
| Months | Agreed Time (Days) | Actual Time (Days) | Effectiveness 21 | Assigned Man-Hours | Actual Man-hours | Time Efficiency | Productivity 21 |
|---|---|---|---|---|---|---|---|
| Jan-21 | 55 | 70 | 78.57% | 571.45 | 601.45 | 95.01% | 0.82696 |
| Feb-21 | 45 | 60 | 75.00% | 321.00 | 345.00 | 93.04% | 0.80607 |
| Mar-21 | 65 | 75 | 86.67% | 730.56 | 754.56 | 96.82% | 0.89514 |
| May-21 | 35 | 44 | 79.55% | 530.46 | 545.46 | 97.25% | 0.81795 |
| Jun-21 | 35 | 42 | 83.33% | 530.46 | 546.46 | 97.07% | 0.85847 |
| Jul-21 | 25 | 32 | 78.13% | 435.89 | 453.89 | 96.03% | 0.81351 |
| Sep-21 | 35 | 50 | 70.00% | 645.35 | 763.35 | 84.54% | 0.82799 |
| Oct-21 | 45 | 55 | 81.82% | 321.00 | 331.00 | 96.98% | 0.84367 |
| Nov-21 | 65 | 80 | 81.25% | 730.56 | 750.56 | 97.34% | 0.83474 |
| Dec-21 | 25 | 35 | 71.43% | 435.90 | 471.90 | 92.37% | 0.77328 |
| 78.57% | 0.82978 |
Source: Prepared by the author.
The productivity data for the year 2021 is presented in Table 4, and it shows that the effectiveness ranges from 70% to 86.67%. The company’s goal was to achieve 90%, but the current levels are falling short of the target. The efficiency of man-hours ranges from 84.54% to 97.34%, which is also below the target. Therefore, the report concludes that the company is not meeting its productivity goals despite adequate use of man-hours.
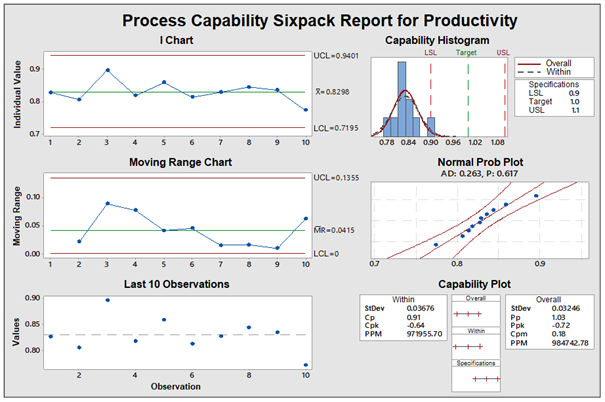
The productivity results were subjected to a number of tests, and the productivity report for the repaired category V components is shown in Figure 4.
Source: Prepared by the author based on Cruz (2019).
Figure 4 Productivity Report of Repaired Category V Components.
As shown in Figure 4, the productivity data was subjected to a normality test, which yielded a p-value of 0.617, higher than 0.05. A control I chart was used to measure the productivity of the category V components, showing it is under statistical control. However, the variability should be reduced. The productivity capability was measured according to the 0.9 and 1.1 limits and a target of 1. The results showed that the productivity was inherently incapable, with a Cp 0.91 and Cpk −0.64, and the productivity was shifted to the left. Thus, it is recommended that the company stabilize and center productivity results to achieve its targets.
Stage 3: Analyze.
During phase 3, the team analyzed the causes of delayed productivity in the repair of category V components.
Pareto charts were used to detect, minimize, or eradicate the root cause(s). Figure 5 shows the productivity report of the repaired items (Guerra, 2019; Pastor, 2018; Chamorro, 2017).
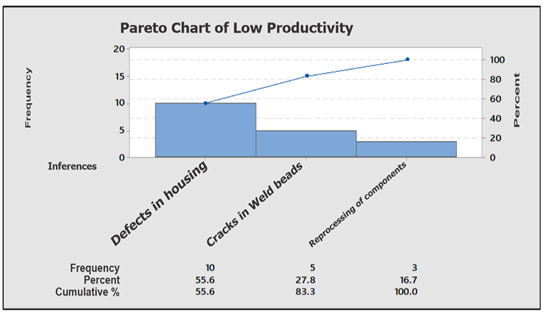
Figure 6 illustrates the application of the 80/20 principle to determine the most frequent occurrences, which were defects in the housings and cracks in weld beads.
The team prioritized the highest incidence, which was “defects in the housings”. Another Pareto diagram was then created to determine the cause of these defects.
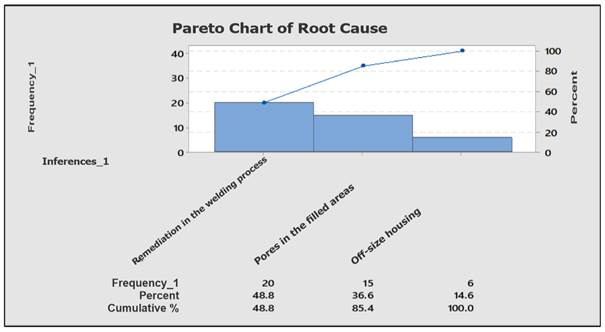
The analysis in Figure 6 revealed welding process correction and pores in the filled areas as the most frequent occurrences.
Priority was given to “welding process correction” due to its high incidence.
Finally, another Pareto diagram was created to determine the diagnostic cause, as shown in Figure 7.
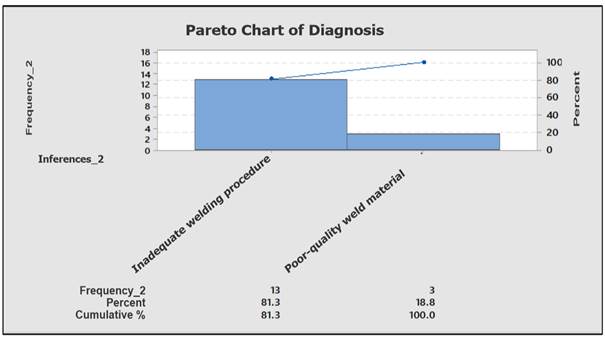
After analyzing the data, the team concluded that the low productivity was due to defects in the housings, which were caused by correcting errors in the welding processes. The main cause of the errors was the inadequate welding procedure.
Stage 4: Implementation (Improve)
To address the issues identified, the following proposals were made in order to minimize the causes of low productivity.
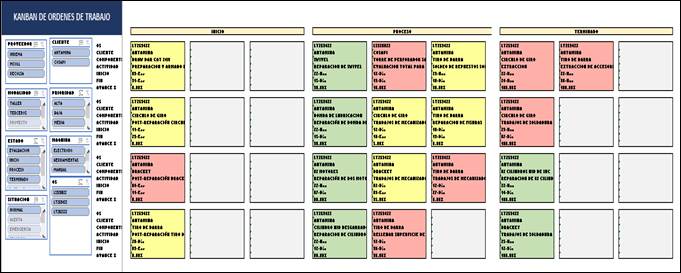
Implementation of KANBAN. This system is used to plan and prioritize repair activities based on the level of urgency (red for high, yellow for medium, and green for low). The Kanban board is shown in Figure 8.
Implementing Heinjunka Tool. This tool is used to level the repair activities according to priority levels. A table of goals, subgoals, and limitations was also created to meet customer expectations, i.e., what can be delivered with the resources available to the company. The objective of implementing the Heinjunka board is to minimize delivery time to customers and to improve communication with them (see Figures 9 and 10).
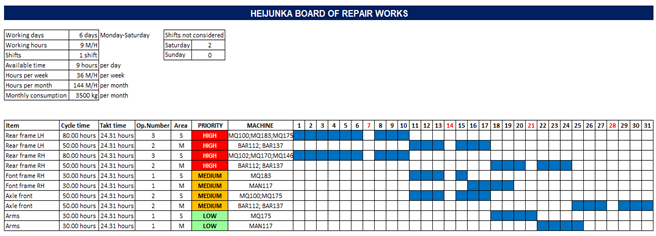
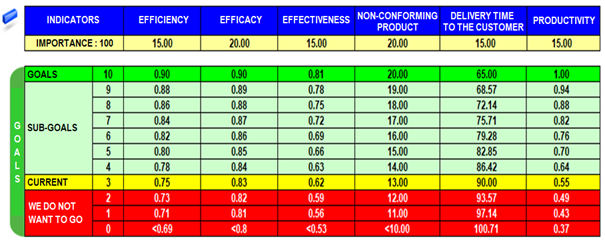
The above table was generated using Heinjunka, based on indicators such as efficiency, effectiveness, nonconforming product, yield, customer delivery time, and productivity.
Implementing a New Welding Procedure. To minimize defects and increase productivity, it is recommended to implement a new welding procedure. The current welding process used by the company under study is SMAW (Shielded Metal Arc Welding), which involves using an electrode to join two metals, also known as coated electrode arc welding process. However, this process has disadvantages such as leaving spatter and porosities that require grinding. An alternative process to consider is the FCAW (Flux Cored Arc Welding) process, which involves welding with gas-shielded flux-cored wire. This process is advantageous as it is tolerant to strong air currents and has a lower cost.
Stage 5: Control Improvement
During this stage, the production area personnel were assigned specific responsibilities.
The planning team was in charge of controlling the production schedule using the Kanban tool. Another team was responsible for implementing Heinjunka, maintaining the equipment, and coordinating with the leaders of the areas involved, such as Machining, Welding, Planning, and Production. Certified welders with extensive experience were assigned to implement the FCAW procedure.
After implementing the improvements in the category V components the results presented in Table 5 were obtained.
Table 5 Possible Sigma Level Results in 2022.
| Months | Category V Components | No. NCP 22 | Defects 22 (%) | Opportunity | DPMO | DPO | Yield (NCP) | Sigma Level 22 |
|---|---|---|---|---|---|---|---|---|
| Jan-22 | 15 | 3 | 20.00% | 3 | 66666.6667 | 0.06666667 | 93.33% | 3.02 |
| Feb-22 | 20 | 5 | 25.00% | 3 | 83333.3333 | 0.08333333 | 91.67% | 2.95 |
| Mar-22 | 20 | 6 | 30.00% | 3 | 100000 | 0.1 | 90.00% | 2.88 |
| May-22 | 10 | 2 | 20.00% | 3 | 66666.6667 | 0.06666667 | 93.33% | 3.02 |
| Jun-22 | 25 | 4 | 16.00% | 3 | 53333.3333 | 0.05333333 | 94.67% | 3.07 |
| Jul-22 | 15 | 3 | 20.00% | 3 | 66666.6667 | 0.06666667 | 93.33% | 3.02 |
| Sep-22 | 20 | 5 | 25.00% | 3 | 83333.3333 | 0.08333333 | 91.67% | 2.95 |
| Oct-22 | 25 | 6 | 24.00% | 3 | 80000 | 0.08 | 92.00% | 2.96 |
| Nov-22 | 25 | 6 | 24.00% | 3 | 80000 | 0.08 | 92.00% | 2.96 |
| Dec-22 | 15 | 5 | 33.33% | 3 | 111111.111 | 0.11111111 | 88.89% | 2.83 |
| Total | 190 | 37 | 19.47% | 91.99% |
Source: Prepared by the author.
As can be seen in the table above, there was an improvement in the sigma level. The table indicates an improvement in the sigma level, ranging from 2.83 to 3.07, bringing us closer to our goal of 3.4. The simulation suggests that reducing non-conforming products by 2 to 6 defects per month will result in an adequate sigma level.
Table 6 shows the possible results of the sigma level.
Table 6 Possible Sigma Level Results in 2022.
| Months | Agreed Time (Days) | Actual Time (Days) | Effectiveness 22 | Assigned Man-Hours | Actual Man-hours | Time Efficiency | Productivity 22 |
|---|---|---|---|---|---|---|---|
| Jan-22 | 55 | 59 | 93.22% | 571.45 | 601.41 | 95.02% | 0.98108 |
| Feb-22 | 45 | 48 | 93.75% | 321.00 | 345.00 | 93.04% | 1.00759 |
| Mar-22 | 65 | 66 | 98.48% | 730.56 | 736.77 | 99.16% | 0.99322 |
| May-22 | 35 | 35 | 100.00% | 530.46 | 544.30 | 97.46% | 1.02609 |
| Jun-22 | 35 | 38 | 92.11% | 530.46 | 545.00 | 97.33% | 0.94630 |
| Jul-22 | 25 | 27 | 92.59% | 435.89 | 456.80 | 95.42% | 0.97034 |
| Sep-22 | 35 | 36 | 97.22% | 645.35 | 655.90 | 98.39% | 0.98812 |
| Oct-22 | 45 | 45 | 100.00% | 321.00 | 330.00 | 97.27% | 1.02804 |
| Nov-22 | 65 | 68 | 95.59% | 730.56 | 735.78 | 99.29% | 0.96271 |
| Dec-22 | 25 | 26 | 96.15% | 435.90 | 440.89 | 98.87% | 0.97255 |
| 95.91% | 97.13% | 0.98760 |
Source: Prepared by the author.
The data presented in Table 5 indicates that maintaining a productivity level between 0.94630 and 1.02804 requires an average compliance of at least 95% and a monthly efficiency of 97%, achieved through proper resource utilization.
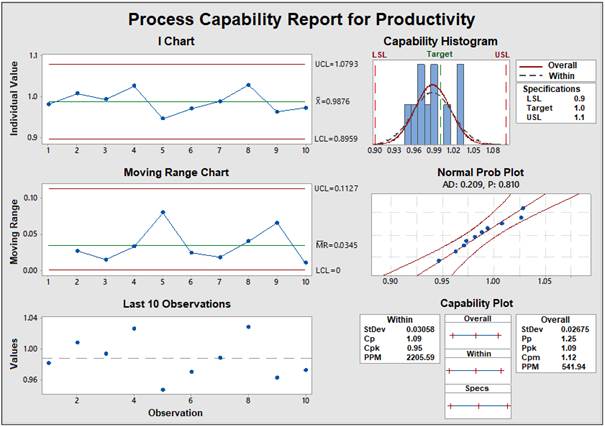
Figure 11 shows the possible productivity results obtained.
Source: Prepared by the author based on improved data.
Figure 11 Possible Capability Results Report.
Figure 11 shows the improved productivity results obtained, displaying a normal distribution with a p-value of 0.81, which is higher than 0.05 in Graph I, indicating that the monthly productivity indicators are under statistical control. However, decreasing variability is recommended. The capability indicators Cp and Cpk yielded possible results of 1.09 and 0.95 respectively, indicating that the productivity level is inherently capable, but centering is recommended.
After applying the Lean Six Sigma methodology in a simulation, productivity improvements were obtained.
The hypotheses analysis was carried out.
Ho: The productivity of 2022 is equal to the productivity of 2021 when the Lean Six Sigma methodology is applied in repairing heavy machinery components.
Ha: The productivity of 2022 is higher than the productivity of 2021 when the Lean Six Sigma methodology is applied in repairing heavy machinery components.
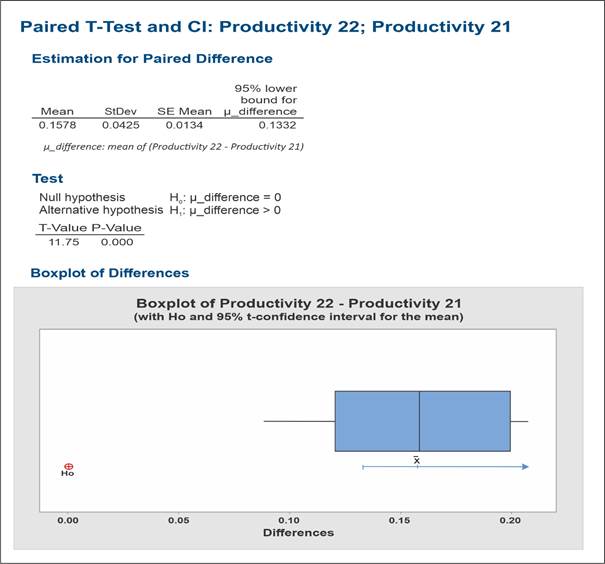
In Figure 12, a paired t-test was conducted to determine whether the implementation of Lean Six Sigma had improved productivity in the repair of heavy machinery components.
The report indicates that the p-value is 0.000, which is less than 0.05. Therefore, the null hypothesis is rejected, and it is concluded that the application of the LSS methodology is feasible and leads to improved productivity.
DISCUSSION
The improvements that would be obtained by applying the Lean Six Sigma methodology considering the critical business parameters are shown in Table 7.
Table 7 Table of Improvement Indicators for 2021 and 2022.
| Parameter | 2021 | 2022 | Observations |
|---|---|---|---|
| Effectiveness | 78.57% | 95.91% | Improvement in delivery time |
| Non-Conforming Product Rate | 51.68% | 19.47% | Improvement in repair process |
| Man-Hours Efficiency | 84.54% - 97.34% | 93.04% - 99.29% | Efficiency range |
| Productivity | 0.82978 | 0.98760 | Repair of mining machinery components |
| Welding Process | SMAW | FCAW | Improvement in welding process |
Source: Prepared by the author.
The implementation of the LSS methodology resulted in remarkable improvements, particularly in the parameters that generate more revenue and reduce costs for the company.
The best results were obtained in the effectiveness parameter, which rose from 79% to 96%, efficiency, which increased from 97.34% to 99.29%, and non-conforming product index, which decreased from 51.68% to 19.47% in comparison to the previous year. Consequently, productivity increased from 0.82978 to 0.98760, enhancing customer perception and the company’s profitability. The company also improved the welding processes by replacing the SMAW welding process with FCAW, which will result in an overall improvement in the company's total production.
CONCLUSIONS
The simulation in this study demonstrates the advantages of implementing Lean Six Sigma in repair processes. This, along with other tools, significantly improves productivity. Therefore, it can be stated that its application is valid for any industrial repair service company.
Metalworking companies can become more competitive by correctly implementing the Lean Six Sigma methodology.
The use of Lean Six Sigma methodology leads to productivity improvement in heavy machinery component repair processes, enhancing effectiveness and reducing non-conforming products.
Lean Six Sigma methodology is combined with tools such as KANBAN to improve scheduling and work classification, and Heinjunka, to level production or repair of category V heavy machinery components.
Using Lean Six Sigma methodology reduces the rate of non-conforming products by avoiding delays in repairs.
Lean Six Sigma methodology improves the rate of compliance or effectiveness in different plant areas.
Improved productivity indicators lead to improved customer satisfaction.
Sharing successful experiences of the Lean Six Sigma methodology through publications can have a multiplier effect.
ACKNOWLEDGMENT
I would like to express my gratitude to the metalworking company under study for sharing their knowledge of the repair processes and applying the methodology. Also, I would like to thank the work team for their support and commitment.
REFERENCES
Arcos Cerda, V. A., y Baño Correa, J. D. (2019). Aplicación de Lean Six Sigma en una Empresa Gráfica Ecuatoriana: reducción de desperdicios en la fabricación de libros. (Tesis de maestría). Universidad San Francisco de Quito, Quito. [ Links ]
Álvarez, J. (2019). Metodología para la predicción del YIELD de manufactura. (Tesis de maestría). Centro de Investigación CIATEQ, Zapopan. [ Links ]
Bernal Valladares, C. E. (2019). Metodología Dmaic y productividad del proceso de distribución de combustibles líquidos en una estación distribuidora Pecsa en el año 2018. (Tesis de maestría). Universidad Nacional José Faustino Sánchez Carrión, Huacho. [ Links ]
Calderón Carrillo, J. I. (2020). Implementación de la metodología Lean Six Sigma para mejorar la productividad en una empresa de plásticos. (Tesis de maestría). Universidad Ricardo Palma, Lima. [ Links ]
Canahua Apaza, N. M. (2020). Propuesta de mejora en el área de producción en una empresa metalmecánica utilizando Lean Six Sigma. (Trabajo de suficiencia profesional). Universidad Peruana de Ciencias Aplicadas, Lima. [ Links ]
Castillo Niquen, M. A. (2021). Implementación de la metodología Lean Six Sigma para reducir los costos de producción en el proceso de fabricacion de transformadores de baja tensión en la empresa NIUSA S.A.C. (Trabajo de suficiencia profesional). Universidad Tecnológica del Perú, Lima. [ Links ]
Castillo, J. (2019). Propuesta de mejoramiento del sistema productivo en carnes frías rieti utilizando metodología LEAN SIX SIGMA. (Tesis de maestría). Universidad de Santiago de Cali, Santiago de Cali. [ Links ]
Carrillo, M. S., Peralta, J. T., Severiche, C. A., Ortega V. P., y Vargas L. E. (2021). Reducción de ruido industrial en un proceso productivo metalmecánico: Aplicación de la metodología DMAIC de Lean Seis Sigma. Entre Ciencia e Ingeniería, 15(30) 41-48. https://doi.org/10.31908/19098367.1819 [ Links ]
Chamorro Pongo, C. (2017). Implementación de la metodología Lean Six Sigma en el área de logística de la unidad de gestión educativa local Surcubamba Huancavelica año 2017. (Tesis de grado). Universidad Peruana los Andes, Huancayo. [ Links ]
Corzo Méndez, E. S., y Teccsi León, M. B. (2019). Aplicación del LEAN SIX SIGMA para la optimización del proceso de distribución de la corporacion LINDLEY S.A. en el mercado de productores. (Tesis de grado). Universidad Ricardo Palma, Lima. [ Links ]
Cruz Ccahuana, J. (2019). Optimización del proceso de perforación primaria con el método Lean Six Sigma en la Unidad Minera Antapacay. (Tesis de grado). Universidad Nacional del Altiplano, Puno. [ Links ]
Guerra Silva, M. A. (2019). Mejora de procesos mediante metodología Lean Six Sigma (Yelow Belt) aplicada a una línea de manufactura de amortiguadores electromagnéticos. (Tesis de grado). Universidad Nacional Autónoma de México. Ciudad de México. [ Links ]
Olabarrera Sifuentes, J. (2021). Aplicación del Lean Six Sigma en el proceso de mecanizado en la empresa FUNVESA para mejorar los plazos de entrega. (Tesis de grado). Universidad Tecnológica del Perú, Lima. [ Links ]
Pastor Ravines, L. F. (2018). Propuesta de mejora del proceso de producción aplicando la metodología Six Sigma para reducir defectos en la empresa RMB SATECI S.A.C. (Tesis de grado). Universidad Privada del Norte, Cajamarca. [ Links ]
Valverde, E. y Reyes, J. (2021). Implementación de propuesta de la mejora del área de envasado de medicamentos líquidos no estériles mediante la aplicación de la metodología Lean Six Sigma para el aumento de eficiencia general de equipos (OEE). (Tesis de grado). Universidad Nacional Mayor de San Marcos, Lima. [ Links ]
Received: June 08, 2023; Accepted: August 11, 2023; pub: December 20, 2023
 Este es un artículo publicado en acceso abierto bajo una licencia Creative Commons
