


Serviços Personalizados
Journal

Artigo
 texto em
  Inglês (pdf)
 Artigo em XML
 Referências do artigo
 Enviar este artigo por email
Indicadores
-
 Citado por SciELO
Links relacionados
-
 Similares em
SciELO
Similares em
SciELO
Compartilhar

 Permalink
Industrial Data
versão impressa ISSN 1560-9146versão On-line ISSN 1810-9993
Ind. data vol.26 no.2 Lima jul./dic. 2023 Epub 20-Dez-2023
http://dx.doi.org/10.15381/idata.v26i2.25579
Production and Management
Comparative Analysis of Onsite and Online Testing at Universidad Nacional Mayor de San Marcos

1Degree in Industrial Engineering. Currently working full-time as a professor at the Industrial Engineering School at UNMSM (Lima, Peru). E-mail: jpereyras@unmsm.edu.pe
2Degree in Industrial Engineering. Currently working full-time as a professor at the Industrial Engineering School at UNMSM (Lima, Peru). E-mail: orojasl@unmsm.edu.pe
3PhD in Industrial Engineering. Currently working full-time as a professor at the Industrial Engineering School at UNMSM (Lima, Peru). E-mail: ealvarezd@unmsm.edu.pe
The research shows the analysis of the means and standard deviations of the scores obtained in the last eight tests at the Centro Preuniversitario (Cram School) of the Universidad Nacional Mayor de San Marcos (UNMSM) of Peru taken onsite, before the COVID-19 pandemic, versus the eight subsequent tests during the pandemic, after the digitalization of admission processes. The result of this analysis establishes that the digitalization of the process did not cause any significant difference in the results of the onsite and online processes. The results showed that, in the absence of these differences, it is thought that the process was adequately digitalized since the behavior of the online and onsite test scores were similar.
Keywords: Process digitalization; university admission tests; onsite processes; online tests; cram school; mean; standard deviation
INTRODUCTION
The COVID-19 pandemic paralyzed many activities and the Universidad Nacional Mayor de San Marcos (UNMSM) was no stranger to compliance with the restrictions of mandatory social isolation that paralyzed the admission test and all forms of admission, so it became necessary and almost mandatory to have the processes digitalized. The option of taking the test onsite, despite taking all health and safety precautions, was not sufficient. In addition, the agglomeration of more than 8000 people would be inevitable and contagion would occur despite sanitary measures. The Centro Preuniversitario grants a number of vacancies according to the score obtained in four tests taken by the applicants. Vacancies are different and depend on each school; however, it is the scores that determine the final result of the process. This research addresses the analysis of the scores obtained at the Centro Preuniversitario in the onsite tests and compares them with scores obtained from online testing This contribution is relevant because it provides valuable information on the effectiveness of the digitalization of university admission processes in times of crisis, as well as the implications this may have on the selection of applicants. In addition, the novelty of this approach lies in the specific analysis of scores and their comparison, which may help future decisions and improvements in admission and academic evaluation processes in similar situations.
Importance
The comparative study comprises two onsite processes and two online processes. It is expected that there are no significant differences, but if this is the case, the differences should mean an improvement, and not a decline, in scores
The importance of the Centro Preuniversitario for applicants is that it represents a modality of admission to UNMSM according to article 8 which indicates that el postulante por esta modalidad es quien alcanzó vacante en el cuadro de méritos del Centro Preuniversitario de la UNMSM [the applicant for this modality is the one who reached a vacancy in the merit list of the Centro Preuniversitario UNMSM] (Oficina Central de Admisión, 2020). Likewise, at present, seven out of ten students prefer to study in cram schools considering that the education received at school is not sufficient for university admission (Cabrera & Portugal, 2021).
Background
Work related to the need for the use of digitalization in teaching was reviewed as well as works of diverse approaches when assessing results of both modalities. These reviews covered works conducted well before the unexpected arrival of COVID-19, during the pandemic, and those that include current developments after the lifting of mandatory confinement.
Online education has been studied for some years. Rosales et al. (2008) compare the performance of medical students in two contexts: onsite and hybrid (combining onsite and online education). The authors conclude that the hybrid modality favors better learning.
On the other hand, Valencia (2014) investigates, in her doctoral thesis, ICT competencies in the onsite and online modalities of the School of Accounting and Administration at the Universidad Autónoma de Chihuahua. The main objective of the study was to comparatively analyze the academic performance of students in both modalities using grades at the end of the semester to make comparisons by gender and educational modality. One of the conclusions of the study indicates that no statistically significant differences were found in subjective and objective academic performance by gender and modality. This study also analyzes scores in two different modalities.
In the research by Sánchez et al. (2022) on student performance in a hybrid onsite and online learning environment, it was concluded that the grades of students, who had three different evaluations during the partially online teaching, were not negatively affected. Likewise, no significant differences were found in the final grade of the course when compared to the face-to-face scenario. Overall, the research indicates that student performance was not negatively affected when the partially online modality was employed.
The pandemic has had effects that are being studied, as mentioned by Casiano et al. (2022) in their study to determine the impact on the performance of UNTRM-A students. The authors compare two scenarios, pre-COVID-19 and post-COVID-19, and conclude that there was a significant increase in academic performance.
General Hypothesis
There are significant differences between the results of the onsite tests and the results of the online tests in 2019-2020 at the Centro Preuniversitario UNMSM.
Specific Hypotheses
There is a significant difference between the averages of onsite tests and online tests in 2019-2020 at Centro Preuniversitario UNMSM.
There is a significant difference between the deviation standards of onsite tests and online tests in 2019-2020 at Centro Preuniversitario UNMSM.
Justification
The pandemic accelerated many changes that were already in process, as shown in the different studies before COVID-19. Education took the opportunity to implement the virtualization of many processes: an online admission test may have been contemplated, but not implemented. Therefore, of all the negative situations that may occur, it is always necessary to focus on the positive that can be obtained. Analysis comparing pre-pandemic and post-pandemic times will continue to be interesting topics of research. There is no final or categorical conclusion, but there are findings framed in different realities.
Limitations
The study covers the exact period of one year before the beginning of the pandemic and one year after, when the processes were digitalized. This period and this admission modality are taken into consideration because they provide a significant amount of information. The Centro Preuniversitario requires four cumulative tests for this modality and this process is carried out twice a year. This helps to obtain eight representative measures before the pandemic (onsite) and eight representative measures after the digitalization of the process.
Digitalization
Without expecting to face a pandemic, Chan (2016) presents an approach to the field of knowledge on the digitalization of higher education in Latin America and reflects on the convergence between an educational innovation management paradigm and an ecological paradigm on ICT, based on the analysis of prospective results.
Digitalization was accelerated by the pandemic, as pointed out by Yong et al. (2017), who analyzed the evolution of distance education and the challenges this represents for educational institutions in the face of the growing demand for e-learning programs in Colombia, Latin America and the world.
In contexts of pandemic and knowledge society, online education and the use of Information and Communication Technologies (ICT) have become essential nowadays, as pointed out by Huanca et al. (2020).
Vilela et al. (2021) mention that the digitalization of education provoked changes, some of which were forced and poorly planned; however, they also represented an opportunity for the implementation of learning platforms and technologies.
The digitalization applied in the admission tests was necessary based on the affirmations of Grande de Prado et al. (2021), who emphasize that although technology is a powerful tool, it also requires adequate planning even in emergency situations.
Future of the Digitalization
Gonzales and Evaristo (2021) suggest that although the health crisis propelled digitalization in higher education, it is important to conduct studies to verify that there are no differences in academic performance between educational modalities.
It is important what Torres-Cuevas et al. (2021) mentioned, as they emphasize that online classes and the application of new methodologies of educational innovation show better results in the acquisition of knowledge.
Comparison of Results
When comparing the overall scores of a subject, López and Molina (2021) conclude that the forced change to the online modality has not had significant differences. They further intend to contrast these results with samples collected in other subjects and/or with different result measures in the future.
In the university studied, the tools used have facilitated the transition from traditional teaching and evaluation to the online modality. Thus, it is shown that most of the evaluation criteria do not present significant differences in the results of the scores. Although the data in this study are limited to a specific subject and institution, the findings can be generalized to other Spanish subjects and universities. In fact, similarities have been observed in most schools of the university in study and it is likely that future research in Spanish universities will report similar results.
Statistics Use
Hernández et al. (2014) indicate that descriptive studies seek to specify important characteristics and properties of any phenomenon being analyzed. Likewise, these studies describe the trend of a population or group. The authors indicate that the entire population can be studied when the studies are longitudinal, but, when asked if everything should be worked with samples, they indicate that this is not always the case. The entire population should only be included when a census is desired. In this study, population is used.
On the other hand, Aguilar (2005) points out that in health research it is necessary to carry out representative sampling due to the difficulty of studying the entire population. In addition, the author indicates that there are at least four reasons for studying samples instead of populations:
It is faster to study a sample than a population.
It is cheaper to study a sample than to study a population.
It is impossible to study populations in most situations.
Results derived from populations are not as accurate as results from a sample. This is because of several factors such as the quality of the data obtained, the degree of knowledge in data collection, the estimation of the error in the resulting parameters, as well as the homogeneity of the samples.
However, the author also warns against erroneous assertions with the use of confidence levels in sample means since the distribution of sample means does not focus on the particular sample mean, but on the population mean.
Regarding the use of grade averages, Alegre de la Rosa and Villar (2017) employ mixed methods and quantitative analyses as statistical controls for their studies, including percentage averages for different fields of knowledge.
Gonzales and Evaristo (2021) also use the final average for their evaluations and conclude that no significant statistical differences are observed.
METHODOLOGY
This study is a descriptive analysis that uses different populations, so it is not necessary to calculate any sample; the unit of analysis is the score obtained by each of the participants. There are four populations: two of them belong to the onsite admission process and the other two to the online admission process. Two representative measures of these populations were used: the mean and the standard deviation.
The process is the following:
Obtain the summary of the scores and concentrate them in histograms.
Obtain the data of the four tests taken during the 2019-I period and the four tests taken during the 2019-II period at the Centro Preuniversitario, which were performed onsite.
Obtain the data of the four tests taken during the 2020-I period and the four tests taken during the 2020-II period at the Centro Preuniversitario, which were performed online.
Adjust the data of each test to compare averages and standard deviations, since each test has different weights.
Extract the averages of each test for each period, from which eight onsite averages and eight online averages will be obtained.
Determine the standard deviation of the population of each test, obtaining eight representative values for onsite tests and eight representative values for online tests.
Determine if the values meet the normality test with the Shapiro-Wilks method.
Determine whether the values have equal or unequal variances.
Apply the t-Student statistic to obtain conclusions.
RESULTS
The results of the methodology used are presented in the following seven sections:
Score summary
The summary of scores is concentrated in the histograms of 16 tests. Figure 1 shows the four histograms elaborated with Minitab, which correspond to the grades obtained by the participants in these tests.
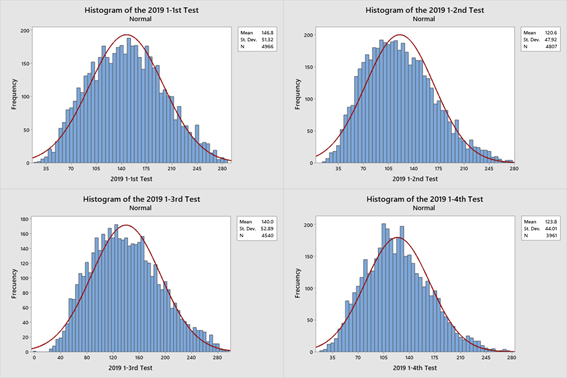
Source: Prepared by the author with data from the 2019-I tests.
Figure 1 Histograms of the Results of the First Period (2019-I) of the Centro Preuniversitario.
Figure 2 shows the histograms of the four onsite tests of the 2019-II period.
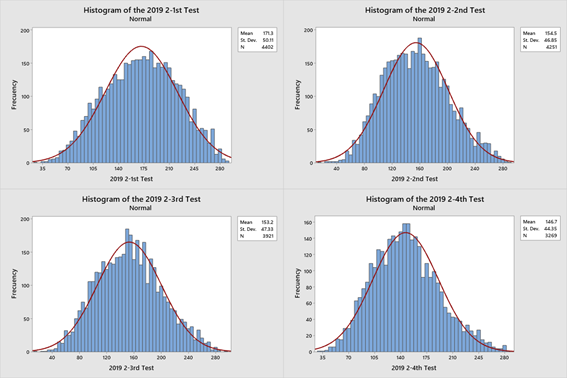
Source: Prepared by the author using Minitab.
Figure 2 Histograms of the Results of the Second Period (2019-II) of the Centro Preuniversitario.
Figure 3 shows the histograms of the online tests.
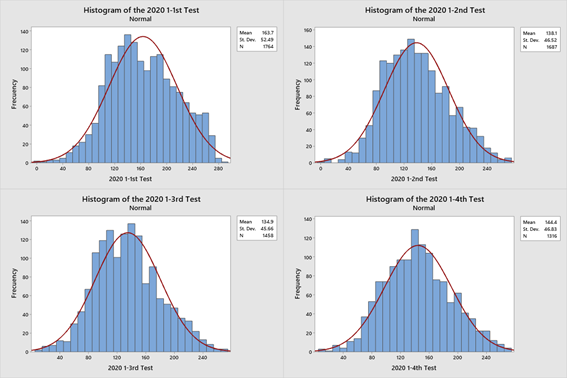
Source: Prepared by the author using Minitab.
Figure 3 Histograms of the Results of the First Period (2020-I) of the Centro Preuniversitario.
Figure 4 shows the histograms of the results of the 2020-II period of the Centro Preuniversitario.
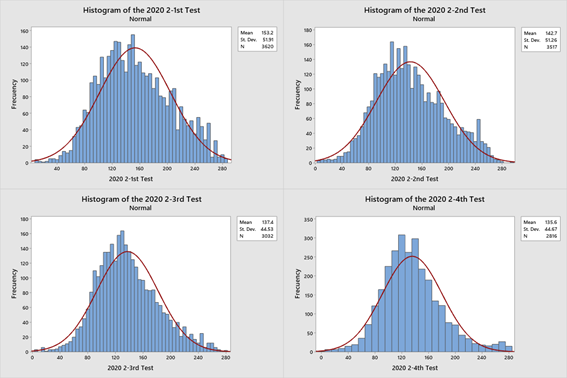
Source: Prepared by the author using Minitab.
Figure 4 Histograms of the Results of the Second Period (2020-II) of the Centro Preuniversitario.
Online tests data
Table 1 shows the population data in each test in 2019, before COVID-19.
Table 1 Number of Participants in each Onsite Process - 2019.
| Concept | 2019-I | 2019-II | ||||||
|---|---|---|---|---|---|---|---|---|
| Test | 1st | 2nd | 3rd | 4th | 1st | 2nd | 3rd | 4th |
| Number of Participants | 4966 | 4807 | 4540 | 3961 | 4402 | 4251 | 3921 | 3269 |
Source: Prepared by the author with data from Figures 1 and 2.
Onsite tests data
Table 2 shows the population data in each test in 2020, after the digitalization of the processes, after COVID-19.
Table 2 Number of Participants in each Online Process - 2020.
| Concept | 2020-I | 2020-II | ||||||
|---|---|---|---|---|---|---|---|---|
| Test | 1st | 2nd | 3rd | 4th | 1st | 2nd | 3rd | 4th |
| Number of Participants | 1764 | 1687 | 1458 | 1316 | 3620 | 3517 | 3032 | 2816 |
Source: Prepared by the author with data from Figures 3 and 4.
Data adjustment
The tests have the same duration (3 hours) and number of questions (100) but vary in terms of weight in the grades depending on the order. The first test has a maximum score of 300 points, the second test has a maximum score of 400 points, the third test has a score of 500 points, and the last test, which is of higher value, reaches 800 points.
In order to compare the results, it is necessary to apply an adjustment taking all the tests to a score of 300. Thus, the results of the first test are not adjusted; those of the second test are multiplied by 300 and divided by 400; those of the third test are multiplied by 300 and divided by 500; and those of the last test are multiplied by 300 and divided by 800. This way, all values can be compared.
Extract onsite and online averages
Table 3 shows the values of the averages, which are shown in Figures 1, 2, 3, and 4.
Table 3 Average of the Grades in 2019 and 2020 tests.
| Period | Type of Test | 2019 Averages Onsite | 2020 Averages Online |
|---|---|---|---|
| First Period | 1st test | 146.77 | 163.68 |
| 2nd test | 120.59 | 138.10 | |
| 3rd test | 139.96 | 134.90 | |
| 4th test | 123.84 | 144.42 | |
| Second Period | 1st test | 171.28 | 153.20 |
| 2nd test | 154.50 | 142.71 | |
| 3rd test | 153.25 | 137.44 | |
| 4th test | 146.66 | 135.61 |
Source: Prepared by the author with data from Figures 1, 2, 3, and 4.
Determine the standard deviation of the population of onsite and online tests.
Table 4 shows the deviations calculated from the population and not from a sample, which is why they differ in tenths from those shown in Figures 1, 2, 3, and 4.
Table 4 Standard Deviation of the Grades in 2019 and 2020 Tests.
| Period | Type of Test | Standard Deviation 2019 | Standard Deviation 2020 |
|---|---|---|---|
| First Period | 1st test | 51.31 | 52.47 |
| 2nd test | 47.91 | 46.50 | |
| 3rd test | 52.89 | 45.64 | |
| 4th test | 44.01 | 46.81 | |
| Second Period | 1st test | 50.10 | 51.90 |
| 2nd test | 46.84 | 51.24 | |
| 3rd test | 47.32 | 44.52 | |
| 4th test | 44.34 | 44.66 |
Source: Prepared by the author with data from all the tests.
Determine normality with the Shapiro-Wilks test, verify variances, and apply the t-Student statistic to obtain conclusions.
The general hypothesis is demonstrated through its two specific hypotheses:
Specific hypothesis 1: There is a significant difference between the averages of onsite tests and online tests in 2019-2020 at Centro Preuniversitario UNMSM.
The normality of the data for the averages of the onsite tests are shown in Figure 5, elaborated with Minitab, where it can be seen that the p-value is greater than 0.10.
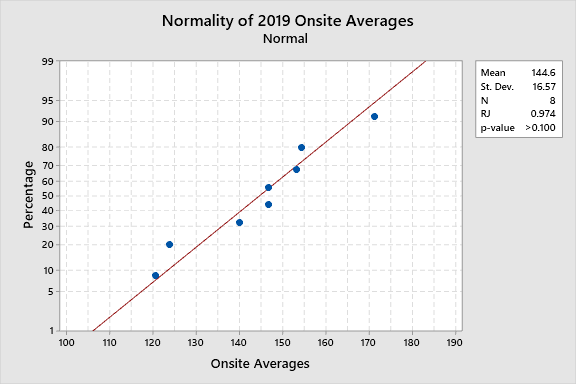
Source: Prepared by the author with Minitab.
Figure 5 Normality of the Averages for the 2019 Period (Onsite).
Figure 6 shows the normality of the averages of the online tests with a p-value greater than 0.094.
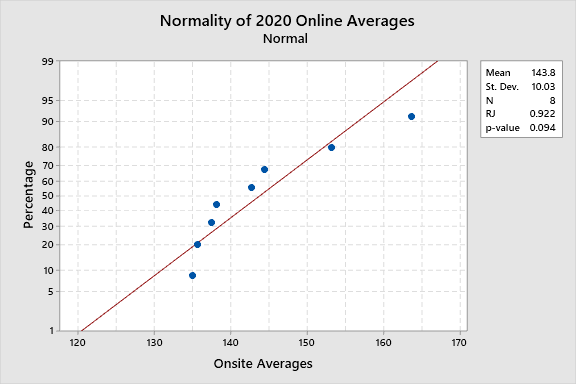
Source: Prepared by the author with Minitab.
Figure 6 Normality of the Averages for the 2020 Period (Online).
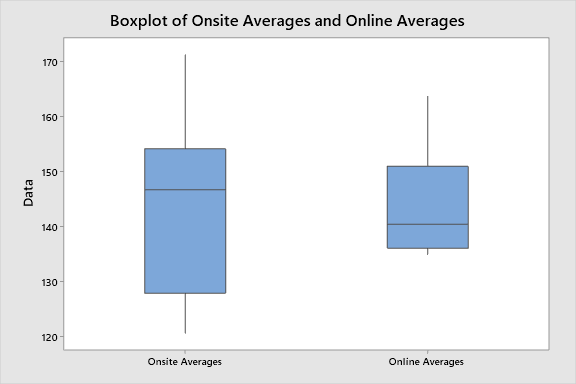
The box plot of both processes onsite and online is shown in Figure 7, which does represent a significant difference, however, it will be shown statistically.
To choose the t-Student statistic, and to be able to prove the hypothesis, it is necessary to verify whether the data have equal variances, applying the F-test. The hypotheses are:
H0: The variances are equal.
H1: The variances are unequal.
α: 0.05
The results of the F test indicate that the value obtained, 2.7300, is lower than the critical value of 3.7870. This comparison does not allow rejection of the null hypothesis. The conclusion is that the data have equal variances, as shown in Table 5.
Table 5 F Test for the Variances of Two Samples.
| Variable 1 | Variable 2 | |
|---|---|---|
| Means | 144.6072097 | 143.7581716 |
| Variances | 274.6798598 | 100.6140723 |
| Observations | 8 | 8 |
| Degree of Freedom | 7 | 7 |
| F | 2.730034214 | |
| P(F ≤ f) one-tail | 0.104273486 | |
| F critical (one-tail) | 3.78704354 |
Source: Prepared by the author using Excel.
The t-Student statistic is applied considering that the variances are equal. The hypotheses are:
H0: There is no significant difference between the scores averages.
H1: There is a significant difference between the scores averages.
α: 0.05
The result of the t-Student test is 0.1239, less than the critical value of 2.1447, which does not allow rejection of the null hypothesis or the alternative hypothesis. It is concluded that there is no significant difference, and it is notorious that the scores averages remained statistically the same, as shown in Table 6.
Table 6 Two-sample t-Student Test Assuming Equal Variances.
| Onsite | Online | |
|---|---|---|
| Means | 144.6072097 | 143.7581716 |
| Variances | 274.6798598 | 100.6140723 |
| Observations | 8 | 8 |
| Pooled Variance | 187.646966 | |
| Hypothesized Mean Difference | 0 | |
| Degree of Freedom | 14 | |
| T Stat | 0.12396137 | |
| P(T ≤ t) one-tail | 0.451554023 | |
| t Critical (one-tail) | 1.761310136 | |
| P(T ≤ t) two-tail | 0.903108045 | |
| t Critical (two-tail) | 2.144786688 |
Source: Prepared by the author using Excel.
Specific hypothesis 2: There is a significant difference between the deviation standards of onsite tests and online tests in 2019-2020 at Centro Preuniversitario UNMSM.
Figure 8 shows the normality of the standard deviation data during the onsite tests with a p-value greater than 0.10.
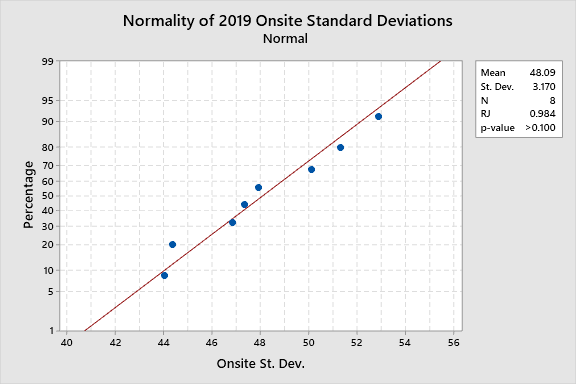
Figure 9 also shows the normality of the standard deviation data during the online tests with a p-value greater than 0.10.
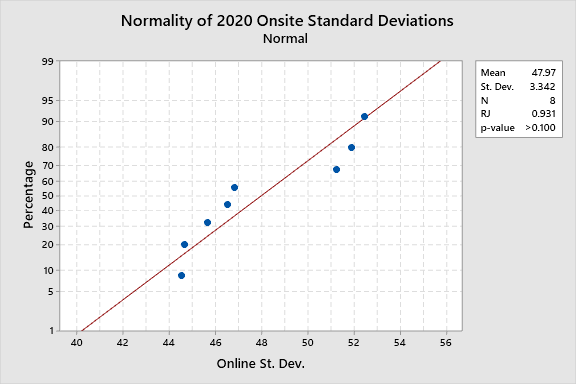
The box plot of the standard deviations of both processes is shown in Figure 10, where no significant difference is observed and will be shown statistically.
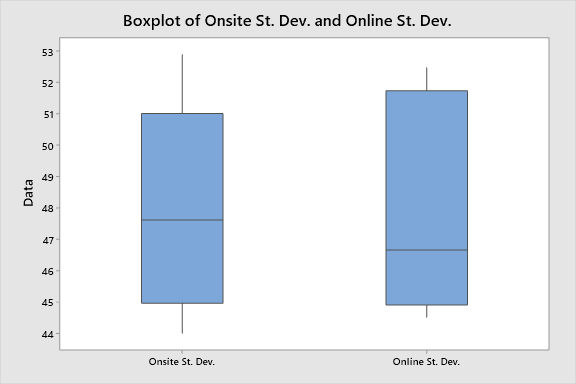
Source: Prepared by the author using Minitab.
Figure 10 Box plot of 2019-2020 Standard Deviations Data.
To choose the t-Student statistic, and to be able to prove the second hypothesis, it is necessary to verify whether the data have equal variances by applying the F-test. The hypotheses are:
H0: Variances are equal.
H1: Variances are unequal.
α: 0.05
The results of the F test indicate that the obtained value of 0.8998 is greater than the critical value of 0.2640. This allows rejection of the null hypothesis and the conclusion that the data do not have equal variances, as shown in Table 7.
Table 7 F Test for Two-Sample Variances.
| Variable 1 | Variable 2 | |
|---|---|---|
| Means | 48.091188 | 47.97113985 |
| Variances | 10.04889378 | 11.16750575 |
| Observations | 8 | 8 |
| Degree of Freedom | 7 | 7 |
| F | 0.89983332 | |
| P(F ≤ f) one-tail | 0.446420096 | |
| F critical (one-tail) | 0.264058226 |
Source: Prepared by the author using Excel.
The t-Student statistic is applied considering unequal variances. The hypotheses are:
H0: There is no significant difference between the standard deviations of the scores.
H1: There is a significant difference between the standard deviations of the scores.
α: 0.05
The t-Student test gives a result of 0.07371, less than the critical value of 2.1447. This allows the rejection of the alternative hypothesis and acceptation of the null hypothesis. It is concluded that there is no significant difference and it can be seen that the standard deviations of the scores remained statistically the same. The results are shown in Table 8.
Table 8 Two-Sample T-Student Test Assuming Unequal Variances.
| Onsite | Online | |
|---|---|---|
| Means | 48.091188 | 47.97113985 |
| Variances | 10.04889378 | 11.16750575 |
| Observations | 8 | 8 |
| Hypothesized Mean Difference | 0 | |
| Degree of Freedom | 14 | |
| T Stat | 0.073716485 | |
| P(T ≤ t) one-tail | 0.471139439 | |
| t Critical (one-tail) | 1.761310136 | |
| P(T ≤ t) two-tail | 0.942278878 | |
| t Critical (two-tail) | 2.144786688 |
Source: Prepared by the author using Excel.
The results of the standard deviations indicate that the eight values do not have equal variances, so the t-Student for different variances is applied. And for the averages that have equal variances, the t-Student for equal variances is applied.
In both cases, there are no significant differences, either in terms of standard deviations or averages.
DISCUSSION
The information gathered from onsite and online processes was analyzed using the concepts of average or mean and standard deviation as measures of central tendency. Likewise, representative data of the means of sixteen processes were obtained, eight of which were onsite and the other eight corresponded to online processes. In the same way, the standard deviations of the 16 processes were obtained. All the data were analyzed to determine whether they were normal in order to apply the t-Student test and conclude with the hypotheses proposed.
The results in both cases indicate that there is no significant difference when comparing the mean of the scores of onsite processes against the scores of online processes. The same occurs when comparing the standard deviations of the onsite and online processes’ scores.
Similar to Valencia (2014), which compares the performance of students well before the pandemic, the results showed that there are no significant differences, although these correspond to a sample analysis and in this case the population analysis.
The results are also consistent with Sánchez et al. (2022), whose results show otherwise, since they indicate that there are no negative differences in the results and, in general terms, there is no significant difference when comparing onsite and online scenarios.
An important contribution is to demonstrate that the digitalization of the processes met the objective since the results did not show significant differences. It could even have shown a positive difference, an improvement since a difference in scores could also be interpreted as a decrease or negative change.
CONCLUSIONS
Digitalization has been studied for several years, however, its implementation did not follow recommendations but was the best solution to continue the educational process, not only in Peru but throughout the world affected by COVID-19.
The differences in scores obtained in onsite and online environments have not meant any danger to the continuity of teaching. In many scenarios, it has been equal and in others, better. For this particular case, the scores during the 2019 processes of the Centro Preuniversitario with the scores of the 2020 online processes did not have a significant difference, which helps to conclude that digitalization was successful.
According to the results, there were no significant differences between the scores of the onsite and online tests, which was demonstrated after analyzing the averages and standard deviations of the eight onsite tests and the eight online tests.
RECOMMENDATIONS
There are other ways of analyzing the data, for example, by school, sex, age, etc. This work is presented as a motivator to continue with different studies.
It is also important to continue analyzing onsite and online data by applying more robust statistics such as the Median Absolute Deviation (MAD), which is used when data are not normal even though they are from the population and not from a sample.
REFERENCIAS
Aguilar-Barojas, S., (2005). Fórmulas para el cálculo de la muestra en investigaciones de salud. Salud en Tabasco, 11(1-2), 333-338. https://www.redalyc.org/articulo.oa?id=48711206 [ Links ]
Alegre de la Rosa, O. M., y Villar Angulo, L. M. (2017). Indicadores y control estadístico para el seguimiento y evaluación de preferencias de aprendizaje de estudiantes universitarios. Revista de Educación a Distancia, (55). http://dx.doi.org/10.6018/red/55/2 [ Links ]
Cabrera Rosas, F. T., y Portugal Flores, J. L. (2021). Estudio de prefactibilidad para la instalación de una academia virtual pre universitaria en modalidad virtual y online. (Tesis de grado). Universidad de Lima, Lima. https://hdl.handle.net/20.500.12724/14460 [ Links ]
Casiano Inga, D. A., Cueva Vega, E., Zumaeta Barrientos, M. R., y Casiano Inga, C. A. (2022). Impacto de la covid-19 en el desempeño académico universitario. Un análisis comparativo para la Universidad Nacional Toribio Rodríguez de Mendoza, en Amazonas (UNTRM-A). Actualidades Pedagógicas, (77). https://doi.org/10.19052/ap.vol1.iss77.2 [ Links ]
Chan Núñez, M. E. (2016). La virtualización de la educación superior en América Latina: entre tendencias y paradigmas. Revista de Educación a Distancia, 15(48). http://www.um.es/ead/red/48 [ Links ]
Gonzales Lopez, E. F., y Evaristo Chiyong, I. (2021). Rendimiento académico y deserción de estudiantes universitarios de un curso en modalidad virtual y presencial. RIED. Revista Iberoamericana de Educación a Distancia, 24(2), 189-202. https://doi.org/10.5944/ried.24.2.29103 [ Links ]
Grande de Prado, M., García Peñalvo, F. J., Corell Almuzara, A., y Abella García, V. (2021). Evaluación en Educación Superior durante la pandemia de la COVID-19. Campus Virtuales, 10(1), 49-58. [ Links ]
Hernández Sampieri, R., Fernández Collado, C., y Baptista Lucio, M. (2014) Metodología de la Investigación (6ª ed.). México DF, México: McGraw Hill. [ Links ]
Huanca Arohuanca, J. W., Supo Condori, F., Sucari Leon, R., y Supo Quispe, L. A. (2020). El problema social de la educación virtual universitaria en tiempos de pandemia, Perú. Innovaciones Educativas, 22(Especial), 115-128. https://doi.org/10.22458/ie.v22iespecial.3218 [ Links ]
López, C., y Molina, F. (2021). Herramientas para evaluar en tiempos de pandemia: Un análisis comparativo. En REDINE (Ed.), Edunovatic 2021. 6th Virtual International Conference on Education, Innovation and ICT. Madrid, España: REDINE. [ Links ]
Oficina Central de Admisión. (2020). Reglamento de Admisión 2020-II. Lima, Perú: Universidad Nacional Mayor de San Marcos [ Links ]
Rosales Gracia, S., Gómez López, V. M., Durán Rodríguez, S., Salinas Fregoso, M., y Saldaña Cedillo, S. (2008). Modalidad híbrida y presencial. Comparación de dos modalidades educativas. Revista de la Educación Superior, 37(148), 23-29. [ Links ]
Sánchez Arévalo, C. M., Luján Facundo, M. J., Rodriguez Lopez, A. D., Ferrer Polonio, E., y Martí Calatayud, M. C. (6-8 de julio de 2022). Rendimiento del alumnado en un entorno semi-virtual durante el aprendizaje de la asignatura Experimentación en Ingeniería Química II. Comparación con el escenario presencial, Congreso In-Red. VIII Congreso de Innovación Educativa y Docencia en Red, Valencia, España. https://doi.org/10.4995/INRED2022.2022.15872 [ Links ]
Torres-Cuevas, I., Pérez Garrido, S., Rius Pérez, S., y Marqués Martínez, L. (13-15 de julio de 2021). Impacto de la metodología Online vs Presencial en las prácticas de Ciencias de la Salud. VII Congreso de Innovación Educativa y Docencia en Red, Valencia, España. http://dx.doi.org/10.4995/INRED2021.2021.13466 [ Links ]
Valencia Arras, A. K. (2014). Competencias en TIC, rendimiento académico y satisfacción de los estudiantes de la maestría en Administración en la modalidad presencial y virtual de la Facultad de Contaduría y Administración de la Universidad Autónoma de Chihuahua. Diferencias por género. (Tesis doctoral). Universidad de Salamanca, Salamanca. [ Links ]
Vilela Alemán, P., Sánchez Calderón, J., y Chau, C. (2021). Desafíos de la educación superior en el Perú durante la pandemia por la COVID-19. Desde el Sur, 13(2). https://doi.org/10.21142/DES-1302-2021-0016 [ Links ]
Yong, E., Nagles, N., Mejía, C., y Chaparro, C. (2017). Evolución de la educación superior a distancia: desafíos y oportunidades para su gestión. Revista Virtual Universidad Católica del Norte, 50, 80-105. http://revistavirtual.ucn.edu.co/index.php/RevistaUCN/article/view/814/1332 [ Links ]
Received: June 22, 2023; Accepted: August 10, 2023; pub: December 20, 2023
 Este es un artículo publicado en acceso abierto bajo una licencia Creative Commons
