


Services on Demand
Journal

Article
 English (pdf)
 Article in xml format
 Article references
 Send this article by e-mail
Indicators
-
 Cited by SciELO
Related links
-
 Similars in
SciELO
Similars in
SciELO
Share

 Permalink
Journal of Economics, Finance and Administrative Science
Print version ISSN 2077-1886
Journal of Economics, Finance and Administrative Science vol.15 no.29 Lima Dec. 2010
ARTICLES
Strategic Brand Positioning Analysis through Comparison of Cognitive and Conative Perceptions
Análisis de posicionamiento estratégico de marca a través de la comparación de percepciones cognigtivas y de conación
Dr. Parikshat S. Manhas1
1 Associate Professor, The Business School, University of Jammu, Jammu ,Tawi, India
ABSTRACT
Due to the globalization of the economy, there has been great competition in the business sector. The basic human desire to challenge new limits and capture as much market as it is possible has given a new dimension to the concept of marketing - brand positioning. To position a brand requires making choices; whereas having a position means people will prefer a brand over another. A brand can be positioned in several ways: offering a specific benefit, targeting a specific segment, price or distribution. Despite the fact that positioning is considered by both academics and practitioners to be one of the key elements of modern marketing management, it is surprising to uncover general paucity of consumers/customers derived studies regarding brand positioning strategies.
This article analyzes the market position held by a competitive set of brands in the hair oil market through a comparison of cognitive and conative perceptions. Cognition will be identified by trailing a factor analytic adaptation of importance performance analysis. In turn, conation will be gauged by stated intent of the consumers to purchase the hair oil brands under study. The alignment of the results from these techniques will help in identifying the position of leadership held by a brand in the hair oil market. The marketers, in order to strategically place their brands in todays competitive market, need to identify the attributes on which they need to focus and those of paramount importance for the consumers. This method of positioning analysis offers a practical means for present-day marketers faced with the challenge of identifying one or few brands from their diverse and multi-attributed brand range that could be developed to differentiate their brand in a meaningful way to consumers.
Keywords: Brand positioning; cognition; conation; Importance Performance Analysis.
RESUMEN
Debido a la globalización de la economía, existe una gran competencia en el sector de negocios. El deseo básico humano de retar nuevos límites y capturar la mayor porción del mercado le ha dado una nueva dimensión al concepto de marketing - posicionamiento de marca. Posicionar una marca requiere hacer elecciones, mientras tener una posición significa que la gente prefiere una marca sobre la otra. Una marca puede estar posicionada por diferentes medios: ofreciendo un beneficio específico, enfocándose en un segmento específico, precio o distribución. A pesar de que el posicionamiento está considerado tanto por académicos como por profesionales como uno de los elementos claves en la gestión del marketing moderno, es sorprendente verificar la escasez de estudios derivados consumidores/clientes en cuanto a las estrategias de posicionamiento de marca.
Este artículo analiza el posicionamiento de mercado de varias marcas competitivas en el mercado de aceites para el cabello a través de una comparación de percepciones cognitivas y emotivas. La cognición será identificada siguiendo un factor analítico de adaptación de un análisis de rendimiento por importancia. Por su parte, la emotividad se medirá a través de la intención manifestada de los consumidores para comprar las marcas de aceite de pelo estudiadas. El alineamiento de los resultados de estas técnicas ayudará a identificar la posición de liderazgo que una marca en el mercado de los aceites para el pelo ocupa. Los marqueteros, para colocar estratégicamente sus productos en el competitivo mercado de hoy, necesitan identificar los atributos en los que deben enfocarse y en aquellos de mayor importancia para sus consumidores. Este método de análisis de posicionamiento ofrece un medio práctico para la nueva generación de marqueteros que enfrentan el reto de identificar uno o varias marcas de entre la diversidad de marcas que podrían desarrollar para diferenciar su marca de una manera significativa entre los consumidores.
Palabras claves: posicionamiento de marcas, cognición, conación, Análisis de Rendimiento de Importancia.
INTRODUCTION
In todays increasingly competitive industrial scenario, a key challenge for marketers is to cut through the noise of competing and substitute products to attract the attention of the consumer. With thousands of Multinational Companies (MNCs) now competing for attention, brands are becoming substitutable. From the demand perspective, the explosion in brand choice and brand publicity material has increased the confusion among potential consumers.
Positioning is considered by academics (Aaker & Shansby, 1982; Park, Jaworski, & MacInnis, 1986; Arnott, 1993, 1994; Arnott & Easingwood, 1994; Myers in Blankson & Kalafatis, 2004; Porter, 1996; Kotler, 1997; Hooley, Greenley, Fahy, & Cadogan, 2001; McKenna, 1986; Bainsfair in Blankson & Kalafatis, 2004; Dovel, 1990; Trout & Rivkin, 1996) to be one of the key elements of modern marketing management. Despite this acknowledged central role, it is surprising to uncover a general paucity of documented, empirically based and consumer/customer-derived studies positioning strategies.
The purpose of this article is to present the results of an analysis of the positions held by a competitive set of brands through a comparison of cognitive and conative perceptions. The intent is to identify dimensions of brand attractiveness representing positions that could be developed by MNCs to differentiate their brand in a meaningful way to consumers. The key assumption supporting this discussion is that effective positioning is a mutually beneficial process to both the marketer and the consumer. This is because positioning is underpinned by the philosophy of understanding and meeting unique consumer needs. Effective positioning offers the customer benefits tailored to solve a problem related to their needs. In a way that is different to competitors (Chacko, 1997). For the organization, the value of positioning lies in the link it provides between the analyses of the internal corporate and external competitive environments. This is fundamental to the definitions of strategic marketing, which point to the matching of internal resources with environmental opportunities (Pike & Ryan 2004).
There is general agreement that the concept of positioning has been one of the fundamental components of modern marketing management (Hooley et al., 2001). Its importance is further supported by evidence that indicates a positive relationship between company performance (in terms of profitability and/or efficiency) and well-formulated and clearly-defined positioning activities (Brooksbank, 1994; Devlin, Ennew, & Mirza, (1995); Porter, 1996). Dovel (1990) contended that positioning shouldnt be just a part of the strategy, but should be the backbone of any business plan. This was echoed by F. E. Webster, Jr. (1991) who declared that positioning was a relevant strategic concept, a development in consumer marketing, but with equal applicability for industrial products and services. Webster even referred to it as the positioning of the companys value, which he defined as the unique way the firm delivered value to its customers.
REVIEW OF LITERATURE
Positioning theory is based on three propositions (Ries & Trout, 1986). First, we live in an over communicated society, bombarded with information on a daily basis. Second, the mind has developed a defense system against the clutter. Third, the only way to cut through the clutter to reach the mind is through simplified and focused messages.
Marketing battles are not fought in the customers office or in the supermarkets. These are only distribution points for the merchandise whose brand selection is decided elsewhere. Marketing battles are fought in a mean and ugly place. A place that is dark and dump with much unexplored territory and deep pitfalls to trap the unwary. Marketing battles are fought inside the mind (Ries & Trout, 1986). The Brand Positioning Strategies element is considered to be important for the operationalization of the concept. Fill (1999) states that the successful positioning can only be achieved by adopting a customers perspective and by understanding how customers perceive products in the class, and how they attach importance to particular attributes that can be grouped under a construct (Sweeney & Soutar, 2001).
In modern marketing, in order not to succumb to "marketing myopia" (Levitt, 1986), and to benefit from long-term survival, there is a growing need for firms to assess their offerings (Park et al., 1986; Bernstein, 1992) and manage their organizations in relation to their competitors (McKenna, 1986; Ries & Trout, 1986; Wright, 1997). The domain of the concept of positioning is concerned with attempt to modify the tangible characteristics and intangible perceptions of a marketable object in relation to competition (Arnott, 1993). More recently, Alden, Steenkamp, & Batra (1999) have confirmed the importance of positioning in international marketing and conclude that there is the emergence of a global consumer culture positioning (GCCP). Furthermore, they suggest that the latter is a "positioning tool" that can be employed by marketers in the multinational marketplace.
Soundararaj & Rengamani (2002) have studied the inevitability of positioning in the present marketing scenario, with special reference to Indian marketing conditions. According to them, positioning is not what you do to a product, but what you do to the minds of the prospect customer; that is, you position the product in the mind of the intended client. It is understood that a products position is the way in which the product is defined by consumers on important attributes and the place, the product occupies in the minds of the consumers relative to competing products.
Urban & Hauser (1993) state, "Positioning is critical for new product. Not only must a new product deliver the benefits the customer needs, but it must do so better than competition" (p. 202). In developing a positioning, the marketer must consider four things:
-
The target market
-
How the product is different or better than competitors
-
The value of this difference to the target market
-
The ability to demonstrate or communicate this difference to the target market
These elements roughly relate to the components of a brands position as described by Aaker (1996); they are target audience, subset of identity/value proposition, create advantage, and actively communicate. Brand also represents an investment which creates an incentive to maintain quality and customer satisfaction (Grant, 2005). This may give the potential customer some assurance when selecting a product. Furthermore, Kotler and Keller (2006) specified that brand image is the different perceptions and beliefs consumers held, as reflected in the associations consumers memory may grasp.
The brand identity and positioning is central to developing strong customer base and brand equity. The target market and the perceived differentiation from competitors are core concepts of positioning. Rao & Steckel (1998) define a brands positioning as the relative perception of it within a significant group of customers. At the same time, both authors argue that segmentation and positioning are often treated as independent concepts, in practice and in the literature. Nonetheless, they claim, positioning is valueless if outside of its target segment. As suggested by Kapferer (2004), brand positioning task is to give the answers to the four questions: a) a brand for what; b) a brand for whom; c) a brand for when; and, d) a brand against whom. According to Kumar (2007), brand positioning is the fundamental concept in brands strategy that helps in finding a niche in the minds of the target segment.
In the last few years, research, conducted between higher and lower performing United Kingdom (UK) companies in terms of their marketing practices, has revealed that to be successful over the long term, a firms offering must be well positioned in the market place (Brooksbank 1994). This is supported by authors including Clement & Werner-Grotemeyer (1990) and Devlin et al. (1995) who assert that, just as marketing has become an increasingly important element of strategic management process, so has become fundamental to the success of firms the adoption of the positioning concept, and its profitability has also been evidenced in a paper written by Fisher (1991) who contended that: " a differentiated position generates high return on profits " (19-20). The above is supported by a United States (US) empirical research, conducted by McAlexander, Becker, & Kaldenberg (1993), who state that the selection of a positioning strategy correlates significantly with financial performance.
A major objective of any brand positioning strategy is to reinforce positive image already held by the target audience, correct negative images, or create a new image. Fishbein, (1967) and Fishbein & Ajzen, (1975) argued the importance of distinguishing between an individuals beliefs and attitudes. While beliefs represent information held about an object, attitude is a favorable or unfavorable evaluation of the object. Fishbein (1967) proposed attitude comprised cognitive and conative components. Cognition is the sum of what is known about a brand, which may be organic or induced. In other words, this is awareness, knowledge, or beliefs, which may or not have been derived from a previous use of the brand.
The conative image is analogous to behaviour since it is the intent or action component. Intent refers to the likelihood of brand purchase (Howard & Sheth, 1969). Conation may be considered as the likelihood of buying a brand within a certain period of time. Positioning analysis requires more than an understanding of a products image in the mind of the consumer. What is also required is a frame of reference with the competition, since a position is a products perceived performance, relative to competitors, on specific attributes (Lovelock, 1991).
This research attempts to address the points given in the review of literature and the gap analysis through the analysis of Brand positioning strategies adopted by companies operating in well established Indian business markets, which are characterized by branded products in hair oil market and, consequently, the research deals with positioning as applied to actual brands. This paper primarily throws light on the underlying factors that form the basis on which consumer perceptions are developed and makes use of the Importance Performance Analysis to study the performance of different multinational and domestic brands in terms of the desired characteristics of the brands, viz a viz the importance of the underlying factors.
METHODS
This study involved a Strategic Brand Positioning Analysis of hair oil brands through comparison of cognitive and conative perceptions in the Indian market. The choice of this particular sector is based on:
-
Its relative long term stability (i.e. potential respondents were expected to be familiar with the main companies operating in this market); and,
-
Market structure in terms of products (branding is very common and promotions are based on brand names), and vast market coverage.
Selection of Brands
A pilot survey was undertaken to identify the multinational brands and domestic brands to be studied in the hair oil product category. During the pilot survey, 115 respondents were interviewed and were asked to recall the brand names in the hair oil product category. The top two multinational brands of hair oil product category selected were Clinic Plus (29.065) and Nihar Amla (7.50%); both these brands belonged to Hindustan Unilever Limited a multinational company. The top two domestic brands of hair oil selected were Parachute (19.51%) and Hair & Care (8.13%), belonging to Marico Industries, a domestic company.
Identification of Attributes
Lancaster (1966; 1971; 1979) shows that consumer have preferences for characteristics (or attributes) of products. Each product is a bundle of attributes. Understanding why a consumer chooses a product based upon its attributes helps us to understand why some consumers have preferences for specific brands. This allows an analysis of brand competition.
According to Gwin & Gwin (2003), consumers choice is based on maximizing utility (or the level of satisfaction received) from the products attributes subject to a budget constraint. The markets have brands that are substitutes for each other and are distinguished by their makeup of a specific set of characteristics. Understanding consumers preferences for attributes that distinguish among brands can help in defining the best positioning and marketing mix for a particular brand.
Clarke (1982, 1983) used a list of attributes in his case regarding hair oil products. Keeping his case as basis, the researcher identified the following attributes for hair oils for the conduct of the present research: a) fragrance; b) adds body and bounce; c) leaves hair more manageable; d) better shine; e) relieves dryness; f) consistency; g) repairs hair; and, h) content.
The above given attributes were developed initially for hair oils product category after going through the available literature. Along with these attributes, the Quality attribute was added after going through the arguments of Morton (1994). This author says that marketers across all products and service categories increasingly recognize the role of perceived quality in brand decisions. Analyzing how consumers perceive brand quality provides an accurate measurement and definition of brand equity and predict their brand preferences. The attributes thus developed were then tested in the market to know consumers response. Since a considerable amount of time had elapsed between the study conducted by Morton and the present study, we perceived that consumers looked into new attributes while selecting the brands.
With the responses from consumers (165 participants), it was seen that majority of attributes listed were taken into consideration while selecting a brand, except in the case of the attribute "Repairs the Hair". The respondents (81%) suggested the use of the attribute "Suits the hair". At the same time, respondents named the following attributes to be added to the original list of attributes prepared for this study: a) price (69%); b) advertisements (63%); c) packaging (56%); d) promotional scheme (68%); e) display at the shop (58%); and, f) availability (57%). Thus, the final list of attributes developed after the pilot survey for hair oil product category was:
-
Quality,
-
Contents,
-
Price,
-
Advertisements,
-
Packaging,
-
Fragrance,
-
Availability,
-
Consistency,
-
Suits the hair,
-
Promotional scheme,
-
Display at the Shop,
-
Better shine,
-
Adds bounce & body,
-
More manageable, and
-
Relieves dryness
Sampling Design and Population
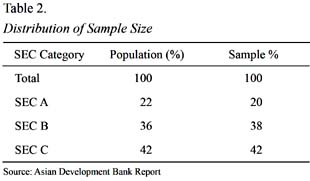
In order to develop the sampling of our research, two studies were taken as basis. The first was "Brand Equity Special on Indias most trusted Brands - Rankings overall, population, By Demographics and By Regions" published in the Brand Equity edition of The Economic Times, of July 18th, 2001; the second study was "Giving and Fund Raises in India" in the Asian Development Bank Report. After going through these two studies, we decided to concentrate on the socioeconomic categories (SEC) A, B and C; that is on the first three upper classes of society based on education and occupation. The characteristics for categorization into A, B and C socioeconomic classes was done on the basis of research conducted by Market Research Society of India (MRSI), which has developed this classification for understanding the expenditure behaviour of Indians. The socioeconomic classification has been developed for households and individuals, which group all individuals who are likely to behave similarly. The system identifies people and households as follows:
-
SEC – A1 and A2 collectively known as SEC – A
-
SEC – B1 and B2 collectively known as SEC – B
-
SEC – C
-
SEC – E1 and E2 collectively known as SEC-E
There are in all eight socioeconomic groups: A1, A2, B1, B2, C, D, E1 and E2. A1 comprises the upper most socioeconomic class and E2 stands for the lowest socioeconomic class of people in India.
This survey was restricted to SEC A, B and C in urban India only to focusing on the prime target audience for most consumers branded products. According to Brand Equity (2001), it is felt that if a rural consumer is asked to rate various brands, his ratings would be driven mainly by familiarity or popularity, thus brands core attributes might be overlooked; they would choose brands with mass market appeal and playing down the majority of attributes unconsciously. Given these difficulties this survey concentrated in selected cities/towns of urban India where a more balanced population sample can be assured. Again in Brand Equity, it has been suggested that awareness and usage amongst SEC D and SEC E households are restricted to a small number of brands; hence, these two classes are also considered inappropriate to assess the brand positioning strategies.
After having decided the three socio-economic classes to be considered, the next crucial step was to determine the segments to be studied within these three socioeconomic categories. The idea was to interview all possible consumers who use the brands. Thus, the consumers were divided as follows:
-
Chief wage earners (CWE): they are the ones who contribute maximum to the household income.
-
Housewives: with the growth in womens education standards, now they participate more in the decision making in Indians households.
-
Young adults (males and females): this is the category of consumers who are very articulate as far as their choices are concerned.
These categories of consumers were also supported by the literature review we performed. They also are the same categories of consumers examined by Brand Equity for their survey on brands.
This survey was conducted across three cities of North India for a three-month period, from January to May, 2009. The cities chosen were:
-
Delhi - Metro city of India
-
Chandigarh – Class I City of India
-
Jammu – Class II City of India
This categorization of cities was also undertaken on the basis of survey of Brand Equity on Brands (18, July, 2001).
The total sample size of our survey was 1800 each. This sample size was divided as shown on Table 1.
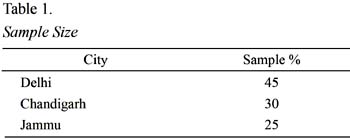
A stratified random sampling method was used to select the households from which respondents were interviewed. Since our study relates to the Brand Positioning Strategies, stratification of the households would help in minimizing the variation as far as study of perceptions of the consumers regarding different brands of is concerned.
The survey agency AC Nielson reported that according to the National Readership Studies Council, which is an autonomous division of the Audit Bureau of Circulation that conducts a National Readership Survey, the average monthly income for SEC-A, SEC B and SEC C category households in top 26 cities/ towns, in year 2000 was as follows:
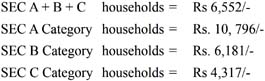
The distribution of the three categories in our sample is show on Table 2
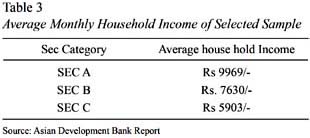
The average of claimed monthly household income of the total sample was Rs.7050/-. The average monthly household income for all three categories is shown on Table 3.
Conduction of Survey
Field interviews were conducted by the researchers in the selected three cities. Each one was divided into four different areas – north, south east and west. The total sample for every one of them was distributed among each area of the three cities. In turn, the localities in all areas were chosen randomly and, in every locality one house was selected at random as well. Every second household was selected for interview, beginning from the first house, using the right hand rule, till the sample was achieved. Only one respondent was selected from each household visited. Each respondent was shown the brands under study. Since all these brands had different presentations, only the following were shown to the respondents:
1. Clinic Plus
-
Clinic Plus Coconut Hair Oil
-
Clinic All Clear Anti Dandruff Hair Oil
2. Parachute
-
Parachute Coconut Oil
-
Parachute Coconut Oil for Dandruff
3. Nihar Amla
-
Nihar Coconut Amla Hair Oil
4. Hair & Care
-
Hair & Care Perfumed Light Hair Oil
-
Hair & Care Conditioner & Protection Hair Oil
The respondents were asked informally whether they had used these brands presentations within the last year. Only if their answer was affirmative, the respondents were asked to fill in the questionnaire. If the respondents did not have time to fill the questionnaire, they were provided with self-stamped addressed envelopes to return the questionnaire fully answered to the researcher.
Respondents were first asked to rate the importance of the 15 cognitive attributes using a 5 point scale starting at 1 = not important and 5 = very important. In a separate section, respondents were asked to indicate the perceived performance of each of the five competing brands across the same attributes. Again, a 5 point scale was used. The purpose of these two sections was to facilitate an important performance analysis (IPA) on the cognitive perceptions.
Conation was measured by requesting respondents to indicate the likelihood of purchasing each brand within the next 12 months. While it is acknowledged this represents started intent to buy a brand rather than actual purchase, Belk (1975) found intent was associated with behaviour when context and time were included. A 5-point scale was used, anchored at 1 = definitely not and 5 = definitely yes.
Statistical Technique Used
Factor Analysis
Over the years, several different techniques have been used to assist marketers with their brand positioning strategies. To effectively position (or reposition) a brand, the company must know how this brand is perceived in relationship to other brands in the product category. The primary techniques are Factor Analysis, Discriminant Analysis, Multi-attribute Compositional Models and Multidimensional Scaling. Each has advantages and disadvantages (Green & Rao 1972; Hauser & Kopleman 1979). Several articles discuss and demonstrate the use of factor analysis for product positioning (Hauser & Urban 1977; Hauser & Wisniewski 1979; Huber & Holbrook 1979). Usually, the input data consist of a three-dimensional matrix of subjects ratings of objects on a variety of attributes. The advantages of factor analysis are that both subjective and objective attributes can be used and that the dimensions of the product space are relatively easily determined from factor loadings.
Hauser & Koppelman (1979) conclude that attribute-based techniques such as factor analysis and discriminant analysis provide better measures of consumer perceptions than similar techniques such as multidimensional scaling if the set of attributes is reasonably complete. In addition, Hauser & Koppelman (1979) show that factor analysis is typically better than discriminant analysis. It is suggested by (Hauser & Koppleman 1979) that factor analysis performs better than any other technique with respect to both predictive ability and interpretability.
Importance Performance Analysis (IPA)
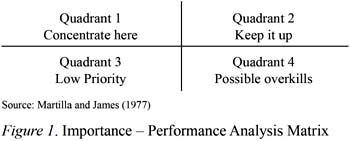
Understanding how well a brands attributes perform is not sufficient to determine positioning if they are not also evaluated in terms of importance to the consumers. Brands attractiveness consists not only of the beliefs about the attributes of the brands, but also of the importance of the attributes of these brands to consumers (Ryan, 1991). Importance performance Analysis (IPA), introduced by Martilla & James (1977), was selected as a valid technique suitable for studying this aspect of brand attractiveness. Results are plotted on a matrix with four quadrants as shown in Figure 1. The Y-axis records respondents importance rating of each attribute, while the X-axis plots perceived performance of the brands on the same attributes. Quadrant 1 features attributes that have been rated important, but where the product is not perceived to perform strongly. This signals the need for the marketer to "Concentrate here" to improve perceptions of performance. Quadrant 2 features those attribute rated important and where the product performs strongly. These attributes represent potential strengths. It would be expected that the marketer would focus promotional communications on attributes in quadrants 1 and 2 since those plotted in Quadrant 3 and 4 are rated lower in importance by the target audience.
RESULTS
Descriptive Statistics
Table 4 depicts the information regarding the Company Awareness; Usage of Brands; Brand Loyalty; Consumption Level of various respondents vis-à-vis hair oils being used; Brand Sensitivity and Brand Switching.
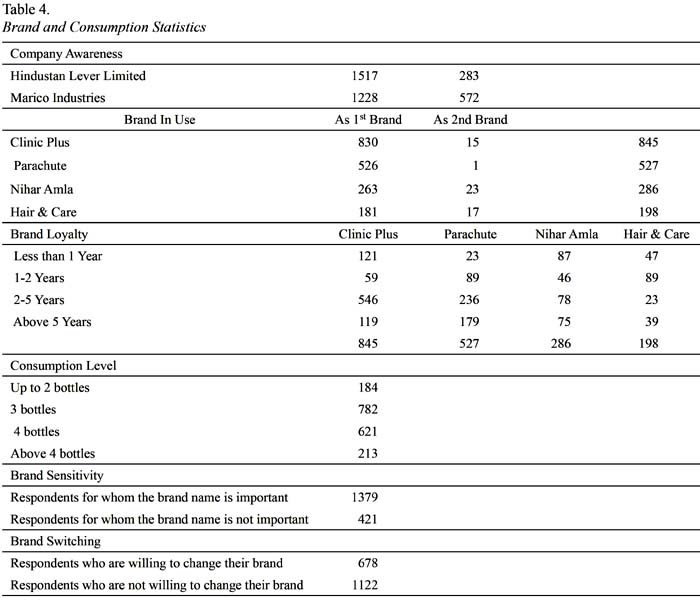
84% of the respondents were aware of Hindustan Lever Limited where as only 68% of the respondents were aware of Marico Industries. About 46% of the respondents are using Clinic Plus brand, followed by Parachute (28%), Nihar Amla (15%) and Hair & Care (11%). Clinic Plus is used as first choice brand by 46% of respondents; 27% of respondents used it as second choice brand. 29% of the respondents used Parachute as first choice brand and 2% respondents used it as second choice brand. Nihar Amla was used as first choice brand by 15% of respondents, and 41% used it as second choice brand.
Hair & Care has 10% respondents using it as first choice brand; 30% respondents used it as second choice brand. 61% of the respondents used the hair oil brands Clinic Plus and Nihar Amla of Multinational National Company (HLL), and 39% of respondents used hair oil brands of domestic companies (Marico Industries), that is Parachute and Hair & Care.
As far as brand loyalty is concerned, of all the respondents who were using the brands under study as first and second choices, about 36% of respondents had been using Clinic Plus for over the last two years, and over 6% respondents had been using Clinic Plus for over the last five years; only 10% of the respondents had started using Clinic Plus brand within the last two years. It was noted that 6% of respondents had only started using Parachute within the last two years, whereas 22% of respondents had been using it over two years. About 7% of respondents had started using Nihar Amla within the last two years, and little over 8% respondents had been using it for over two years. Hair & Care was also being used by 7% of respondents for the last two years and above 3% of respondents had been using it for over two years period now.
It was also observed that 44% of respondents had been using Multinational Company (HLL) hair oil brands (Clinic Plus and Nihar Amla) for over two years now and 26% of respondents had been using domestic hair oil brands (Marico Industries, Parachute and Hair & Care).
On an average, 78% of respondents have reported a consumption of three to four bottles of hair oil (100 ml presentation) per month, and about 12% of respondents reported the consumption of over four bottles per month of the same product. The majority of respondents (77%) claimed that brand name was very important and they made it a point to purchase branded hair oil only. 38% of respondents were not satisfied with their present brand of hair oil and were contemplating a shift to some other brand. However, 62% of respondents were satisfied with their present brand of hair oil.
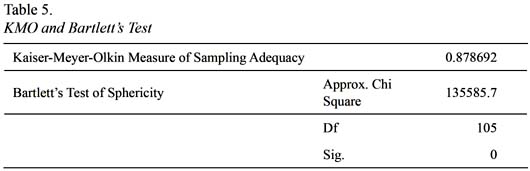
The Kaiser-Meyer-Olkin test (KMO) and Bartletts test of Sphericity were also applied on the collected data. Kaiser-Meyer-Olkin measure of sampling adequacy tests whether the partial correlations among variables are small or not. The results showed that value of KMO is 0.878 and, according to the criteria suggested by Kaiser (1974), the criteria for our value of KMO = 0.878 is "Meritorious". Thus KMO Statistic suggests that we have sufficient sample size relative to the number of items/ attributes in our scale.
The significance Level (Sig) for Bartletts test of Sphericity (135585.75), for the 15 attribute/item Correlation matrix was highly significant (p<.000). Thus, we can conclude that according to Bartletts test, the correlation matrix is not an identity matrix. Hence, the KMO statistic and Bartletts test of Sphericity (P<O) suggest that the correlation matrix is factorable and that there are some underlying factor/dimensions that may explain the variance of 15 items.
The principal components analysis with Varimax Rotation identified three factors that explained 78.22% of total variance. The factor loadings are shown on Table 6. This table gives us the complete details regarding the attributes being loaded on each factor along with factor loadings. The factors were named as follows:
Factor I - Transaction Factor
Factor II - Benefit Factor
Factor III - Composition Factor
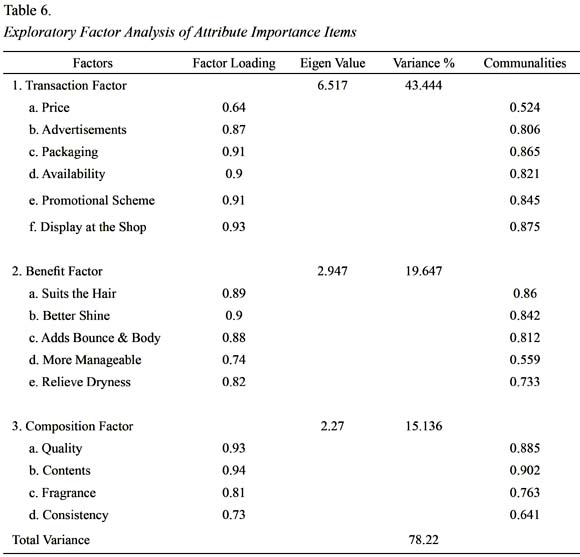
Transaction Factor consists of six attributes namely Price, Advertisements, Availability, Packaging, Promotional Scheme, Display at the Shop (with factor loadings range of 0.64 to 0.93), where Display at the Shop shows the highest factor loading of 0.93 and Price showing the lowest of 0.64.
Benefit Factor consists of five attributes, which are Suits the Hair, Better Shine, Adds Bounce & Body, More Manageable and Relieves Dryness with factor Loadings range of 0.74 to 0.90, with Better Shine showing the highest factor loading of 0.90 and More Manageable with the lowest factor loading of 0.74.
Composition Factor consists of four attributes: Quality, Contents, Fragrance and Consistency with a factor loadings range of 0.73 to 0.94. In this case, Contents showed the highest factor loading of 0.94 and Consistency had the lowest factor loading of 0.73.
The communalities figure indicates that more than 60% variance has been explained for all the attributes except for More Manageable and Price, for which 55.9% and 52.4% variance has been explained respectively.
The Attribute Importance results are presented on Table 7. To understand the importance of the attributes, the respondents were asked to rate them on a scale of 1 to 5, where 5 meant very important and 1 meant least important. The consumers appeared to be favouring attribute Suits the Hair, which has mean equal to 5 and standard deviation equal to 0.07, followed by two benefit related attributes Adds Bounce & Body (mean = 4.77, S.D. = 0.64) and Better Shine (mean = 4.74, S.D = 0.61). Thus, we can see that the top three attributes belong to Benefit factor. Attribute Consistency belonging to the Composition factor has the lowest mean of 3.66 with standard deviation equal to 1.24. Incidentally, Consistency has the highest Standard Deviation amongst all the attributes. The Transaction factor attributes Display at the Shop, Availability and Promotional Scheme have very high standard deviation of 1.231, 1.229 and 1.22 respectively.
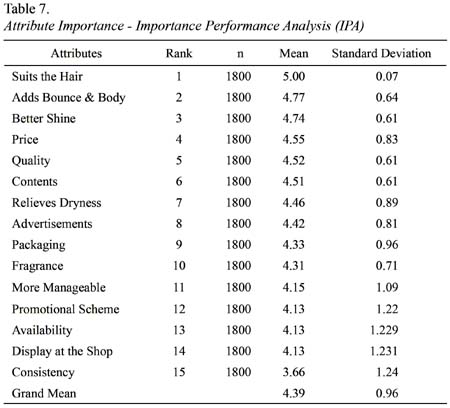
On the whole, Benefit attributes Suits the Hair, Adds Bounce & Body, Better Shine, Relieves Dryness and More Manageable have 1, 2, 3, 7 and 11 ranks among all 15 attributes making this as the most important factor followed by Composition factor and Transaction factor. This table also provides us with the Grand mean for Attribute Importance equal to 4.39, and mean Standard Deviation equal to 0.96. The grand mean for attribute importance (4.39) will be used for plotting X-axis Crosshair in the Importance Performance Attribute Matrix.
Table 8 provides us with all four Brands Perceived performances. The grand mean of Clinic Plus brand is 4.38 with mean standard deviation = 0.87. The grand mean of Parachute brand is equal to 3.21 with mean Standard deviation = 1.14.The grand mean of Nihar Amla brand is 3.45 and mean standard deviation is equal to 1.33.The grand mean of Hair & Care brand is 2.58 with mean standard deviation of 1.33.
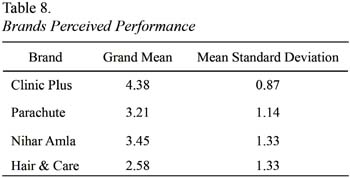
Also, from Table 8 we are able to get grand mean of all brands (4.38 + 3.21 + 3.45 + 2.58/4 = 3.405), which is where the Y-axis crosshair is going to be plotted for Importance-Performance Analysis (IPA) matrix.
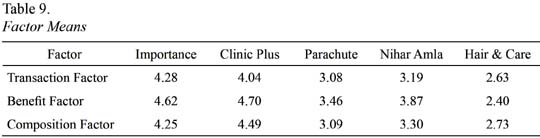
Table 9 provides us with the mean factor scores for attribute Importance and perceived performance for each brand. Multinational brand of hair oil Clinic Plus has factor means for perceived performance closest to the attribute Importance on all three factors where as domestic brand of hair oil Hair & Care has factor means for perceived performance at the farthest point from the attribute Importance for all the three factors. The factor means given on Table 9 are applied to plot Importance Performance Analysis Matrix (IPA) which is given in Figure 2.
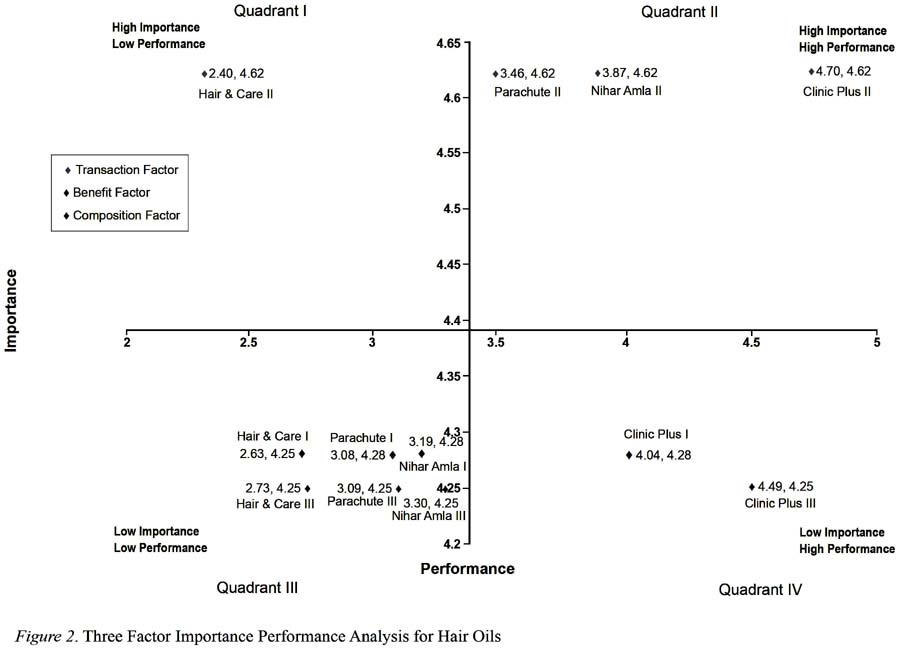
Also on Figure 2, Performance is shown along X-axis and Importance is shown along Y-axis. Each brand performance mean score on each factor along with attribute Importance mean score for each factor is used to plot one Co-ordinate on the map. The Y- axis Cross hair is plotted at the grand mean of all brands performance (3.405) while the X-axis cross hair is plot at the grand means for attribute importance (4.39). The name of each brand along with the factor number has been used to code each data point. Along with this code the values of each data point are also shown.
Figure 2 has four quadrants with Quadrant I depicting High Importance and Low Performance. Quadrant II depicts High Importance and High Performance. Quadrant III depicts Low Importance and Low Performance. Finally, Quadrant IV depicts Low Importance and High Performance.
Of all the three factors under study, only Factor II – Benefit Factor lies in the Quadrant I and Quadrant II, the High Importance quadrants of the Importance Performance Analysis (IPA) Matrix. Whereas the other two factors, Factor I – Transaction Factor and Factor III – Composition Factor are positioned in the Quadrant III and Quadrant IV, the Low Importance quadrants of the Importance Performance Analysis (IPA) Matrix. Thus, we may state that Benefit factor is a high importance factor and plays a very important role when consumers purchase their hair oil brands.
From Figure 2 we can see that, in Quadrant I there is one (1), which is Hair and Care II (2.40, 4.62) on factor II Benefit factor. In Quadrant II, we have three (3) points; they are Parachute II (3.46, 4.62), Nihar Amla II (3.87, 4.62) and Clinic Plus II (4.70, 4.62) on Factor II - Benefit Factor. Quadrant III has six (6) points, which are Hair & Care I (2.63, 4.28), Parachute I (3.08, 4.28) and Nihar Amla I (3.19. 4.28) on factor I – Transaction Factor; and Hair & Care III (2.73, 4.25), Parachute III (3.09, 4.25) and Nihar Amla III (3.30, 4.25) on Factor III – Composition factor. Quadrant IV has two (2) points, namely Clinic Plus I (4.04, 4.28) on Factor I – Transaction factor and Clinic Plus III (4.49. 4.25) on Factor III – Composition factor.
The multinational brand Clinic Plus has performed well on Factor II – Benefit Factor, which is rated as High Importance factor. The other two brands performing highly on the High Importance factor Benefit factor are Nihar Amla and Parachute. Meanwhile, Hair & Care is performing very lowly on this High Importance factor. Benefit factor comprises of the following attributes: Suits the Hair, Better shine, Adds Bounce & Body, More Manageable and Relieves Dryness.
Clinic Plus performed very highly on Transaction Factor and Composition Factor, although they are rated as Low Importance factors by the respondents. Parachute, Nihar Amla and Hair & Care are low performing brands on Factor I – Transaction Factor comprising the attributes Price, Advertisements, Packaging, Availability, Promotional Scheme, and Display at the Shop, and Factor III – Composition Factor comprising the attributes Quality, Contents, Fragrance and Consistency. These two factors were rated as Low Importance factors by the respondents.
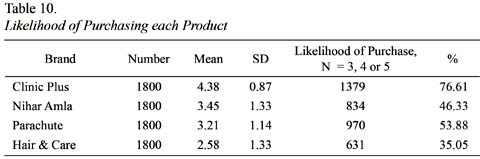
The leadership position of Clinic Plus is also reflected in the results for respondents stated likelihood of purchasing each brand within the next year. This is presented on Table 10. Also highlighted is the number of respondents who indicated a score above the scale midpoint. It can be seen that Clinic Plus performs strongest for this item, again consistent with the IPA performances. Clinic Plus is closely followed by Parachute and Nihar Amla, which is also consistent with the result of IPA.
CONCLUSIONS
The research presented here has attempted to provide an insight into the issue of Brand Positioning within the general domain of business marketing. In this respect Importance Performance analysis has been applied to understand the positioning strategies in the FMCG sector of the Indian economy. This research has primarily focused on importance and performance of product brands from the consumers perspective, rather than product brands as perceived by other market operators.
Through this research we have been able to identify the underlying factors on the basis of which consumer perceptions are developed, which can be of immense use for marketing managers. By looking at the results of factor analysis, it was noted that for hair oils there are three prominent factors that affect consumers purchases. These are as follows:
Factor I- Transaction Factor
Factor II- Benefit Factor
Factor III- Composition Factor
These three factors consist of following attributes.
I Transaction Factor.
-
Price
-
Advertisement
-
Packaging
-
Availability
-
Promotional Scheme
-
Display at the shop
II Benefit Factor
-
Suits the hair
-
Better shine
-
Adds Bounce & Body
-
More Manageable
-
Relieve Dryness
III Composition Factor
-
Quality
-
Contents
-
Fragrance
-
Consistency
By understanding which Factors comprise of which attributes, it is easier for the marketer to understand on which attributes to concentrate on and find out how it is going to affect the related factor. Thus, marketers, while making strategies for their brand of hair oil, should concentrate on these factors. They should concentrate on how to differentiate their brand from the other brands available in the market on the basis of these three factors. By finding out the three different factors that affect the purchases of different hair oil brands available in the market, it has become easier for the marketer to build strategies accordingly and see whether concentrate on any one of the identified factors or on all three.
Thus, we can safely conclude that the Factor analysis has contributed to a large extent in helping us to achieve our objective and determining the important factors on the basis of which consumer perceptions are developed and the purchases made by them of different hair oil brands .It is seen that amongst different attributes of hair oils Suits the Hair, Adds Bounce & Body and Better Shine are placed on the top three positions. Thus, it can be construed that the Benefit factor is the most important factor for consumers while purchasing hair oil.
IMPLICATIONS
The results of this research have provided us with strong evidence that the increased performance of brands in terms of the desired characteristics lead to greater acceptability of the brands. Effective positioning requires a succinct, focused, and consistent message. Positioning analysis requires an understanding of how a brand is perceived to perform on attributes deemed important to the target, relative to the competition. Therefore, positioning a multi attributed brand in dynamic and heterogeneous markets presents a significant challenge for companies. It has been seen that two very important implications of positioning theory confront the present day marketers, First, which attributes of brand should be emphasized upon while positioning the brands in the minds of the target segments and second, how to counter the positioning strategies of the competitors. Thus, it becomes imperative for the marketers to understand the fact that whether one succinct and focused brand positioning theme will consistently meet the needs of all target markets or do they need to go for a change.
This investigation of the positions held by a competitive set of brands in Hair Oil market features a comparison of cognitive positioning technique. It is suggested that this method of positioning analysis offers a practical means for marketers faced with the challenge of identifying the one or few features from their diverse and multi-attributed product range that could be developed by them to differentiate their brand in a meaningful way to consumers. Conceptually, the alignment of the factor analytic IPA provided an alternative option for brand positioning analysis. The extension of the IPA technique to incorporate dimensions derived from factor analysis has contributed to an enhanced understanding of the suitability IPA for brand positioning analysis. The factor analytic IPA proved effective in identifying the positions of the competitive set of four hair oil brands. The findings demonstrate the importance of analyzing a brands competitive position from the demand perspective. In order to enhance positioning effectiveness, it is recommended that marketers should have the clear understanding of the benefits being sought by the target market and the relative performance of the competitive brands. Marketers also need to understand the attributes of their brands, which are determinant towards the success of the brands in the markets. They should also have effective performance measures in place to track the effectiveness of their brands over a period of time and also remain in touch with the changing needs of the target audience.
The basic intent of this research was to identify how brands are positioned in market. A brands image study is undertaken in isolation, while positioning analysis requires a frame of reference with competing brands. Therefore, perceptions of brand or brands image should not be taken to represent a brands market position. At the core of strategic planning is competition (Porter, 1979). Competitors are part of the external macro – environment, over which organizations have no control. A marketing manager will have no control over the marketing initiatives or product developments of competing brands. However, the marketing manager does have some control over the selection of which brand to compete with in various target markets. It is suggested that effective positioning analysis enables this. In calling for new paradigm in brand marketing, it is suggested that there is a need for brands to move from broad based marketing to more targeted and customized positioning. Positioning should be the platform from which all the marketing managers other activities should flow. Clearly, this has implications not only for advertising but also for educating stakeholders and stimulating consistent delivery. After all, the promised position must be delivered. The following strategies are recommended to marketing managers to enhance positioning effectiveness:
-
an understanding of the benefits sought by the target market and the relative performances of the competitive set of brands;
-
trade-offs for a focused positioning strategy based on determinant attributes;
-
implementation to cut through and stimulate intent (demand);
-
the delivery and monitoring of benefits offered by the position; and
-
staying in touch with target audience needs.
CONSTRAINTS OF THE STUDY
The study underwent through the following constraints:
-
Multinational company Hindustan Unilever Limited has operations in other countries also and the brands under study are being sold in those countries as well. But, the researcher, due to lack of funds, could not interview consumers/customers in these countries.
-
Some times the respondents did not fill the questionnaire immediately when they were told about the study and the brands under study. They sent their completed questionnaires through mail. It is possible they would have lost the idea about the study when they actually sat to respond the document.
-
The research did not include the rural population and the lower socioeconomic classes of the urban Indian population as the available secondary information showed that penetration of branded products is negligible. This might act as a handicap of this study as the ground realities might be different.
-
Perceptual mapping provides only a partial explanation of consumers perceptions, based on attributes and alternatives included in the study.
REFERENCES
Aaker, D. A. (1996). Building strong brands. New York: The Free Press.
Aaker, D. A., & Shansby, J. (1982). Positioning your product. Business Horizons, 25(May/June), 56-62.
Arnott, D. C. (1993). Positioning: Redefining the concept. Warwick Business School Research Papers, 81, 24-25.
Arnott, D. C. & Easingwood, C. J. (1994). Positioning in services: A hypothetical typology of competitive bases. In 23rd EMAC Conference Proceedings (pp.1-3). Maastricht, The Netherlands: University of Limburg.
Asian Development Bank. (2004). Investing in ourselves: giving and fund raising in India. (Report). Retrieved March 2006, from http://www.adb.org/documents/books/Investing_In_Ourselves/IND
Belk, R. W. (1975). Situational variables and consumer behaviour. Journal of Consumer research, 2, 157–164
Blankson, C., & Kalafatis, S. P. (2004). The development and validation of a scale measuring consumer/customer-derived generic typology of positioning strategies. Journal of Marketing Management, 20, 5-43
Brand Equity. (2001). Indias most trusted brands – rankings overall, by population strata, by demographics and by regions. The Economic Times, (July), 1-4.
Brooksbank, R. (1994). The anatomy of marketing positioning strategy. Marketing Intelligence & Planning, 12(4), 10-14.
Chacko, H. E. (1997). Positioning a tourism destination to gain a competitive edge. Asia Pacific Journal of Tourism Research, 1(2), 69-75.
Clarke, D. G. (1982). Case: Johnson Wax: Enhance (A). Harvard Business Review, 25 (Oct)
Clarke, D. G. (1983). Case: Johnson Wax: Enhance (B). Harvard Business Review, 25 (Oct)
Clement, M., & Werner-Grotemeyer, H. (1990). The iterative positioning process: An international approach from the pharmaceutical industry. Marketing and Research Today, 85-96.
Devlin, J., Ennew, C., & Mirza, M., (1995). Organizational positioning in retail financial services. Journal of Marketing Management, 14, 117-25.
Dovel, G. P. (1990). Stake it out; positioning success, step by step. Business Marketing, (July), 43-51.
Fill, C. (1999). Marketing communications, context, contents and strategies. (2nd ed.). Hemel Hempstead, UK: Prentice-Hall.
Fishbein, M. (1967). Readings in attitude theory and measurement. New York: John Wiley & Sons.
Fishbein, M., & Ajzen, I. (1975). Beliefs, attitude, intention and behaviour: an introduction to theory and research. Reading, MA: Addison Wesley.
Fisher, R. J. (1991). Durable differentiation strategies for services. The Journal of Services Marketing, 5(1), 19-28.
Grant, R. M. (2005). Contemporary strategy analysis. (5th ed.). Oxford: Blackwell Hall.
Green, P. E., & Rao, V. R. (1972). Applied multidimensional scaling: a comparison of approaches and algorithms. New York: Hold, Rinehart and Winston.
Gwin, C. F., & Gwin, C. R., (2003). Product Attributes Model: A Tool for Evaluating Brand Positioning. Journal of Marketing, 11(2)30-42.
Hauser, J. R., & Wisniewski, K. (1979). Consumer analysis for general travel destination (Technical Report). Evanston IL: Northwestern University, Transportation Center.
Hauser., R, J., & Urban, G. (1977). A Normative Methodology for Modeling Consumer Response to Innovations. Operations Research, 25, 579-619.
Hauser, R, J., & Koppelman, F. S. (1979). Alternative perceptual mapping techniques: relative accuracy and usefulness. Journal of Marketing Research, 1, 495-506.
Hooley, G., Greenley, G., Fahy, J., & Cadogan, J. (2001). Market-focused resources, competitive positioning and firm performance. Journal of Marketing Management, 17(5-6), 503-20.
Howard, J. A. & Sheth, J. N. (1969). The theory of buyer behavior. New York: Wiley.
Huber, J., & Holbrook, M. B. (1979). Using attribute ratings for product positioning: some distinctions among compositional approaches. Journal of Marketing Research, 16, 507-15.
Kaiser, H. F. (1974). An index of factorial simplicity. Psychometrika, 39, 32–36.
Kapferer, J. N. (2004). The strategic brand management – creating and sustaining brand equity long term. London and Philadelphia: Kogan Page.
Kotler, P. (1997). Marketing management: analysis, planning, implementation and control. Upper Saddle River, N. J.: Prentice-Hall International.
Kotler, P., & Keller, K. L. (2006). Marketing management. (12th ed.). New Jersey, N. J.: Pearson Prentice Hall.
Kumar, S. R. (2007). Marketing and branding – The Indian scenario. Patparganj, Delhi, India: Dorling Kindersley Pvt. Ltd.
Lancaster, K J. (1966). A new approach to Consumer Theory. Journal of Political Economy, 74, 132 - 57.
Lancaster, K. J. (1971). Variety, equity and efficiency. New York: Columbia University Press.
Lancaster, K. J. (1979). Consumer demand: A New Approach. New York: Columbia University Press.
Levitt, T. (1986). The marketing imagination. New York: Simon & Schuster Inc.
Lovelock, C. H. (1991). Services marketing. Englewood Cliffs, NJ: Prentice-Hall Inc.
Martilla, J. A., & James, J. C. (1977).
Importance – Performance Analysis. Journal of Marketing, 2(1), 77-79.McAlexander, J. B., Becker, D., & Kaldenberg, D. (1993). Positioning health care services: Yellow Pages advertising and dental practice performance. Journal of Health Care Marketing, 13, 54-57.
McKenna, R. (1986). The Regis Touch: New marketing strategies for uncertain times. Reading, MA: Addison-Wesley Publishing Company.
Morton, J. (1994). Predicting brand preference. Marketing Management, 2(4), 32-44.
Park, C. W., Jaworski, B. J., & MacInnis, D. J. (1986). Strategic brand concept – Image management. Journal of Marketing, 50, 621-35.
Pike, S., & Ryan, C. (2004). Destination positioning analysis through a comparison of cognitive, affective, and conative Perceptions. Journal of Travel Research, 42, 333-42.
Porter, M. E. (1979). How competitive forces shape strategy. Harvard Business Review, (March - April), 137-145.
Porter, M. E. (1996). What is strategy? Harvard Business Review, (Nov/Dec), 61-78.
Rao, V. R. & Steckel, J. H. (1998). Analysis for strategic marketing. Reading MA: Addison- Wesley.
Ries, A. & Trout, J. (1986). Positioning, the battle for your mind. (Rev. ed.). New York: McGraw-Hill.
Ryan, C. (1991). Recreation tourism: A social science perspective. London: Routledge.
Soundararaj, J. J., & Rengamani, J. (2002). The inevitability of Positioning in the present marketing scenario. Indian Journal of Marketing, 32, 3-5.
Sweeney, J. C., & Soutar, G. N. (2001). Consumer perceived value: the development of a multiple item scale. Journal of Retailing, 77, 203-20.
Trout, J., & Rivkin, S. (1996). The New Positioning: the latest on the Worlds #1 business strategy. New York: McGraw-Hill.
Urban, L. G., & Hauser, R. J. (1993). Design and marketing of new products. (2nd ed.). Englewood Cliffs, NJ: Prentice Hall.
Webster Jr., F. E. (1991). Industrial marketing strategy. (3rd ed.). New York: John Wiley & Sons, Inc.
Wright, M. (1997). When Strength Means Death. Brand Strategy, 107, 3-5.
Received date: June 30, 2010
Accepted date: August 18, 2010
