


Services on Demand
Journal

Article
 English (pdf)
 Article in xml format
 Article references
 Send this article by e-mail
Indicators
-
 Cited by SciELO
Related links
-
 Similars in
SciELO
Similars in
SciELO
Share

 Permalink
Journal of Economics, Finance and Administrative Science
Print version ISSN 2077-1886
Journal of Economics, Finance and Administrative Science vol.15 no.29 Lima Dec. 2010
ARTICLES
Re-Engineering Agriculture For Enhanced Performance through Financing*
Restructurando la agricultura para aumento de rendimiento a través del financiamiento
Taiwo Mafimisebi1 ; Adegboyega Oguntade2 ; Ojuotimi Mafimisebi3
* The authors wish to gratefully acknowledge The World Bank for their financial support to deliver a first report on this study in its conference on "Partial Credit Guarantees: Principles and Practice", which took place in The World Bank Main Building, Washington DC, March 13th – 14th, 2008.
1. Ph. D. in Agricultural Marketing/Agribusiness Management, Department of Agricultural Economics & Extension, The Federal University of Technology, Akure, Nigeria <temafis@yahoo.com>
2. Ph. D. in Agricultural Production/Agricultural Marketing, Department of Agricultural Economics & Extension, The Federal University of Technology, Akure, Nigeria, <oguntadeade@yahoo.co.uk>
3. M. Sc. in Agricultural Finance/Food Safety Economics, Department of Agricultural Economics, University of Ibadan, Nigeria.
Abstract
Insufficient institutional credit is a major contributor to the persistent poor performance of the Nigerian agricultural sector. To encourage financial institutions to increase lending to the sector, a partial credit guarantee scheme was instituted. The scheme commenced operations in 1978 with an authorized capital of N 100.00 million, subscribed to 60% and 40% by the Federal Government of Nigeria and the Central Bank of Nigeria, respectively. This paper presents an appraisal of the scheme. The results revealed that there has been continuous growth in paid-up share capital, total fund resources, maximum amount of loan obtainable by farmers, number and value of loans guaranteed, volume and value of loans fully repaid and volume and value of default claims settled. There was a long-run convergence between the number and volume of guaranteed loans and the agricultural GDP. This finding indicates the need to expand the quantum of funds available for guaranteeing agricultural loans to increase performance of the agricultural sector in the long run. This step is justified by the strategic role of agriculture in the Nigerian economy in terms of food and fiber production, job creation, income generation, poverty reduction and economic stability.
Keywords: Agricultural finance, credit guarantee, smallholders.
Resumen
El insuficiente crédito institucional es el mayor contribuyente al constante bajo rendimiento del sector agrícola en Nigeria. Para alentar a las instituciones financieras a que aumenten el préstamo en el sector, se ha instituido un esquema de garantía de crédito parcial. Este esquema inició sus operaciones en 1978 con un capital autorizado de N100.00 millones, suscritos en 60 % y 40 % por el Gobierno Federal de Nigeria y el Banco Central de Nigeria respectivamente. Este estudio presenta una apreciación de ese esquema. Los resultados revelan que se ha dado un crecimiento sostenido en el capital compartido pagado, total de recursos del fondo, el monto máximo de préstamo obtenible por los agricultores, número y valor de los préstamos garantizados, volumen y valor de los préstamos totalmente pagados y el volumen y valor de los reclamos por mora resueltos. Se observó una gran correlación entre el número y el volumen de préstamos garantizados y el PBI agrícola. Este resultado indica la necesidad de aumentar la cuantía de los fondos disponibles que garanticen los préstamos agrícolas para aumentar el rendimiento del sector agricultura en el largo plazo. Este paso está justificado por el papel estratégico de la agricultura en la economía nigeriana en términos de producción de comida y fibra, creación de trabajo, generación de ingresos, reducción de la pobreza y la estabilidad económica.
Palabras claves: Finanza agrícola, crédito garantizado, pequeños agricultores.
INTRODUCTION
Agriculture is still a dominant sector of the Nigerian economy. From the early 1950s to the early 1970s, the sector was a source of employment to about 80% of the labour force (World Bank, 1993; Upton, 1997). Agriculture generated foreign exchange earnings used in financing development projects in other sectors. Abundant and affordable food emanated from agriculture for both domestic consumption and export during this period. This ensured a highly stable economy with a low rate of inflation (Nigerian Institute of Social & Economic Research (NISER), 2003).
However, starting from the early 1970s when Nigeria began to export crude oil, the importance of agriculture began to wane. Attention virtually shifted to the oil sector, which progressively accounted for the bulk of foreign exchange earnings. As a result of inflow of «petrol dollars», Nigeria increasingly relied on importation of food and agricultural raw materials instead of investing in and strengthening the agricultural sector. This marks the decline of this sector as an engine of economic growth. The reason given was that returns from agriculture were far lower compared to other sectors (NISER, 2003). In spite of the underfunding, which makes Nigerian agriculture largely traditional, subsistent and very low in the use of productivity-boosting technologies, it remains an important economic driver contributing about 42% to the nations GDP (Njoku, 2010). About 70.3% of the rural and 34.8% of the urban poor are engaged in direct, on-farm agricultural production (NBS, 2006). The overriding importance of agriculture to the Nigerian economy is revealed by the fact that despite oil and gas accounting for over 80% of the nations revenue, the contribution of this sector to the GDP is only 23% (Njoku, 2010). Agricultural loans were regarded as low-yielding, high-risk loans with towering administrative costs and consequently unattractive to grant (Coster, 1998). The problem of under-funding of the agricultural sector continued to aggravate to the extent that by the late 1970s, Nigeria had become a net importer of many of the major food items it was exporting before. Thus, the oil boom of the late 1970s brought in its wake the agricultural doom, which Nigeria has been battling to reverse in the last three decades (Mafimisebi et al., 2008). The unbridled importation of goods, especially food commodities and its attendant demand on the countrys foreign account, also placed the balance of payment in a precarious position (NISER, 2003).
The poor performance of the agricultural sector, which was first noticed about three decades ago, worsened through inadequate capital investment that culminated in the vicious circle of low farm size, low uptake of productivity-boosting technologies, low output, low income and low farm size (Mafimisebi, et al., 2006, 2008). This magnified the prevalence of small-scale farmers, regarded as highly unorganized and poor in resource endowment and managerial skills (Akinwunmi, 1999). To remedy the problem of persistent low performance of the agricultural sector, the need for capital injection into agriculture became obvious (Olayemi, 1999; Udoh et al., 2002; Mafimisebi et al., 2006, 2008).
In recognition of the indispensable role of credit in engendering the development of Nigerian agriculture, the government established the Nigerian Agricultural Co-operative Bank (NACB) in 1973, which in 2003 became the Nigerian Agricultural Credit and Rural Development Bank (NACRDB). Within a couple of years, the institution was burdened with very poor loan recovery rate (Kabir, 1985; Balogun & Otu, 1991; Dittoh, 1992; Coster, 1998; George, 2002). Further efforts targeted at providing institutional credit for agricultural purposes and bridging the credit gap included mandating commercial banks to open branches in rural areas for easy and enhanced access to credit by farmers. In addition to this, commercial and merchant banks were also mandated by the Central Bank of Nigeria (CBN) to commit 15% and 8% respectively of their loan portfolios to agriculture. Despite these laudable and potentially workable policies, availability of institutional credit to farmers remained a mirage. The major reason for this circumstance was the high default rate of agricultural loans occasioned by low returns compared with other sectors. The problem grew to such an alarming dimension that many commercial banks deliberately refused to comply with the directive and opted to pay the prescribed fines for non-compliance. The persistent problem of paucity of formal credit has been reported by numerous researchers to be responsible for peasant farmers extensive patronage of traditional lending institutions, which are characterized by very low credit volume, usurious interest rates, and brutal and dehumanizing treatment of borrowers in cases of default. The positive sides of the traditional lending institutions, however, are their simplicity of borrowing procedure, timeliness of credit disbursement and waiver of collaterals (Adekanye, 1993; Aryeetey, 1995; Mafimisebi et al., 2006).
The persistent failure of the conventional and specialized banks to adequately finance agricultural activities in the mid 1970s was an indication that the country needed further financial and institutional support that would revitalize and reposition the agricultural sector by encouraging the flow of institutional credit into it. Given the risky nature of farming, the importance of agriculture to the national economy and the increasing demand by lending institutions for appropriate risk aversion measures in agricultural lending, the Federal Government of Nigeria established the Nigerian Agricultural Credit Guarantee Scheme Fund (ACGSF) in 1977.
The remaining part of this paper is organized as follows. Section II presents the materials and methods. In section III, we present the results and discussion, while the lessons learned from the Nigerian ACGSF are contained in section IV. The conclusion and recommendations arising from the study are to be found in section V.
METHODOLOGY
Types and sources of data
In carrying out the performance appraisal, we considered the following indices: (a) authorized and paid-up share capital of the ACGSF; (b) the Funds capital base; (c) the maximum amount of loan obtainable by various categories of participants; and, (d) the number and value of loans guaranteed by category of borrowers. Other indices considered include (a) the volume and value of fully repaid loans, and (b) volume and value of default claims. Wherever data were available, the growth rates of these variables were computed. The time-series data collected covered 1978 to 2005.
Analytical method
The time-series data (1978-2005) collected were analyzed with a combination of statistical techniques which includes
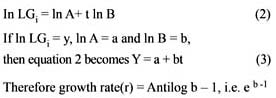
(i) The exponential growth function: The exponential growth function was used to examine the rate of growth in key variables relating to the operations of the ACGSF over the time period covered by the study. These variables are paid-up share capital and total asset of the scheme, number of loans guaranteed and volume of loans guaranteed. The function is defined as:

Where LGi = number or value of loans guaranteed for the ith purpose in the crop and livestock sub-sectors; t = time trend in years; A and B are the parameters to be estimated; i = the 12 sub-sectors of crop and livestock included in the analysis.
To estimate growth rate, equation 1 was converted to the linear form
(ii) Multiple Co-integration: This was used to determine whether or not there is a long-run relationship between agriculture Gross Domestic Product (GDP) regarded as a proxy for agricultural production and some credit-related factors following what was done earlier by Mafimisebi (2004).
The credit-related factors used in the co-integration analysis include
-
Federal Government recurrent budget on the agricultural sector (FGRECBA);
-
Federal Government capital budget on the agricultural sector (FGCAPBA);
-
Total volume of loans to the agricultural sector by commercial and merchant banks (TVLACMB);
-
Total number of loans guaranteed by the ACGSF (TNLGUAD);
-
Total value of loans guaranteed by the ACGSF (TVLGUAD);
-
Lending rate to the agricultural sector (LENRAGS in %);
-
Food importation bill (FOODIMB);
-
Cumulative number of fully repaid loans since Schemes inception (CNFRLSI); and
-
Cumulative value of fully repaid loans since Schemes inception (CVFRLSI).
As a first step, the graphs of the key time series were plotted to get a visual representation of the movement of the series over time. Owing to information from the growing literature on the characteristics of time-series data especially that relating to non-stationarity, which leads to spurious regression estimates, we first investigated the order of stationarity (or econometric integration) using the Dickey Fuller (DF) and the Augmented Dickey Fuller (ADF) class of unit roots test as done by Mafimisebi (2002a, 2007, 2008). The DF test is applied to the regression of the form below.
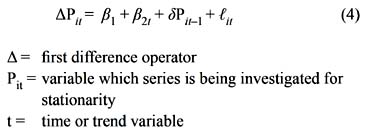
The null hypothesis that δ = 0 implies existence of a unit root in Pit or that the time series is non-stationary. The number of lagged difference terms in equation 4 was increased. The DF test is, in this particular case, called the ADF test and equation 4 modifies to
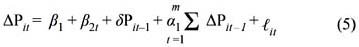
The null hypothesis of a unit root or non-stationarity is still that δ = 0. The critical values are as tabulated by Dickey and Fuller (1979), Engle and Yoo (1987) and Mackinnon (1990).
When a series was found to be non-stationary, it was first-differenced and the ADF test was repeated. The time series for all the agricultural credit-related variables included in this study were investigated for their order of integration. The maximum number of lags used in the stationarity test was six (6) and the optimal lag for each time-series was selected using the Akaike Information Criterion (AIC).
Two or more variables are said to be co- integrated if each is individually non-stationary but there exists a linear combination of the variables that is stationary. Other attributes of co-integration are as shown in Engle and Yoo (1987) and in Silvapulle and Jarasuriya (1994). After the stationarity test, the analysis proceeded by testing for co-integration between time-series of agricultural credit-related variables that exhibited stationarity of same order.
For the multiple co-integration test, the maximum likelihood procedure for co-integration, propounded by Johansen (1988), Johansen and Juselius (1990, 1992) and Juselius (2006), was utilized. Adopting a one-step vector auto-regression (VAR) method avoids the simultaneity problem characteristic of the Engle and Granger procedure (Baulch, 1995) and allows hypothesis testing on the co-integration vector, r. The maximum likelihood procedure relies on the relationship between the rank of a matrix and its characteristic roots. The Johansens maximal Eigen value and trace tests detect the number of co-integrating vectors that exists between two or more time-series that are econometrically integrated. The two variable systems were modelled as a VAR as follows:
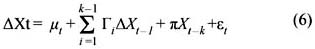
where:
Xt is an n x 1 vector containing the series of interest (time-series of agricultural credit-related variables)
Γ and π are matrices of parameters
k = number of lags and should be adequately large enough to capture the short-run dynamics of the underlying VAR and produce normally distributed white noise residuals.
εt = vector of errors assumed to be white noise.
RESULTS AND DISCUSION
Structure, Organization and Mandate of the Scheme
The Nigerian ACGSF (henceforth the Scheme or the Fund) was set up in 1977. Its purpose was to serve as an inducement to banks to increase and sustain lending to agriculture. Under the Scheme, bank loans to farmers are guaranteed 75% against default. Thus, the Scheme is a partial credit guarantee type and largely a subsidization program. When a borrower defaults, the CBN, the Managing Agent for the Scheme, remits to the participating lending bank (PLB) 75% of the amount in default, net of any amount realized by the bank from the security pledged (where applicable) by the farmer. The Board of Directors responsible for managing the Scheme does this after careful verification and approval. Verified defaults are settled by the CBN from a fund set up for the purpose. At the commencement of operations by the Scheme on April 3rd, 1978, the authorized capital of the Fund was N 100 million, subscribed to 60% and 40% by the FGN and CBN, respectively. The proportion of the authorized capital paid up as at the time operations commenced was N 85.5 million.
For the purpose of administering the Scheme, the country was divided into four zones. Zoning and the use of the branch/desk offices of the NACB as loan application form collection and submission centres allow reasonable access to Schemes operations by farmers.
Since the Fund is resident in the CBN, there are no separate administrative structures needed for it to function. This is probably made possible by the fact that the PLBs have institutionalized procedures and mechanisms of regularly meeting with the authorities of the CBN for purposes other than that relating to Fund administration. This has made the Scheme less costly to run in terms of overhead compared with other government-sponsored programs. Up to December 1986, when Nigeria adopted an economy-wide reform tagged Structural Adjustment Programme (SAP), loans to agriculture by PLBs were granted at concessionary interest rates.
The activities being funded under the Scheme have witnessed little or no modifications since inception and they cover all sub-sectors of Nigerian agriculture.
The Nigerian Credit Guarantee Scheme – A performance appraisal
The findings from the empirical analyses are discussed as follows.
a) Paid-up share capital and total asset of the Scheme
The N 85.5 million paid-up capital at commencement of operations in April 1978 increased to N 147.4 million ten years later as a result of investing it in government securities. The exponential growth rate analysis revealed that this represents an annual growth rate of about 7.24%. Ten years later (December 1998), the Schemes paid-up capital had increased to N 1.78 billion, which implied annual growth rate of 18.34%. By December 31st, 2005, the paid-up capital stood at N 2.5 billion. The annual growth rate in this seven-year period (1998-2005) was 5.06%. The high growth rate between the period 1988 and 1998 is probably to compensate for the high rate of inflation witnessed during this period. The mean annual growth rate of paid-up share capital for the period reviewed (1978-2005) is about 10.21%. Of the N 2.5 billion paid-up share capital as at end-December 2005, the CBN had fully paid up its share of N 1.33 billion. The FGN was yet to make a full payment of its share subscription and has consistently defaulted in this respect since inception of the Scheme. The total resources of the Fund as at end-December 2004 stood at N 4.4 billion. By 2005, total Fund resources had increased to N 4.7 billion.
To increase the financial resources of the Scheme, the CBN initiated the Trust Fund Model (TFM) in 2001. Under the model, state and local governments, multinational oil companies and non-governmental organizations (NGOs) were persuaded to augment the ACGSFs capital base by placing their con-tributions with the PLBs. At the end of December 2005, fifteen stakeholders had contributed to the Scheme through the model. From the TFM model, the total amount deposited with PLBs stood at N 1.6 billion (CBN, 2005). Also, three PLBs joined the Scheme in 2004 bringing the number of participating banks to eleven, up from eight in 2003. Thus, modest progress has been recorded in recent years in terms of widening participation in the Scheme.
b) Changes in loan ceilings under the Scheme
In tandem with rising Fund resources and reducing value of the naira due to inflation, there have been two upward reviews of the maximum amount of loans obtainable by various categories of participants in the Scheme. At inception in 1978, the maximum amounts of loans guaranteed under the Scheme were N 5,000 for small-scale farmers, N 100,000 for individual large-scale farmers and N 1.0 million for co-operative societies and corporate bodies. Loans for small-scale farmers are usually uncolla-teralized. By 1998, the ceiling on loanable funds was reviewed upward to N 20,000, N 0.5 million and N 5.0 million for small-scale farmers, large-scale farmers and cooperatives/corporate bodies, respectively. Further review carried out in 2002 increased the limit for collateralized loans from N 0.5 million to N 1.0 million for large-scale farmers while that of co-operative societies and corporate bodies was raised to N 250 million from N 5 million. Non-collateralized loan for individual small-scale farmers remained at N 20, 000.
c) Number of loans guaranteed
Over the years, there had been increases in the number of loans guaranteed under the Scheme. At the end of 1988, a total of 20,284 loans had been guaranteed. A total of 20,659 loans were guaranteed in 1998 alone, while in 2003, 2004 and 2005 a total of 24,273, 35,035, and 46,238 loans were guaranteed respectively. The exponential function analysis indicates this growth in the number of loans as an annual increase of 34.6%.
d) Volume of loans guaranteed
In response to the persistent upward review in the authorized and paid-up capital of the Scheme and the upward trending maximum loan obtainable by farmers, there had also been increases in the value of loans guaranteed under the Scheme. The value of loans guaranteed in 1988 was N 90.8 million, which represented 21.6% of the total of N 420 million from inception to 1988, and a 54.6% increase over the level in 1987. By 1998, the Scheme had guaranteed loans valued at N 1.5 billion. By 2002, loans valued at N 1.8 billion had been guaranteed. In 2002, 2003, 2004 and 2005, loans of N 1.1 billion, N 2.1 billion, N 2.6 billion and N 3.1 billion respectively were guaranteed. The exponential growth function analysis shows that the annual growth rate of the volume of loans guaranteed between 1978 and 2005 was 44.6%.
e) Distribution of loans by size and term structure
In terms of size of loans, small-scale farmers predominate in the Scheme. In 1988, 80.7% of the number of loans guaranteed went to small farmers who borrowed N 5000 and below, as compared to 72.4% in 1986 and 75.1% in 1987. Farmers who borrowed between N 5000 and N 50,000 accounted for about 16.9% while 24.0% went to co-operatives/companies borrowing between N 50,000 and N 1.0 million. In 1986 and 1987, the last two categories of farmers received an average of 22.5% and 2.4% of the number of loans, respectively. In 1998, and in the last three years of the Scheme, the distributions described above have not changed considerably. In 2004, for example, loans within the range of N 20,000 to N 100,000 accounted for 87.2% of a total of N 2.1 billion. In 2005, out of 46,238 guaranteed loans valued at N 3.1 billion, 28,070 or 60.7% went to small-scale farmers. This accounted for about 65.5% (or N 2.03 billion). This implies that banks were persuaded by the Scheme to lend to small-scale farmers, especially those borrowing N 20,000 and below, without demanding tangible securities.
In terms of categories of borrowers, at the end of 1988, 96.1% of total guaranteed loans went to individuals, 1.3% went to co-operative societies and 2.3% went to corporate bodies. Looking at value of guaranteed loans received, individuals, co-operatives and corporate bodies received 37.5%, 1.6 % and 60.9% respectively. In 1998, and particularly in the last three years covered by this review, there has been no change in this distribution pattern. For example, in 2004 individual borrowers dominated the Scheme with the number and values of loans guaranteed amounting to 34,912 and 2.0 billion representing 99.6% and 96.5% of the total, respectively. In 2005, individual borrowers accounted for 99.0% and 97.5% respectively of the total volume and value of loans guaranteed. Co-operative societies accounted for 0.3% and 1.0%, while corporate bodies took the balance.
Considering term structure of loans, short-term loans of less than three years duration continue to dominate the lending procedure under the Scheme from inception. At the end of December 1988, such loans accounted for 97% of total loans guaranteed. Medium term loans that matured between three and five years constituted 2.8%, and those falling due in over five years, took 0.2%. This is comparable to the situation in 1987 when short, medium and long-term loans accounted for 96.5%, 3.1% and 0.4% respectively of the total number of loans guaranteed. This distribution pattern has not changed considerably at the end of December 1998 and in the last three years of the Scheme, for which the average distribution was 94.6%, 4.4% and 1.0%, respectively.
f) Econometric integration and co-integration
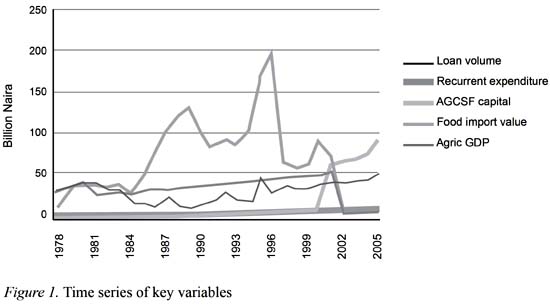
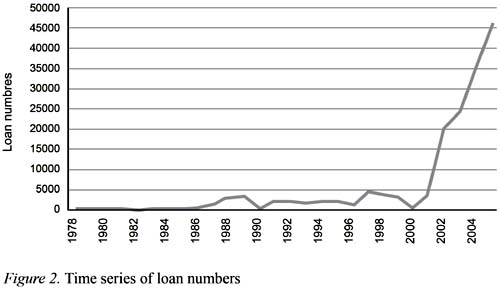
Figures 1 and 2 are the plots of the key time series, namely: loan volume, recurrent expenditure, ACGSF capital, value of food imports, agricultural GDP and number of loans granted under ACGSF. With exception of loan volume, the first impression that one gets from these graphs is that the time series seem to be «trending» upwards albeit with fluctuations.
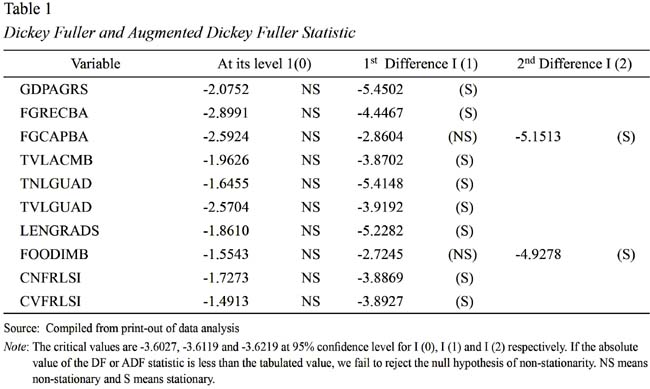
The Dickey Fuller and Augmented Dickey Fuller class of unit root tests were applied to the natural logarithms of each variable over the period between 1978 to 2005 with an intercept and a linear trend.
As shown on Table 1, all the variables accepted the null hypothesis of non-stationarity at their levels at the 5% significance level. On first-differencing, however, the null hypothesis of non-stationarity was rejected in favour of the alternative by all the variables except FGCAPBA and FOODIMB. These variables were only stationary on second- differencing. They were, therefore, not included in the co-integration analysis since they could not be integrated with the others because these variables were generated by different stochastic processes (Baffles, 1991; Baulch, 1997; Franco, 1999; Mafimisebi, 2002a, 2007). Consequently, using the Akaike Information Criterion (AIC), the lowest values of the AIC were used to get the optimal lag and the ADF statistics at the optimal lag were compared with the critical values at 95% confidence level.
The result of the multiple co-integration analysis between GDP and the remaining seven, other time series show that there were at least six co-integration equations at the 5% significance level using the maximal eigenvalue of the stochastic matrix. Table 2 presents the maximal eigenvalue test of the null hypothesis showing that there are at most r co-integrating vectors (r<0) against the alternative of one co-integrating vector (r =1). The test statistics (185.5385) is greater than the 95% critical value (55.1400), leading to the rejection of the null hypothesis and indicating that there is at least one co-integrating vector. The null hypotheses of r<1, r<2, r<3, r<4, r<5 against their respective alternatives (i.e. r=2, r=3, r=4, r=5 and r=6) were also rejected at their respective 95% critical values (i.e. 49.3200, 43.6100, 37.8600, 31.7900 and 25.4200). However, the null hypothesis of r<6 against the respective alternative (r=7) could not be rejected at the 95% critical value, suggesting that there are six co-integrating equations.
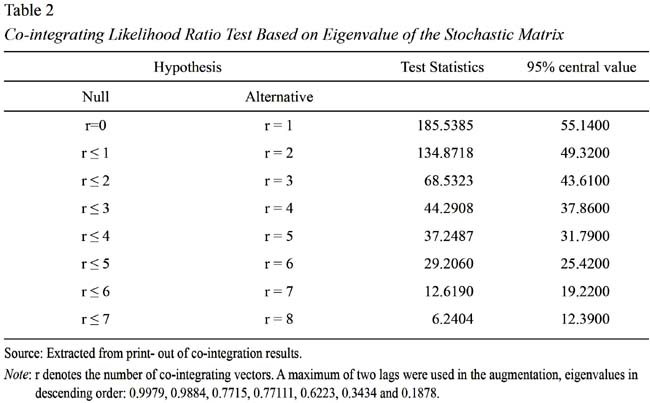
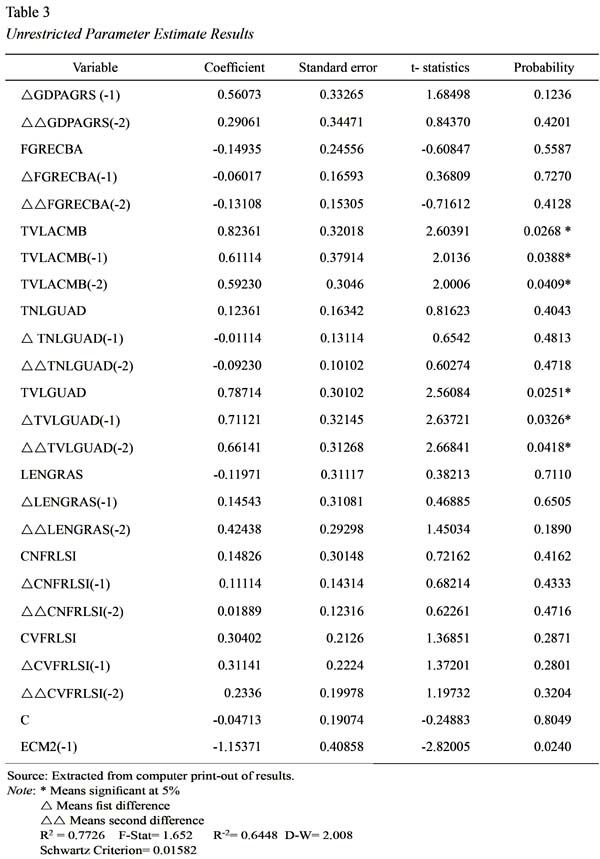
Table 3 presents the long run unrestricted error correction results for the variables. It shows that only TVLGUAD and TVLACMB were significant at 5% while the other variables were not significant, even at 10% significance level. All the variables, except TNLGUAD and CNFRLSI, had expected signs and conformed to the a priori prospects and were thus consistent with economic theory. In order to get the restricted parameter estimate, the variable with the lowest probability value was removed one after the other and the test re-run after that. For the first test, FGRECBA (-1) with a probability value of 0.7270, was removed. Consequently, variables were removed in decreasing order of magnitude. After the removal of a variable, the test was re-run before another variable was removed. After doing this, the long-run restricted model presented on Table 4 was obtained. The coefficient of determination, R2 is shown to be 0.5648. Thus, about 56.5% of variations in agricultural sector GDP can be explained by the independent variables TVLGUAD and TVLACMB. The Schwartz Information Criterion (SIC) improved from 0.01582 to -0.08751 implying that the restricted model carried more information. The F-statistic value was significant at 10%, while the DW statistic indicated no first order autocorrelation.
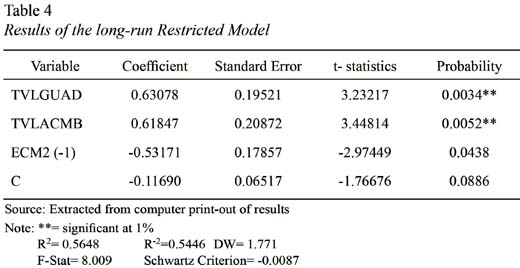
In the restricted model, TVLGUAD and TVLACMB were both significant at 5%. The error correction term (ECM) of 53.17% showed the rate of adjustment or feedback mechanism from short-run disequilibrium and it was significant at 5%. This result confirmed significant relationship between the output of the agricultural sector as proxied by the agricultural GDP, and total volume and value of loans guaranteed the agricultural sector. However, the effects of these two independent variables on agricultural GDP manifested a year after. This is understandable because agriculture has a gestation period. The equation for the restricted or under-parameterized model is then specified as follows:
DLOG (GDP) = -0.11069 + 0.63078 D
LOG (TVLGUAD) + 0.61844
D LOG(TVLACMB) -0.53171 ECM2(-1) (7)
From the econometric results, it was shown that the output of agriculture proxied by agricultural GDP is influenced to varying degrees by a number of factors. In the restricted model, the total number and volume of loans guaranteed to the agricultural sector were found to be the only significant factors determining GDP.
LESSONS LEARNED FROM THE NIGERIAN CREDIT GUARANTEE SCHEME
A number of lessons could be learned from the Nigerian ACGSF by other countries intending to institute similar programs. They are as follows:
-
The CBN and the FGN are the sponsors of the Scheme. While the CBN has been paying up its agreed contributions to the Fund, the FGN has persistently been lagging behind in paying up. Given that the FGN is the originator of the policy, it has not matched its action with its stated intention. This may give wrong signals to the states and local governments as well other corporate organizations that are now being invited to contribute to the Fund under the Trust Fund Model. This could be responsible for the slightly slow response to the invitation to participate in the Trust Fund.
-
The Nigerian economy has experienced inflation over the years. This has continuously been eroding the value of the Naira and hence the value of the Fund. This is what necessitated the upward review of the authorized and paid up capital as well as the ceilings for the loans that could be guaranteed for cooperatives/corporate organizations and individual large-scale farmers twice. The ceiling for small-scale farmers loan, which is not collateralized, was however only increased once.
-
There is a problem of backlog of unsettled claims, some of which span over twenty years. This is highly undesirable because it may erode the confidence of banks in the Scheme. This is probably responsible for the poor growth in the number of banks participating in the aforementioned program.
-
The design of the TFM makes it a social responsibility contribution of corporate organizations and hence not mandatory. At the same time, the TFM is not designed as a statutory responsibility for the state and local governments. As a result, the parties being targeted by the Trust Fund have not felt obligated to contribute to it. Since the TFM commenced as a framework for fund intermediation for agricultural purpose in 2001, only about 15 stakeholders, comprising 10 State Governments (out of 36), 3 multinational corporations and 2 NGOs, have adopted the model as of the end of December 2005, with a total deposit of N 1.6 billion. None of the 778 local governments have contributed to the Fund.
-
A major strong point of the Scheme is the easy access farmers enjoy. This was facilitated by the use of NACB offices, which exist in every state and local governments capital cities across the nation. They became the points for obtaining and submitting application forms
-
The overhead of the Scheme has been kept relatively low over the years. This was made possible by the use of existing structures of the CBN, commercial banks and the NACB to run the Scheme rather than creating a new structure for it.
CONCLUSION AND RECOMMENDATIONS
The co-integration results have clearly shown that there is a long-run relationship between agricultural GDP and the number and volume of loans guaranteed by the ACGSF. This implies that the Scheme has contributed to the development of the agricultural sector and has met some of the objectives for setting it up. For countries wishing to set up similar scheme, the following recommendations should be considered:
-
Whenever possible, existing structures should be used to run the credit guarantee scheme rather than setting up a new structure for it. This will help to limit the schemes overhead and direct the available fund to the beneficiaries.
-
All tiers of government should be made partners in contributing to the fund through the enabling act to be passed by parliament right from the onset. This is because it may be difficult to amend the bill later and the other tiers of government may be unwilling to voluntarily contribute, as seen in the case of Nigeria.
-
In any economy in which inflation is a persistent problem, there is a need to review the authorized capital of the fund and the ceilings for the loans to be guaranteed for beneficiaries upwards at periodic intervals. This is to ensure that the funds capital base is adequate and the loans guaranteed under the scheme are enough for investment purposes.
-
Operators of the scheme should ensure that verification and settlement of claims are treated promptly. This will enhance the confidence in the program by the participating banks. In turn, this confidence is very critical especially if the economy of a country is experiencing inflation.
-
Efforts must be made to ensure that the program is brought as near as possible to the farmers. The clients will have access to it and reduce the cost of transactions to them. This could be achieved at minimal costs if existing programs and/or institutions with wide network across the country could be identified and used for reaching out to the farmers.
-
There is a need to build into the scheme a mechanism that will enhance voluntary repayment of guaranteed loans by beneficiaries. In fact, small-scale farmers are not expected to provide collaterals while the individual large-scale farmers and cooperative/corporate organizations do not have to provide collaterals covering one hundred percent of the loans approved for them.
REFERENCES
Adekanye, T. O. (1993). Agricultural credit in Africa: Implications of the Nigerian experience. Agricultural Administration, 14, 203-211.
Akinwunmi, J. A. (1999). Mobilizing small-scale savings through cooperative savings and credit associations. In V.O. Akinyosoye (Ed.) Mobilizing of Savings among Non-traditional Users of the Banking Industry in Nigeria (pp. 6-11). Nigeria: Ibadan University Press.
Aryeteey, E. (1995). Informal Finance in Africa: Filling the Niche. Nairobi: AERC/East African Educational Publishers Limited.
Baffles, J. (1991). Some further evidence of the Law of One Price. American Journal of Agricultural Economics, 73(4), 1264-73.
Balogun, E. D., & Otu, M. F. (1991). Credit policies and agricultural development in Nigeria. Central Bank Economic and Financial Review, 29(2), 138-155.
Baulch, R. J. (1995). Spatial Price Equilibrium and Food Market Integration. Unpublished Doctoral thesis, Stanford University - California.
Central Bank of Nigeria. (2005). Economic Report for the First Half of the Year 2005. Abuja, Nigeria: Author.
Coster, A. S. (1998). Credit Financing of Small-scale Farmers in Nigeria: A Case Study of the Ibadan Branch of NACB and Farmers in Oyo State. Unpublished Master of Science dissertation, University of Ibadan - Nigeria.
Dickey, D.A., & Fuller, W.A. (1979). Distribution of Estimators for Autoregressive Times series with a Unit Root. Journal of American Statistical Association, 74 (366), 427-431.
Dittoh, J. S. (1992, October 12). Monitoring of Agricultural Loans: Principles, Strategies and Problems. Paper presented to field officers of the Agricultural Credit Corporation of Oyo State, Ibadan, Nigeria.
Engle, R. F., & Yoo, B. (1987). Forecasting and Testing in Co-integrated Systems. Journal of Econometrics, 35(2), 143-159.
Franco, R. (1999). Testing the Quality-price Relations in Parmigiano and Padano Cheese Markets. Journal of International Food and Agribusiness Marketing, 10(3), 19-43.
George, E. O. (2002). New Perspectives in Financing Nigerian Agriculture. Ibadan, Nigeria: Heinnemann Educational Books.
Johansen, S. (1988). A statistical analysis of co-integrated vectors. Journal of Economic Dynamics and Control, 12(2/3), 231-254.
Johansen, S., & Juselius, K. (1990). Maximum likelihood and inference on co-integration with applications to the demand for money. Oxford Bulletin of Economics and Statistics, 52, 169-210.
Johansen, S., & Juselius, K. (1992). Testing Structural Hypothesis in a Multivariate Co-integration Analy-sis of the PPP and UIP for the UK. Journal of Econometrics, 53, 211-244.
Juselius, K. (2006). The Co-integrated VAR Model: Methodology and Applications. Manuscript submitted, Oxford University.
Mackinon, J. (1990). Critical Values for Co-integration Test. (Department of Economics Discussion Paper 90-4). California: San Diego University.
Mafimisebi, O. E. (2004). The Response of Agriculture to Credit-related Factors in Nigeria (1970-2003) (Project Report). Nigeria: University of Ibadan, Department of Agricultural Economics.
Mafimisebi, T. E. (2002a). Spatial Price Equilibrium and Fish Market Integration in Nigeria. Unpublished Doctoral thesis, University of Ibadan, Nigeria.
Mafimisebi, T. E. (2002b). Rural Infrastructure and Poverty Reduction in Nigeria. In: F. Okunmadewa (Ed.) Poverty Reduction and the Nigerian Agricultural Sector (pp 91-110). Mokola, Nigeria: El Shaddai Global Publications Ltd.
Mafimisebi, T. E. (2006). Trend Performance in Credit Financing of Rural Business Activities in Nigeria: A
Case Study of Community Banks in Ibadan, Oyo State. International Journal of Agriculture and Rural Development, 7(1), 50-60.
Mafimisebi, T. E. (2007). Long-run Price Integration in the Nigerian Fresh Fish Market: Implications for Marketing and Development. In S. M. Baker and D. Westbrook (Eds.) Proceedings of the Joint Conference Macromarketing and Development: Building Bridges and Forging Alliances (pp. 149-158). Nigeria: The International Society of Markets and Development and the Macromarketing Society and Development.
Mafimisebi, T. E., Oguntade, A. E., & Mafimisebi, O. E. (2008).
A Perspective of Partial Credit Guarantee Schemes in Developing Countries: A Case Study of the Nigerian Agricultural Credit Guarantee Scheme Funds. A paper presented at The World Bank Conference on Partial Credit Guarantee Schemes, Washington, D.C.National Bureau of Statistics (2006). Annual Abstract of Statistics. Abuja, Nigeria: Author.
Nigerian Institute of Social and Economic Research. (2003). A Review of Nigerian Development: The Agricultural Sector. NISER, Nigeria: The Agricultural and Rural Development Department.
Njoku, P. C. (June 2010). Public-Private Partnership for Agricultural Production and Food Security. The
Sixth School Annual Lecture Series of the School of Agriculture and Agricultural Technology, The Federal University of Technology. Akure, Nigeria.
Silvapulle, P., & Jayasuriya, S. (1994). Testing for Philippines Rice Market Integration: A Multiple Co-integration Approach. Journal of Agricultural Economics, 45(3), 369-398.
Olayemi, J. K. (1999). The need to mobilize savings among non-traditional users of the banking industry. In V. O. Akinyosoye (Ed.) Mobilization of Savings among Non-traditional Users of the Banking Industry in Nigeria (pp. 1-5). Nigeria: Ibadan University Press.
Udoh, E. J., Omonona, B. T., & Akintola, J. O. (2002). Estimating Growth, Instability Induces and Levels of Association in Number and Value of Loans Guaranteed under the ACGSF in Livestock and Crop Sub-sectors. Tropical Journal of Animal Science, 5(1), 131-141.
Upton, M. (1997). The Economics of Tropical Farming Systems. Cambridge, UK: Cambridge University Press.
World Bank. (1993). A strategy to develop agriculture in Sub-Saharan Africa and a focus for the World Bank (Paper No 203). Washington, D. C.: Africa Technical Department Series.
Received date: June 30, 2010
Accepted date: August 20, 2010
