


Servicios Personalizados
Revista

Articulo
 Inglés (pdf)
 Articulo en XML
 Referencias del artículo
 Enviar articulo por email
Indicadores
-
 Citado por SciELO
Links relacionados
-
 Similares en
SciELO
Similares en
SciELO
Compartir

 Permalink
Journal of Economics, Finance and Administrative Science
versión impresa ISSN 2077-1886
Journal of Economics, Finance and Administrative Science v.15 n.29 Lima dic. 2010
ARTICLES
Agency Costs and the Size Discount: Evidence from Acquisitions*
Costes de agencia y el descuento por tamaño: videncia a partir de las adquisiciones
David Ofenberg1
1. Ph. D. in Finance, Loyola Marymount University, Los Angeles, CA. <doffenberg@lmu.edu>
* This article was part of my dissertation while I was at Purdue University. I am grateful to John McConnell, David Denis, Mehmet Akbulut, Jack Baron, Val Sibilkov, Mira Straska and seminar participants at Loyola Marymount University and the Fall 2007 California Corporate Finance Conference for all of their comments and suggestions. I am indebted to Andrew Metrick for providing his G-Index data. All remaining errors are my own.
Abstract
Many scholars have found a negative relationship between a firms size and its value, as measured by Tobins q. This result is called the size discount. There are hypotheses about why the size discount exists, but none have been rigorously empirically tested. This paper argues that the size discount is created by the inability of shareholders to minimize agency costs in larger companies. Statistical tests suggest that the size discount only appears in large firms with managers that impose excessive agency costs upon their shareholders. Empiricists who use Tobins q to proxy for growth opportunities may need a different proxy.
Keywords: Agency costs, size discount, acquisitions, corporate governance.
Resumen
Muchos académicos han encontrado una relación negativa entre el tamaño de la firma y su valor, calculada según el q de Tobin. El resultado se llama el descuento por tamaño. Existen múltiples hipótesis que tratan de explicar por qué el descuento por tamaño se produce, pero ninguna ha sido empíricamente examinada con rigurosidad. Este estudio argumenta que el descuento por tamaño se crea debido a la inhabilidad de los accionistas para minimizar los costos de agencia en las grandes empresas. Las pruebas estadísticas sugieren que el descuento por tamaño solo aparece en las empresas grandes con gerentes que imponen costos de agencia excesivos a los accionistas. Los empíricos que usan el q de Tobin para representar factores de oportunidades de crecimiento necesitarán un factor diferente.
Palabras claves: Costos de agencia, descuento por tamaño, adquisiciones, gobierno corporativo.
INTRODUCTION
Many researchers have empirically documented a negative relationship between the size of a firm and its relative value, as measured by Tobins q.1 In fact, a negative correlation between size and value appears over and over in the finance and accounting literature. This relationship has come to be called a size discount, because larger firms are relatively less valuable than smaller firms. It is one of the most common yet unexplained phenomena in financial data. The presumption has been that size proxies for variation in growth opportunities or systematic differences between large and small firms.2 However, no empirical evidence testing such presumptions exists.
The purpose of this paper is to determine what drives the empirically-observed size discount. Both a review of prior studies and the following empirical analysis suggest that the cause of the size discount is the inability of shareholders to minimize agency costs in larger companies. The evidence throughout shows that larger firms are relatively less valuable than smaller firms, which is due to the weakening of internal and external corporate governance mechanisms as firms grow larger.
In order for agency costs to explain the size discount, two conditions must hold. First, shareholders of smaller firms must be able to reduce agency costs more effectively than shareholders of larger firms. Second, there must be a significant size discount for the subset of firms with high agency costs, but no size discount for the subset of firms with low agency costs.3 In other words, a size discount should only be imposed upon a large firms shareholders when an intolerable level of agency costs is present. Ultimately, if shareholders cannot discipline a manager who is imposing unnecessary agency costs, the firm must be less valuable.
The existing empirical evidence suggests that shareholders of smaller firms are able to reduce agency costs more effectively than shareholders of larger firms. Past studies have shown that larger firms are less likely to have a blockholder, to pass a meaningful proxy proposal, to have an effective board of directors, and to be acquired than smaller firms. All together, the evidence in the corporate finance literature provides ample support for the hypothesis that agency costs are harder to control in larger firms.
The analysis in this paper seeks to determine if there is a significant size discount for the subset of firms with high agency costs, but no size discount for the subset of firms with low agency costs. Logically, if the managers interests are well aligned with those of the shareholders, then the effectiveness of the disciplinary mechanisms is irrelevant to the value of the firm. On the other hand, when the manager has an incentive to destroy shareholder wealth, the effectiveness of the disciplinary mechanisms plays a large role in determining the value of the firm.
The empirical analysis in this paper primarily focuses on bad bidders, in the context of Mitchell and Lehn (1990). By definition, bad bidders are firms that undertake acquisitions that result in a decrease in shareholder wealth. For each company in the sample, the change in shareholder wealth is measured by the abnormal change in stock price around the announcement of a takeover. Therefore, the sample used in this paper is composed only of firms that made an acquisition attempt.
Bad bids offer a nice starting point because they provide a simple measure of the agency costs borne by the shareholders. Acquisitions are unique events in that they provide a clear example of how one decision made by the CEO affects shareholder wealth. When a manager makes an acquisition that results in an increase in the firms stock price, the executive is properly fulfilling her/his duties of maximizing shareholder wealth. On the other hand, when a manager undertakes an acquisition that results in a decrease in stock price, agency costs are imposed upon the firms owners. A negative announcement-period return is a direct agency cost, because it results in an immediate loss of wealth to shareholders and because self-interested shareholders would not undertake an acquisition that resulted in a decrease in their own wealth. Therefore, the announcement-period abnormal returns that are calculated for each firm directly measure the agency costs that managers of bad bidder firms are imposing upon their shareholders.
Bid quality is measured within a sample of acquirers that made a takeover bid in the period from 1980-2000. This sample contains 9,434 firm-years, each representing a separate year in which a firm attempted an acquisition. Firms are split into a high agency costs subsample and a low agency costs subsample, as determined by the abnormal returns around the announcement of an acquisition. The results of regression analysis show that size and q are significantly negatively correlated for bad bidders, but not for good bidders. In other words, a size discount exists for the firms in the high agency costs subsample, but not for those in the low agency costs subsample.
A similar test is performed to determine if the size discount is as significant for single segment firms as it is for diversified firms. The results show a size discount in both the undiversified and diversified subsamples. While the scale of the size discount is different between the two groups, it is negative and significant for both. The evidence suggests that this particular systematic difference between large and small firms is not responsible for the size discount.
The robustness of these results is tested using the Gompers, Ishii, and Metrick (2003) G-Index as a separate measure of agency costs. In theory, this measure of corporate governance should proxy for the level of agency costs within a firm. The more pro-management governance provisions that the firm has in place, the more likely the managers are to impose excessive agency costs. While the G-index only provides an indirect measure of agency costs, it is available for more firms than is acquisition data. The results of this secondary analysis reiterate the prior findings. The evidence suggests that the size discount only exists in firms with high agency costs. In total, the theory and evidence provided in this paper offer support for a size discount, created by the inability of corporate control mechanisms to effectively discipline managers of larger firms.
This paper is particularly timely in light of recent studies. Evidence that managers of larger firms impose higher agency costs through value-reducing acquisitions comes from Moeller, Schlingemann, and Stulz (2004) and Offenberg (2009). Both studies demonstrate that announcement-period returns are negatively correlated with size. In other words, larger firms are more likely to be bad bidders than smaller firms. Their results highlight the fact that managers of larger firms impose higher acquisition-based agency costs upon their shareholders than managers of smaller firms.
Yermack (2006) looks at the correlation between the use of corporate jets and the change in shareholder wealth. The author describes personal aircraft use as a source of agency costs between shareholders and managers, and by far the most costly fringe benefit enjoyed by major company CEOs. Yermack hypothesizes that CEOs who impose agency costs on their shareholders in the form of corporate jets may just as easily impose far more damaging agency costs as well. More directly to the point of the present study, the author finds that personal aircraft use and a broader consumption of perquisites increases as firm size increases.
The remainder of this paper is organized as follows: the first section provides a more thorough review of the relevant corporate finance literature about the size discount and past studies that relate size and the effectiveness of corporate governance mechanisms. The next segment describes the data and methodology of the study. The subsequent section analyzes the relationship between size and firm value, and then follows the Conclusions.
LITERATURE REVIEW
The Size Discount
The negative correlation between size and q is observed repeatedly throughout the finance literature. Perhaps the most widely cited of these articles is Lang and Stulz (1994). Their study of diversification considers over 600 firms in 1984. The result of interest is derived by estimating a regression of q on a number of explanatory variables, including the ratio of R&D to total assets, a diversification dummy, and firm size. Their results show a negative correlation between size and q: as firms grow larger they become relatively less valuable. Robustness of this result is emphasized in Daines (2001), who studies the relationship between q and the state of incorporation over 47,000 firm-years. The results of his regressions clearly show the coefficient on size is negative and significant. This finding has been documented in international studies, such as Claessens, Djankov, Fan, and Lang (2002), which show a significantly negative relationship between size and relative value in eight Asian economies.
A number of authors (Demsetz, 1983) have argued that these results may be subject to an endogeneity bias. It may, in fact, be the case that firm size and q are determined simultaneously to maximize value. Therefore, an observed relationship between these variables may reflect an optimal level, rather than a static correlation. Recent studies have attempted to explore this potential bias. Himmelberg, Hubbard and Palia (1999) use firm fixed effects to reexamine the results in studies such as Morck, Shleifer, and Vishny (1988) and McConnell and Servaes (1990). Coles, Lemmon, and Meschke (2007) reconsider the same literature, but specify a structural model of the firm that alleviates the endogeneity problem and allows for better analysis of the relationship between firm size and q. Both of these articles find that size is negatively correlated to relative value even after controlling for endogeneity. At least within the universe of Compustat firms, there does not seem to be an endogenous connection between firm size and firm value.
Firm Size and Governance Mechanisms
The purpose of this section is to document evidence in the corporate finance literature regarding the ability of corporate governance mechanisms to reduce agency costs in larger firms. There are many corporate control mechanisms at shareholders disposal, should the firms management begin to impose intolerable agency costs. Shareholders may appoint a board of directors that exercises more authority over the executives. They may buy a large block of stock, so as to gain greater control over the firm. They may instigate proxy proposals, to change the governance of the firm. Also, shareholders may rely on the market for corporate control to step in and remove self-serving managers. An extensive literature has documented the role of each of these devices in disciplining wayward leadership.4
Boards of Directors
There is some existing theory and evidence that boards of directors become weaker monitors as firms become larger. Lipton and Lorsch (1992) and Jensen (1993) argue that a larger board of directors may be less effective. Both cite various reasons why this might be the case, such as free-rider problems, slower decision making, less candid discussions, and biases against risk-taking. Yermack (1996) finds that smaller boards are more successful at governing, as measured by the association between board size and firm value. His findings also show evidence that as companies grow bigger, boards grow bigger. The conclusion that can be drawn from his analysis is that larger firms have larger and thereby less effective boards of directors.
The key role of the board is to hire and fire managers to best suit the interests of the shareholders. Therefore, one may also observe the effectiveness of the board of directors in their decisions to fire poorly performing managers. If boards are successful at disciplining managers, then one should observe an increase in turnover following poor performance. Denis, Denis, and Sarin (1997) show in their work that CEOs are less likely to lose their jobs in larger firms. This can be interpreted as further evidence that boards become less effective monitors as firms grow larger.
Blockholders
A number of studies have shown that shareholders benefit when the firm has a blockholder. Denis, Denis, and Sarin find that the likelihood of top-executive turnover is higher for firms with an outside blockholder. Mikkelson and Ruback (1985) as well as Shome and Singh (1995) show increases in stock prices due to block formations. Mikkelson and Partch (1989) explain that acquisitions are more likely to be completed if the firm has an outside blockholder. Meanwhile, Bertrand and Mullainathan (2001) provide evidence that CEO pay is less likely to be based on luck when the firm has an outside blockholder. Collectively, these results suggest that an outside blockholder can perform a significant monitoring function. Without such monitoring, managers may impose undue agency costs upon the firms shareholders.
Intuitively, one would expect larger firms to be less likely to have a blockholder than smaller firms. After all, fewer investors can afford to buy 5% of Walmart than 5% of Winnebago5. Agrawal and Knoeber (1996) provide empirical evidence that the probability of a firm having a blockholder is decreasing in the size of the firm. In other words, shareholders of larger firms are less likely to enjoy the benefits of having a blockholder to mitigate agency costs.
Proxy Proposals
According to the rules of the SEC, any shareholder of record may submit a proxy proposal to the board of directors to be voted upon by the other shareholders. This feature of corporate governance gives every shareholder a voice in how his or her investment is managed. However, once approved, the proposal must be considered for adoption by the board, but they are in no way bound by it. As such, there is only a limited probability of inducing change in an undisciplined management team via proxy proposal.
Bizjak and Marquette (1998) focus on shareholder proposals to revise or rescind poison pills. They find increases in firm value following adoption of poison pill-related propositions. This serves as evidence that the shareholder proposal system is effective as an external corporate control mechanism. However, their results also reveal an interesting size disparity: they find a negative coefficient on the size variable. This result indicates that it is harder to pass a shareholder proposal through a larger firm. In sum, the evidence suggests that the proxy proposal process is an effective means by which to cause changes in corporate governance, with the effectiveness weakening as firms grow larger.
Acquisitions
There are a number of theories to explain why larger firms are more difficult to acquire. Palepu (1986) and Baker and Kennedy (2002) argue that transaction costs associated with an acquisition increase as the size of the target increases. Manne (1965) suggests that antitrust laws may prevent bigger companies from becoming the target of an acquisition - government regulators have been successful at preventing businesses with a large market share from buying other firms in the same industry that also hold a considerable market share. Managers may also choose to only make small acquisitions because they are less risky. Empirical evidence in papers such as Moeller, Schlingemann, and Stulz (2004) and Travlos (1987) has shown a negative correlation between the relative size of an acquisition and the announcement period abnormal return for large firms. All else equal, a manager is less likely to be fired by disappointed investors when the firm purchases smaller targets.
Empirical studies have shown that larger firms are less likely to be acquired. Palepu (1986), Berger and Ofek (1996), Harford (1999), and Offenberg (2009) find a negative correlation between size and the probability of becoming a target with U.S.-based firms. In a sample of UK-based financial services firms, Thompson (1997) also finds that larger firms are less likely to be acquired.
Summary
As firms grow larger, there are fewer chances to have a blockholder or to be acquired entirely, shareholders are less likely to pass meaningful proxy proposals, and the boards of directors become weaker. Collectively, these findings provide evidence that shareholders of larger firms are not able to reduce agency costs as effectively as shareholders of smaller firms. This result is necessary to support the main hypothesis of this paper, that the size discount is a product of agency costs. However, the main hypothesis can only be true if the size discount is only imposed upon larger firms with an intolerable level of agency costs. The remainder of this paper provides empirical evidence that only larger companies with high agency costs bear a size discount.
DATA
In this article, agency costs are measured by the quality of the acquisitions that a firm makes. To that end, the sample in the present study is drawn from the SDC Platinum mergers and acquisitions database, over the 21-year period from 1980 through 2000. In creating this sample, a number of criteria are employed. First, for an acquisition to be a part of the sample, the acquirer must be included in the CRSP/Compustat merged database at the end of the fiscal year before and after the acquisition6. These two years of data are necessary to calculate all the variables employed in this study, which are described in detail later in this section. Furthermore, the total dollar amount offered as the purchase price for the target must be at least 1% of the book value of the acquirer as of the fiscal year-end immediately preceding the announcement. Applying this 1% relative size screen helps ensure that abnormal returns are caused by the event in question and not random noise in the data. At the fiscal year-end following its last acquisition, the acquirer must have at least $25 million in assets, after adjusting for inflation. In addition, the acquirer must be attempting to increase its ownership in the target to a level greater than 50%. Acquirers with primary SIC codes in financial (SIC 6000-6999) and utility industries (SIC 4910-4940) are excluded from the sample. A download of data from SDC provides 13,338 usable acquisitions over the period from 1980-2000.
The quality of each individual acquisition attempt is measured with a cumulative abnormal return (CAR), which is calculated using the market model over the event window ranging from five days before the announcement through two days after, [-5,2]7. This window was chosen because it has been shown to produce significant announcement-period abnormal returns in past studies of acquisitions, such as in Travlos (1987), Bradley, Desai, and Kim (1988), and Hubbard and Palia (1995). The parameters for the market model are estimated using a value-weighted market index over a 200-day window ending six days before the announcement. Firms are eliminated from the sample if they did not have sufficient data available on CRSP to estimate at least a 100-day market model.
In this study, the quality of each bidder is measured by the net effect on shareholder wealth of all acquisitions attempted within a fiscal year8. As a result, the dataset that is used in the following analysis is composed of observations, rather than just acquisitions, where an observation combines a years-worth of acquisitions by one firm into one data point. As such, from the sample of 13,338 acquisitions downloaded from SDC Platinum, the resulting dataset yields 9,434 firm-years.
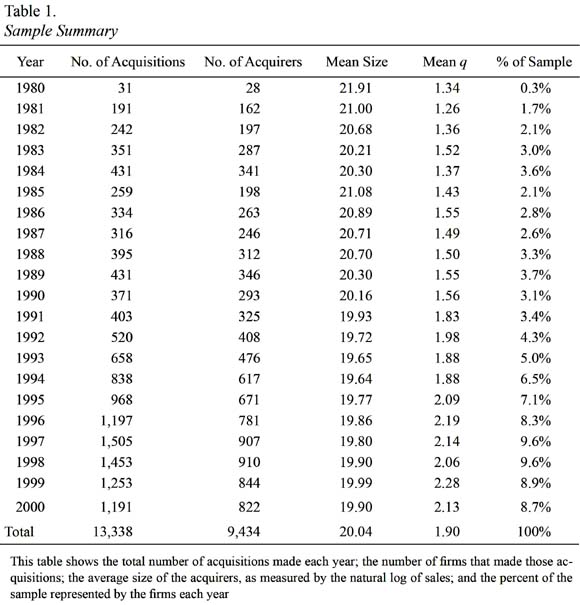
Table 1 shows a summary of the sample. For each year, the number of acquisitions, the number of observations, the average size of the acquirers, and the average Tobins q are reported. The pattern of acquisitions over time mirrors that described in the literature, with a run-up toward the later end of the 1980s, followed by an even sharper spike in activity in the late 1990s. There are two important time trends to note here. First, the acquirers decrease is size over time, after adjusting for inflation. Second, the mean relative value of firms increases over time. These time trends indicate that proper controls for time must be included in the analysis that follows.
The quality of the bidder for each observation is measured by compounding CARs from all acquisitions made by the firm over a single fiscal year. Compounding returns creates one variable that measures the impact of the firms total acquisition activity on shareholder wealth. Therefore, the primary variable of interest in much of the analysis that follows is the compound CAR (CCAR), where:

where CAR1 is the CAR from the first acquisition made by a firm in the fiscal year, CAR2 is the CAR from the second acquisition, and so on. The resulting compound CAR variable is the measure of bid quality, and therefore the measure of agency costs, used throughout the analysis. Firms with a negative CCAR for a given fiscal year are presumed to have imposed an intolerable level of agency costs upon their shareholders, and, as such, are labeled bad bidders. Firms with a positive CCAR, for a given year, are presumed to be well managed, and are labeled good bidders.
Financial and diversification data are drawn from the Compustat database. All financial data are adjusted for inflation, using 1980 as the base year. Tobins q is calculated as in Daines (2001) by dividing the sum of market value of common equity and book value of debt and preferred stock by the book value of assets. The quotient is estimated as of the end of the fiscal year immediately following the acquisition, which allowed for the value of the new entity to be included. To ensure that the correlation between size and q is not biased throughout the analysis, firm size is measured using the natural log of sales as of the end of the fiscal year immediately following the acquisition9.
EMPIRICAL ANALYSIS
This section focuses on the empirical relationship between size, q, and agency costs in the sample. Table 2 begins by summarizing some of the more interesting features of the sample. The first column shows the average size of the firms, as measured by the inflation-adjusted natural log of sales. The first panel shows the mean for the entire sample, while the second panel breaks the sample into groups defined by the headings "Good Bidders" and "Bad Bidders". Table 2 shows that good bidders are significantly smaller firms than bad bidders, with the average natural log of sales of 19.93 for the former and 20.17 for the latter. This finding agrees with past results in Loderer and Martin (1997), as well as Moeller, Schlingemann, and Stulz (2004), who also find that large firms tend to be bad bidders. In addition to bid quality, there are also significant differences between good and bad bidders in profitability, research intensity, and the timing of their bids. It is important to control for these differences when measuring the size discount in the analysis that follows.
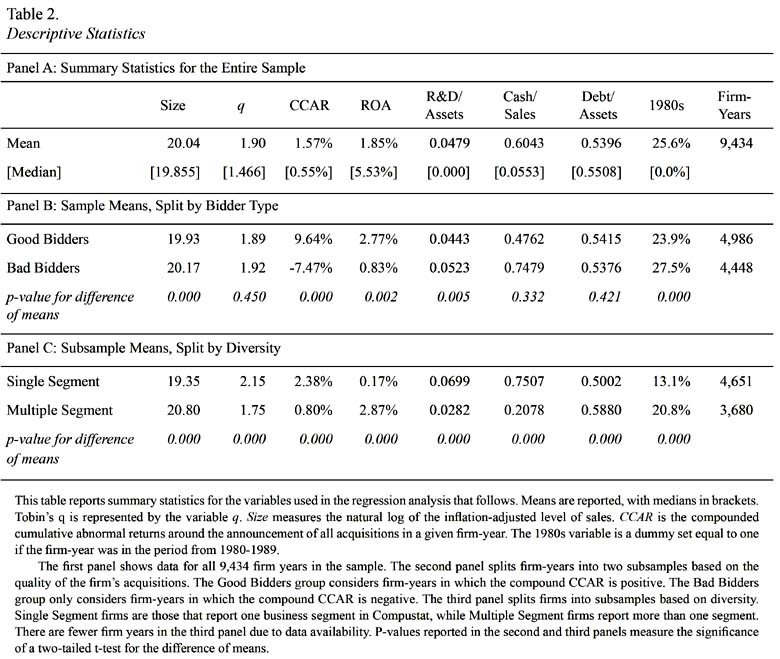
The third panel of Table 2 also shows the difference in size between diversified and undiversified firms. The results show that diversified firms are significantly larger and have smaller values of q. This suggests that diversification is worth studying as a possible systematic difference between larger and smaller firms that may create the size discount. It is interesting to note that the calculated value of q for the diversity subsamples reflects the diversification discount. Single-segment firms have an average q of 2.15, but the average is only 1.75 for diversified firms; the difference is statistically significant.
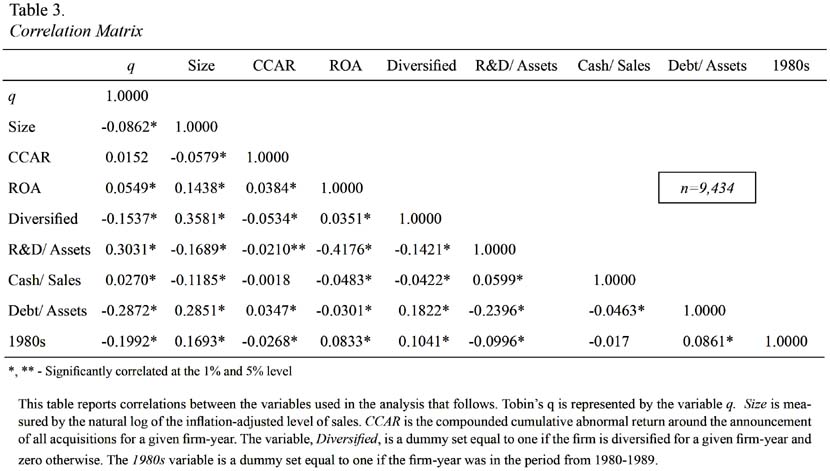
Table 3 presents a pair-wise correlation matrix for several of the key variables in the analysis. This offers a first glimpse at the correlations that will be analyzed more thoroughly later in this paper. The most important result to highlight in Table 3 is the relationship between q and size. The purpose of this paper is to study what drives the negative correlation between size and q that has been observed in other datasets, and this correlation coefficient (-0.0862) demonstrates that such a relationship exists in this data as well. It is also interesting to note that there is no economically or statistically significant pair-wise correlation between q and the CCAR. Whenever a firms stock price varies, the market value of assets also varies forcing a change in q. Across all firm-years, the value of q does not appear to be influenced by the quality of the firms acquisitions.
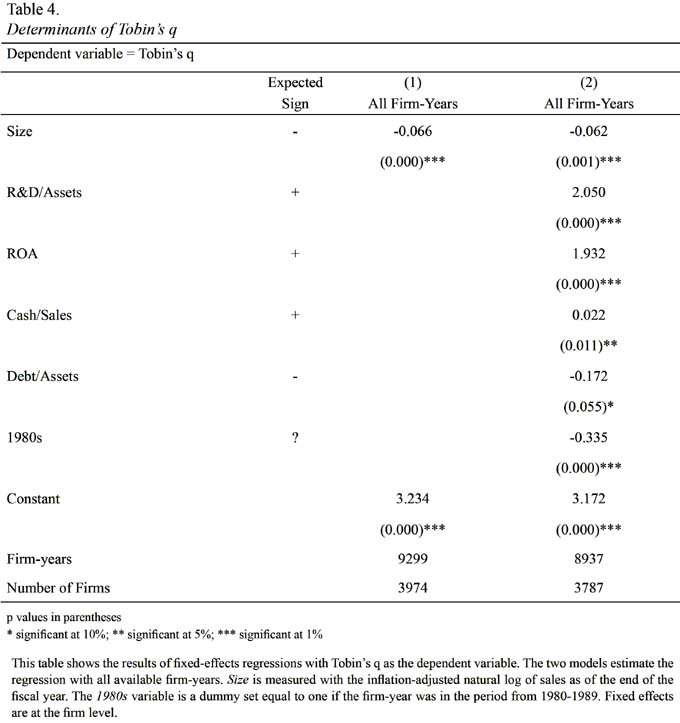
To study the sensitivity of the relationship between size and value, fixed effects OLS regressions are estimated with q as the dependent variable, and size as an independent variable. Fixed effects are by firm to control for firm-specific variation in q. A collection of other known predictors of q are incorporated as explanatory variables. The return on assets is included to control for any correlation between size and profitability, as discussed in Hall and Weiss (1967). More profitable firms should have higher levels of q. The ratio of research and development to sales also serves as a control variable, as Kallunki et al. (2009) document a positive correlation between the level of R&D and relative value. Palepu (1986) argues that measures of liquidity and leverage are likely to indicate whether a firm is an attractive target: more liquid firms are hypothesized to be more valuable and more indebted firms should be less valuable. To that end, ratio of cash to sales (liquidity) and the ratio of debt to equity (leverage) are included in the regression as well. There is a dummy variable for firm-years that occurred in the period from 1980-1989, as authors such as Holmstrom and Kaplan (2001) have argued that there were fundamental differences in the takeover markets of the 1980s and 1990s, which may have impacted the firms CCAR10.
Preliminary regressions are presented in Table 4. The purpose of this first regression is to document that the size discount exists in this dataset, even after controlling for common determinants of q. The first column shows the expected relationship between size and q, with the second column reporting that the coefficient on size is negative and significant at -0.066. This is the size discount: as firm size increases, relative value decreases. The control variables discussed above are employed in the second model. Each of these variables has a significant impact upon q, but the size discount is similar, with the coefficient on size at -0.062. The results in Table 4 make it apparent that the size discount exists in this sample.
To study whether the size discount varies based upon a variation in agency costs, firms are split into a low agency costs subsample labeled Good Bidders and a high agency costs subsample marked Bad Bidders. The results are reported in Table 5.
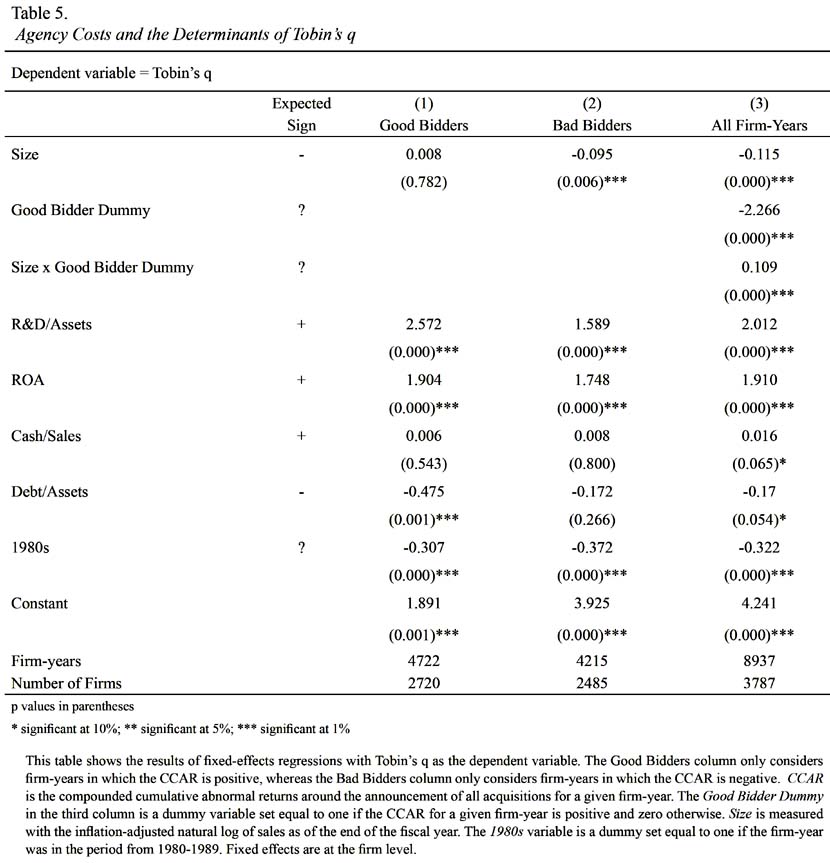
In the Good Bidders subsample, there is no size discount. The coefficient on the size variable is positive but not significantly different from zero. On the other hand, a size discount does appear in the Bad Bidders subsample. The size variable carries a significant coefficient of -0.095. This is the main finding of this study. A significant size discount exists for firms suffering high agency costs, but no similar discount appears for firms not burdened by agency costs. These results suggest that agency costs may be a substantial component of the size discount.
To ensure that there is a significant difference between the coefficients on the size variables in these two models, an additional regression is estimated in the third column of Table 5 that uses an interaction term. This variable is constructed by multiplying size by a good bidder dummy, which takes the value of one if the firm-year had a positive CCAR. The interaction term measures the difference in the size discount between good and bad bidders, or how much less a good bidder is discounted by the market. The results in the third column show that the coefficient on the interaction term is positive and significant at 0.109, indicating that the size discount is greater for bad bidders than for good bidders. In other words, large bad bidders have significantly lower values of q than small bad bidders, but large good bidders have similar levels of q to small good bidders.
Fuller, Netter, and Stegemoller (2002), amongst others, show that the method of payment (stock vs. cash), the organizational form of the target (public vs. private), whether or not the deal was a tender offer, and other deal characteristics have an impact on the acquirers announcement-period abnormal return. It is important to note that no controls are included in the analysis to account for these characteristics of the acquisition. They are intentionally omitted because abnormal returns are being used as an explanatory variable. The abnormal returns are attempting to capture the change in shareholder wealth. Shareholders do not care if they lost wealth in an acquisition because of the method of payment: they only care that they lost wealth. As such, including any controls that dilute the impact on shareholder wealth of the managers decisions is counterproductive.
Diversification
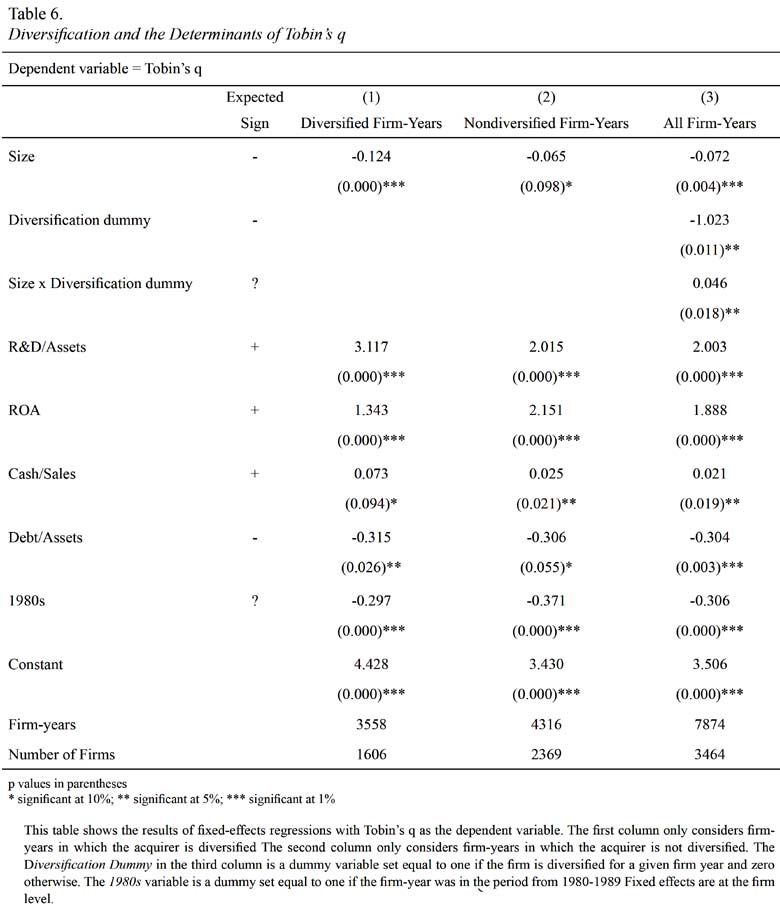
If the size discount is due to diversification in large firms, then it should be apparent in a subsample of diversified companies, but not in a subsample of single-segment entities. To test this proposition, firms are split into subsamples and fixed-effects regressions of the determinants of q are re-estimated, with the results presented in Table 6. The first column shows the findings for diversified firms. As expected, the size coefficient has a negative and significant value, reflecting the size discount. However, this is also true for nondiversified firms. While the scale of the discount is less for single segment companies versus multi-segment firms (-0.065 vs. -0.124), the significance is still apparent. The third column estimates a separate regression, which includes all firm-years and uses an interaction term to determine the significance of the difference of the size discounts. This interaction term, which multiplies size by a dummy variable set equal to one if the firm has multiple segments, measures how much larger the coefficient on the size variable is for diversified firms versus nondiversified firms. It is interesting to note that the coefficient on the interaction term suggests that the size discount is dependent upon the diversity of the firm. In other words, large diversified firms exhibit less of a size discount than large undiversified firms, but smaller diversified firms bear more of a size discount than smaller undiversified firms. In total, the results presented in Table 6 suggest that the size discount is present and significant even after controlling for diversification.
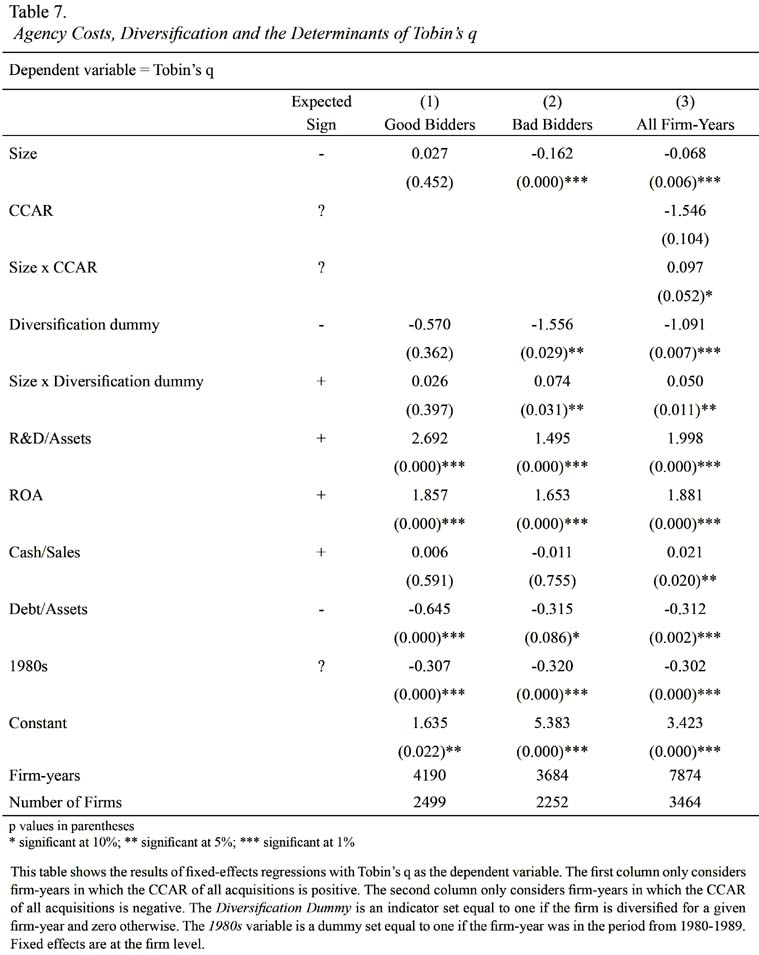
As a further test, a diversification dummy was inserted into the regressions previously estimated in Table 5. Again, the dependent variable is the firms Tobins q, and the result of interest is the coefficient on the size variable. To be thorough, the discrete variable used to measure agency costs in the model in Table 5 was replaced with a continuous measure. More specifically, the Good Bidder Dummy is replaced with CCAR.
The first and second columns of Table 7 show the coefficient estimates of a regression with firms split into a Good Bidder sample and a Bad Bidder sample. Size bears a negative and significant coefficient for bad bidders, once again indicating the presence of a size discount. However, the coefficient on size for good bidders is positive and insignificant. The results suggest that the size discount only affects the relative value of bad bidders, but not good bidders. Finally, the third column reintroduces the interaction term that measures the significance of the difference between the size discount in good and bad bidders. The coefficient on the interaction term is again positive and significant (0.097), suggesting that the size discount has less of an impact on the value of good bidders than bad bidders, even after controlling for the diversification discount.
January Effect
It is widely documented that stock prices tend to rise in the month of January. It is not immediately clear what affect this phenomenon should have on announcement-period returns to acquirers, nor to the size discount. On one hand, rising prices make targets more expensive, so acquirers may be more likely to overpay. On the other hand, rising stock prices also make the acquirers equity more valuable as a form of merger consideration, so they may be able to spend less cash to complete the deal.
In unreported t-tests, mean acquirer CARs are 2.03% in January, and 1.16% in the other eleven months of the year. The difference is significant at the 5% level. It appears that buyers do make better deals in January. In order to determine if these deals in January are driving the results in Table 7, the regression (unreported) is estimated without January deals included in the CCAR calculation11. The resulting coefficient estimates are not substantially different than those reported in Table 7, column 3, both in size and significance. In other words, the key results of this paper are not a by-product of better deal-making in January.
A Note on Growth
As mentioned previously, authors in the past have suggested that the negative correlation between size and Tobins q is driven by a difference in growth prospects. One way to test the validity of this claim would be to measure q, then measure the change in assets over the next several years and see how well the variation in q predicts the variation in asset growth. The fundamental problem with such a test is the survivorship bias. In the present sample, over 23% of firms drop out within three years. On average, these firms are significantly smaller and less profitable than the survivors, but tend to make much better acquisitions. It is difficult to know the implications of this survivorship bias, but any results drawn from such a sample would have to be interpreted cautiously.
A Note on Bankruptcy
Another systematic difference that has been observed between larger and smaller firms is the probability of bankruptcy. In Ohlson (1980), a logit model is used to predict whether a firm will file for bankruptcy in the period up to twelve months following the end of the fiscal year. In a sample of firms covering 1970-1976, larger firms were found to be less likely to file for bankruptcy. However, these findings were updated in a recent paper by Hillegeist, Keating, Cram, and Lundstedt (2004) (HKCL hereafter), whose dataset covers the exact same period as the present study, from 1980-2000. Their results show the opposite size effect of the original Ohlson study. More specifically, HKCL find that as firm size increases, the probability of bankruptcy increases.
One interesting test to include in the present study would be to determine if the negative correlation between size and q is driven by bankruptcy costs. To that end, probabilities of bankruptcy are calculated for all of the firms in the sample using the updated logit model coefficients from the HKCL study. The highest resulting probability of bankruptcy for all firm-years in the present sample is approximately 16%. Nearly all of the firm-years in this dataset have a less than 10% chance of entering into bankruptcy in the coming year. It appears that all of these firms are financially healthy, as would be expected of acquirers. The drawback to this finding is that no reasonable tests could be run on the present sample, which includes a probability of bankruptcy as a determinant of Tobins q, since bankruptcy is such an unlikely occurrence. After all, Ohlson (1980) argues that no firm with an estimated probability of bankruptcy under 50% can reasonably be expected to go bankrupt.
Robustness
To test the robustness of the results, a secondary dataset is constructed with a different measure of agency costs. In this analysis, instead of measuring agency costs with CCAR, they are measured using the G-index presented in Gompers, Ishii, and Metrick (2003). In essence, the G-index assigns one point for each measure employed by a firm that reduces shareholder rights. These provisions may include poison pills, classified boards, golden parachutes, and so on. The more anti-shareholder provisions the firm has enacted, the higher its G-index score. In theory, managers have a greater opportunity to impose agency costs if they have more such provisions in place. In total, scores can range from 0 to 24. Gompers, Ishii, and Metrick classify firms with a score under six as a democracy, and scores over 13 as a dictatorship.
The G-index data is available for a subset of firms in the Compustat database. The score is not calculated yearly for each firm, so in missing years, the most recent score is used. For instance, if a firm received a score of 10 in 1990 and 15 in 1992, it is assumed that it would still receive a 10 in 1991. Summary statistics regarding this subset of data are presented in Table 8.
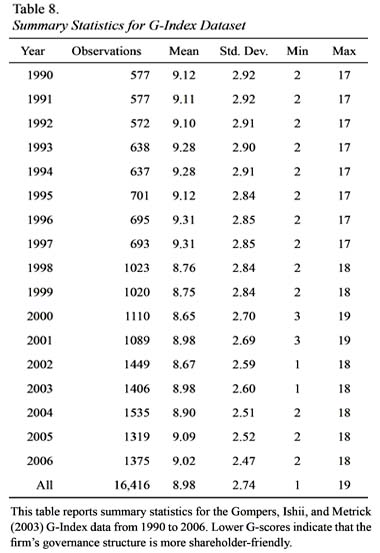
The G-index scores from 1990-2006 are supplemented with financial data from Compustat. The key variables, such as Tobins q and size, are calculated in the identical manner as that described previously, with the obvious exception of CCAR. Firms in this alternative sample are not required to be acquirers; they must only have a G-index score12.
In order to check the robustness of the prior results, the same tests are run using this new measure of agency costs. The regression model employed again uses q as the dependent variable, with size and the G-index as explanatory variables. The results are presented in Table 9. In this analysis, democracies are the functional equivalent of good bidders, as they are both expected to have low agency costs. Similarly, dictatorships are expected to have high agency costs like bad bidders.
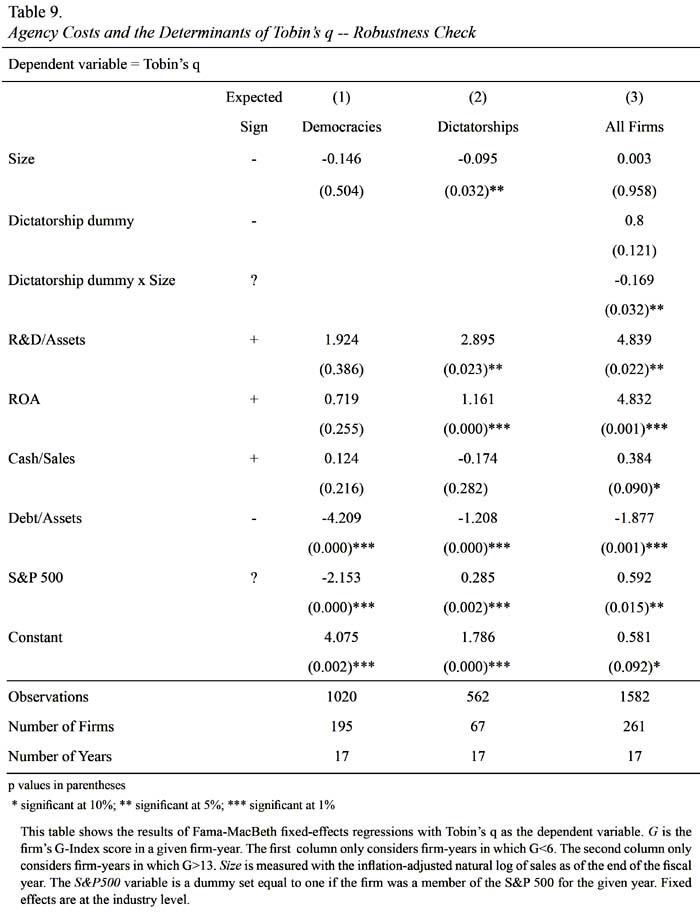
The coefficients in column 1 suggest that size does not have any explanatory power with q amongst the low-agency costs sample, the democracies. To the contrary, size and q are negatively correlated for firms with high agency costs, the dictatorships. In the Dictatorships column, the coefficient on size is -0.095 and it is significant at the 5% level. These findings echo the results in Table 5. It appears that the size discount is limited to firms with high agency costs. The third column of Table 9 combines democracies and dictatorships into one panel. The coefficient on the size discount approaches zero, but the interaction term is negative and significant. This result again shows that size and value are only negatively related in firms in which it is difficult to minimize agency costs. Overall, the findings from the tests in Table 9 support the prior analysis with acquirers. The key result, that the size discount is driven by agency costs, appears to be robust to the measure of agency costs.
CONCLUSIONS
Over the past twenty years, many papers have been published in the accounting and finance literature that show a negative correlation between the size and relative value of a firm. While it is often assumed that the size discount is due to differences in growth opportunities, there is no published evidence to justify why this relationship exists. The arguments set forth in this paper establish an agency costs-based explanation for the size discount as an alternative to the status quo.
In fact, it is quite likely that the expected growth rates of large and small firms are the same. There may be large firms with plenty of growth opportunities, such as Google, with their ambitions to enter countless new internet-based markets in the coming years. Similarly, there may be small firms with no growth opportunities, such as typewriter manufacturers. Consider further that large firms can be viewed as a collection of small firms. For example, Microsoft is a company that sells operating systems in one market, network utilities in another market, computer games to a third market, and so on. From this viewpoint, it becomes apparent that the growth opportunities for large firms may be no different that those for small firms.
This paper argues that this size discount is based on the decreasing ability of corporate governance mechanisms to discipline management as firms grow larger. This hypothesis is supported by both a wealth of prior research, which documents weaker disciplinary mechanisms, higher agency costs, and lower values of q in larger firms, along with the empirical findings presented in this study. The evidence demonstrates that a size discount is apparent in firms burdened by high agency costs, but not in firms with low agency costs. It also shows that no similar disparity exists between diversified and nondiversified corporations, and is robust to using the G-Index as an alternative measure of agency costs.
This article takes a first stab at the hypothesis that agency costs drive the size discount, but leaves many questions unanswered. Further tests with larger, more diverse and international samples are warranted, as are tests with improved measures of agency costs. These provide avenues for future research.
REFERENCES
Agrawal, A., & Knoeber, C. R. (1996). Firm performance and mechanisms to control agency problems between managers and shareholders. Journal of Financial and Quantitative Analysis, 31(3), 377-397.
Antoniou, A., Petmezas, D., & Zhao, H. (2007). Bidder gains and losses of firms involved in many acquisitions. Journal of Business Finance & Accounting, 34(7&8), 1221–1244.
Baker G., & Kennedy, R. (2002). Survivorship and the economic grim reaper. Journal of Law, Economics & Organizations, 18(2), 324-361.
Berger, P. G., & Ofek, E. (1996). Bustup takeovers of value-destroying diversified firms. Journal of Finance, 51(4), 1175-1200.
Bertrand, M., & Mullainathan, S. (2001). Are CEOs rewarded for luck? The ones without principals are. The Quarterly Journal of Economics, 116(3), 901-932.
Bizjak, J., & Marquette, C. (1998). Are shareholder proposals all bark and no bite? Evidence from shareholder resolutions to rescind poison pills. Journal of Financial and Quantitative Analysis, 33(4), 499-521.
Bradley, M., Desai, A., & Kim, E. (1988).
Synergistic gains from corporate acquisitions and their division between the stockholders of target and acquiring firms. Journal of Financial Economics, 21(1), 3-40.Cho, M. H. (1998).Ownership structure, investment, and the corporate value: an empirical analysis. Journal of Financial Economics, 47(1), 103-121.
Claessens, S, Djankov, S., Fan, J. P. H., & Lang, L. H. P. (2002). Disentangling the incentive and entrenchment effects of large shareholdings. Journal of Finance, 57(6), 2741-2771.
Cockburn, I., & Griliches, Z. (1988). Industry effects and appropriability measures in the stock markets valuation of R&D and patents. American Economic Review, 78(2), 419-423.
Coles, J. L., Lemmon, M. L., & Meschke, J. F. (2007). Structural models and endogeneity in corporate finance: the link between managerial ownership and corporate performance. (Working Paper). Arizona State University.
Daines, R. (2001). Does Delaware Law improve firm Value?. Journal of Financial Economics, 62(3), 525-558.
Demsetz, H. (1983). The structure of ownership and the theory of the firm. Journal of Law and Economics, 26(2), 375-390.
Denis, D. J., Denis, D. K., & Sarin, A. (1997). Ownership structure and top executive turnover. Journal of Financial Economics, 45(2), 193-222.
Denis, D. K., & McConnell, J. J. (2003). International corporate governance. Journal of Financial and Quantitative Analysis, 38(1), 1-36.
Fuller, K., Netter, J., & Stegemoller, M. (2002). What do returns to acquiring firms tell us? Evidence from firms that make many acquisitions. Journal of Finance, 57(4), 1763-1793.
Gompers, P., Ishii, J., & Metrick, A. (2003). Corporate governance and equity prices. Quarterly Journal of Economics, 118(1), 107-155.
Hall, M., & Weiss, L. (1967). Firm size and profitability. Review of Economics and Statistics, 49(3), 319-331.
Harford, J. (1999). Corporate cash reserves and acquisitions. Journal of Finance, 54(6), 1969-97.
Hermalin, B. E., & Weisbach, M. S. (1991). The effects of board composition and direct incentives on firm performance. Financial Management, 20(4), 101-112.
Hillegeist, S. A., Keating, E. K., Cram, D. P., & Lundstedt, K. G. (2004). Assessing the probability of bankruptcy. Review of Accounting Studies, 9(1), 5-34.
Himmelberg, C. P., Hubbard, R. G., & Palia, D. (1999). Understanding the determinants of managerial ownership and the link between ownership and performance. Journal of Financial Economics, 53(3), 353–84.
Holmstrom, B., & Kaplan, S. (2001). Making sense of the 1980s and 1990s. Journal of Economic Perspectives, 15(2), 121-144.
Hubbard, R. G., & Palia, D. (1995).
Benefits of control, managerial ownership, and the stock returns of acquiring firms. Rand Journal of Economics, 26(4), 782-792.Jensen, M. C. (1993). The modern industrial revolution, exit, and the failure of internal control systems. Journal of Finance, 48(3), 831-880.
Jensen, M., & Meckling, W. (1976). Theory of the firm: managerial behavior, agency costs, and ownership structure. Journal of Financial Economics, 3(4), 305-360.
Kallunki, J. P., Pyykkö, E., & Laamanen, T. (2009).
Stock market valuation, profitability and R&D spending of the firm: the effect of technology mergers and acquisitions. Journal of Business Finance & Accounting, 36(7/8), 838-862.Lang, L. H. P., & Stulz, R. M. (1994). Tobins q, corporate diversification, and firm performance. Journal of Political Economy, 102(6), 1248-1280.
Lipton, M., & Lorsch, J. W. (1992). A modest proposal for improved corporate governance. Business Lawyer, 48, 59- 77.
Loderer, C., & Martin, K. (1997). Executive stock ownership and performance. Tracking faint traces. Journal of Financial Economics, 45(2), 223-255.
Manne H. (1965). Mergers and the market for corporate control. Journal of Political Economy, 73(2), 110-120.
McConnell, J. J., & Servaes, H. (1990). Additional evidence on equity ownership and corporate value. Journal of Financial Economics, 27(2), 263-290.
Mikkelson, W. H., & Ruback, R. S. (1985). An empirical analysis of the Interfirm Equity Investment Process. Journal of Financial Economics, 14(4), 523-553.
Mikkelson, W. H., & Partch, M. M. (1989). Managers voting rights and corporate control. Journal of Financial Economics, 25(2), 263-290.
Mitchell, M, & Lehn, K. (1990). Do bad bidders become good targets? Journal of Political Economy, 98(2), 372-398.
Moeller, S. B., Schlingemann, F. P., & Stulz, R. M. (2004). Firm size and the gains from acquisitions. Journal of Financial Economics, 73(2), 201-228.
Morck, R., Shleifer, A., & Vishny, R. W. (1988). Management ownership and market valuation: an empirical analysis. Journal of Financial Economics, 20(1&2), 293-315.
Offenberg, D. (2009). Firm size and the effectiveness of the market for corporate control. Journal of Corporate Finance, 15(1), 66-79.
Ohlson, J. (1980). Financial ratios and the probabilistic prediction of bankruptcy. Journal of Accounting Research, 18(1), 109-131.
Palepu, K. (1986). Predicting Takeover Targets. A methodological and empirical analysis. Journal of Accounting and Economics, 8(1), 3-35.
Shome, D. K., & S. Singh, S. (1995). Firm value and external blockholdings. Financial Management, 24(4), 3-14.
Thompson, S. (1997). Takeover activity among financial mutuals: an analysis of target characteristics. Journal of Banking and Finance, 21(1), 37-53.
Travlos N. (1987). Corporate takeover bids, method of payment, and bidding firms stock returns. Journal of Finance, 42(4), 943-963.
Yermack, D. (1996). Higher market valuation of companies with a small board of directors. Journal of Financial Economics, 40(2), 185-211.
Yermack, D. (2006). Flights of fancy: corporate jets, CEO perquisites and inferior shareholder returns. Journal of Financial Economics, 80(1), 211-242.
-
See, for example, Cockburn & Griliches (1988), McConnell & Servaes (1990), Hermalin & Weisbach (1991), Lang & Stulz (1994), Agrawal & Knoeber (1996), Yermack (1996), Cho (1998), and Daines (2001).
-
See Yermack (1996) and Claessens, Djankov, Fan, & Lang (2002). Agrawal & Knoeber (1996) assert that " growth opportunities and q should be lower for larger firms" (pg. 385).
-
This analysis presumes that all shareholders will bear agency costs. As Jensen & Meckling (1976) point out, any time there is a separation of ownership and control, there will be agency costs. In this paper, agency costs are described as tolerable if the manager could not be disciplined in some way so as to reduce future agency costs.
-
See Denis and McConnell (2003) for a thorough survey of the literature.
-
As of 12/31/2009, the market capitalization of Walmart, Inc. was $204 billion, while that of Winnebago, Inc. was $355 million.
-
By forcing firms to have data in Compustat after the last acquisition, data for 289 acquisitions made by 217 firms are lost. Of those, only two are made by companies that are not already included in the sample.
-
The key results of this study are indifferent to estimating the parameters of the market model with an equal-weighted index rather than a value weighted index. Similarly, using a shorter event window to calculate the cumulative abnormal returns, [-2, 2], does not change the sign nor the significance of the results that establish the main findings of the paper.
-
Antoniou et al. (2007) document a sample of 319 serial acquirers in the UK that make an average of 4.39 acquisitions each. Fuller et al. (2002) document a similar sample in the United States.
-
Tobins q is calculated with the market value of assets in the numerator, so q will always be positively correlated with the market value of assets by design. Therefore, using assets as a measure of size would be a faulty empirical technique.
-
Note that the results of all of the regression models do not change substantially if the 1980s dummy variable is replaced by separate dummies for the early 1980s, late 1980s, early 1990s, and late 1990s. The results also hold if individual year dummies are included instead.
-
Deals in January represent 8.14% of the sample, or almost exactly 1/12.
-
There is not enough overlap between the sample of acquirers used in the beginning of the paper and the G-Index sample introduced here to combine them into one panel and run meaningful statistical tests.
Received: August 28, 2010
