Services on Demand
Journal

Article
 English (pdf)
 Article in xml format
 Article references
 Send this article by e-mail
Indicators
-
 Cited by SciELO
Related links
-
 Similars in
SciELO
Similars in
SciELO
Share

 Permalink
Journal of Economics, Finance and Administrative Science
Print version ISSN 2077-1886
Journal of Economics, Finance and Administrative Science vol.20 no.39 Lima Dec. 2015
Article
Little value creation, articulation and propagating forces: A hypothesis for the Mexican manufacturing sector
Escasez de la creación de valor, articulación y fuerzas de propagación: una hipótesis para el sector manufacturero de México
Santiago Roca T.1; Luis Simabuko N.2
1 Centro de Propiedad Intelectual, Competencia, Consumidor y Comercio, Cepic, Graduate School of Business, Universidad ESAN, Lima-Peru. Ph.D. Cornell University
2 Research fellow, Graduate School of Business, Universidad ESAN, Lima-Peru
DOI: 10.1016/j.jefas.2015.08.003
Abstract
This paper evaluates the impact of Mexican trade and productive integration processes during the last 20 years. It finds evidence that growing per capita income in Mexico is directly related to its “trade opening”, but is inversely related to the growth of its manufacturing export industry. Specifically, for each point of growth in “trade opening” (as a proportion of GDP) per capita income grew by 0.22%; while each point of increase in the share of industrial exports reduced income per person by 0.09%.
To explain this apparent contradiction between the positive effect of “trade opening” and the negative impact of productive manufacturing specialization, we examined the characteristics of Mexico's industry. Results show that although Mexico's export-led industrialization successfully adapted to the world market and transformed its productive, business, organizational and technological structure, it did not translate into adequate macroeconomic benefits due to the absence of strong value dissemination forces over the rest of the economy.
In this sense, poor internal linkages in the maquila industry, its high propensity to import, and its limited value added generation, among other elements, led the Mexican industry to operate as an export enclave. In those circumstances, manufacturing does not generates positive externalities nor articulations, nor strong disseminations that increase and multiplies value in other sectors of industry, thus limiting expansion effects and restraining or even reducing–under some specific circumstances–per capita income growth.
Keywords: Industrialization. Technological change. Industrial policy. Trade. Latin America.
Resumen
Este documento evalúa el impacto del comercio y los procesos de integración productiva de México durante los últimos veinte años. Aporta evidencia acerca de que el crecimiento de la renta per cápita en México se halla directamente relacionado con su “apertura comercial”, aunque guarda una relación inversa con el crecimiento de su industria de exportación manufacturera. De modo específico, para cada punto de crecimiento de la “apertura comercial” (como proporción del PIB), la renta per cápita creció un 0.22%, mientras que cada punto de incremento de la cuota de exportaciones industriales redujo la renta per cápita en un 0.09%.
Para explicar esta aparente contradicción entre el efecto positivo de la “apertura comercial” y el impacto negativo de la especialización manufacturera productiva, examinamos las características de la industria mexicana. Los resultados muestran que aunque la industrialización impulsada por la exportación de México se ha adaptado exitosamente al mercado mundial, transformando su estructura productiva, comercial, organizativa y tecnológica, ello no se ha traducido en los beneficios macroeconómicos adecuados, debido a la ausencia de unas sólidas fuerzas de diseminación del valor sobre el resto de la economía.
En este sentido, los débiles vínculos internos en la industria de maquila, su elevada propensión a la importación, y su limitada generación de valor añadido, entre otros elementos, han llevado a la industria mexicana a operar como un enclave exportador. En estas circunstancias, la fabricación no genera externalidades ni articulaciones, ni fuertes diseminaciones que incrementen y multipliquen el valor en otros sectores de la industria, limitando, por tanto, los efectos de expansión, así como restringiendo, e incluso reduciendo, bajo circunstancias específicas, el crecimiento de la renta per cápita.
Palabras clave: Industrialización. Cambio tecnológico. Política industrial. Comercio. Latinoamérica.
1. Introduction
This paper evaluates the impact of Mexican trade opening and productive specialization on per capita income. It specifically analyses how trade opening and specialization in manufacturing exports has affected per capita income.
Standard international trade theory assumes that trade opening will automatically make countries better off. Some of the major developing economists argue this is not necessarily true, opening and specialization in raw materials may reduce instead of increase standards of living. Many of them say that it is only through industrialization that income per capita will increase. This paper tests these different hypotheses. The second section briefly summarizes the economic literature on trade opening, and productive specialization and growth. The third section estimates the impact of trade opening and specialization on Mexican economic growth. Sections four and five explain major empirical findings: how trade opening has increase GDP per capita and why specialization in manufacturing exports has had a significant negative contribution to per capita income. Finally, the paper draws some major conclusions regarding conditions for better economic growth.
1.1. Trade opening and growth
There are several reasons why “trade opening” and commercial exchanges in general favor economic growth.
-
First, trade permits local companies to buy foreign goods, services, inputs, machinery and equipment, and technology, not available locally or available at a greater cost.
-
The second is that opening of trade allows for the introduction of new ideas, new forms of entrepreneurial organizations and various types of management techniques.
-
Third, trade opening eventually allows small countries to increase their exports and to gain access to broader markets, with which they could increase their income levels.
-
Fourth, broader markets could also have greater possibilities to benefit from economies of scope and scale and from the international division of labor (Krugman, 1991).
-
Related to the previous idea is that broader market leads to larger R&D spending, which accelerates technological change and economic growth (Romer, 1990).
-
Finally, a more open business environment creates more competition in the internal market, increasing the efficiency of local firms compared to when there are restrictions to international trade.
Diverse empirical works based on econometric analysis (Dollar, 1992; Sachs & Warner, 1995; Edwards, 1992) have come across evidence of the positive relationship between trade opening and economic growth. For example, Dollar and Kraay (2001) estimate that an increase in the volume of trade (as % of GDP) by 20 percent results in an increase in the annual growth rate between 0.5 and 1%. Other empirical investigations —based themselves on gravity models— try to isolate and separate the net impact of “trade opening” from other structural and institutional factors. For example, Frankel and Romer (1999) consider the gravity model and some demographic factors; Dollar and Kraay (2003), consider the gravity model plus social, historical and institutional variables.
1.1.1. Productive specialization and growth
Diverse springs of economic thought consider that the type of specialization (productive specialization) determines economic growth. That is, economic activities are not equivalent creators of value, nor they are neutral at all. The common denomfinator of all these theories is that certain economic activities are preferable to others due to some intrinsic or extrinsic qualities than other sectors lack. One of these is the work by Graham (1923) who demonstrates that:
-
In a world of two countries, if one country specializes in goods with increasing returns and the other country in goods with decreasing returns, the world will overall have increased income, but the level of the second country's income will be diminishing, while the first country's income will be increasing.
-
Moreover, the level of income for both countries will be greater if and only if the two countries produce with similar returns.
Graham, like many of his predecessors of past centuries, was of the opinion that the use of raw materials has intrinsically decreasing returns, while the production of manufactured products presents increasing returns.
In the middle of the past century, Prebisch and Singer, for example, showed that countries specializing in natural resources hurt themselves because the price of these products grow relatively more slowly than the price of manufactured products, due to the smaller income elasticity of the former and the asymmetry of international markets. For Hirschman, agriculture lacks upstream and downstream links or the complex division of labor current in manufacturing. Myrdal speaks about “cumulative causations” present in manufacturing but absent in natural resources based industry.
In the 1990s, Matsuyama (1992) and other authors said that manufacturing presents positive effects for growth absent from agriculture, resulting from bigger “induced learning” that neither agriculture nor the service sector offer. Sachs and Warner (1995a) and Sala-i-Martin (1997) found that economies specializing in goods production and exports on the basis of intensive natural resources use tend to grow slightly more slowly than those exporting manufactured products. While for Sachs and Warner the reason should have been the poor development of the institutions created by a primary exporting economy, for Sala-i-Martin the interpretation of these results is not very clear.
Reinert (2002), from a Schumpeterian perspective, argues that economic activities are qualitatively different in the way technological progress spreads and in the way benefits from this progress are distributed, and that this difference determines economic growth and income inequality among nations. For this reason, he proposes a “quality index” of economic activities where high quality jobs show increasing returns, imperfect competition, steep learning curves, rapid technological changes and large investments in R&D, while, in the lower level, low quality jobs show decreasing returns, perfect competition, relatively flat learning curves, little technological development and low investment in R&D. Reinert concludes that the present industrial economies have elected, actively and consciously, high quality activities while non-industrial economies are stuck with low quality activities.
Empirical works like that of the IDB show that “countries where the exports with intermediate and high technological content represent 10% of GDP tend to grow between 0.1 and 0.2 percent more than others that, other factors being equal, do not export this type of goods” (IDB 2001: 55). Likewise, Ros’ work found that “for similar initial income and investment rate, the countries that specialize in manufacturing exports grew from 1960-1990 at a faster rate than exporters of primary products” (Ros, 2001).
Finally, from the perspective of general economic specialization and not of trade specialization, Roca and Simabuko, 1999; Roca and Simabuko, 2004 found that in the Peruvian economy of 1950-1997, for each percentage point of primary goods growth, per capita consumption fell by 2.6% and real wages and salaries fell by 5.4% and 7.4%, respectively. However, for each additional percentage point in manufacturing, per capita consumption rose by 4.2% and real wages and salaries increased by 10.6% and 15.5%, respectively. In the construction sector, positive impacts were also estimated, although notoriously lower than the estimates for industry. Lastly, in services, the impact is estimated close to zero.
In general, most supporters of the non-neutrality of countries’ productive specialization, think manufacturing or industrial specialization seems preferable to development based on the exploiting the natural resource base. Higher quality activities are ranked as such not only for their potential to create greater value, but also for their potential to add value to the system as a whole, through their synergies, externalities, links and other strong value propagators.
2. Impact of trade opening and productive specialization on Mexican economic growth
2.1. PBI per capita, trade opening and exports
In the eighties, Mexico's per capita income showed an oscillating but decreasing trajectory (Figure 1), especially in the second five-year period where there was a visible fall of 6% between 1986 and 1988. In the nineties, the evolution of this indicator was much more encouraging, as it grown at an average annual rate of 1.7%, only interrupted between 1995 and 1996 due to the country's financial and foreign exchange crisis.
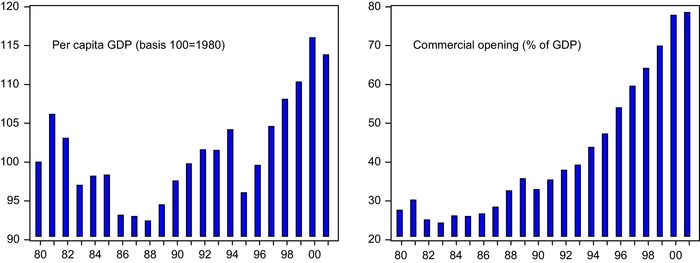
Figure 1: Mexico's per capita GDP and trade opening, 1980-2001.
Source: CEPAL.
Throughout the eighties, Mexico's trade opening (M + X)/PBI stayed at an average below 30% of GDP, but a rapid and continued liberalization and trade opening led at the end of the nineties to an opening exceeding 70% of GDP, after increasing integration of the North American market through NAFTA.
As regards the makeup of exports (Figure 2), between 1980 and 2000, a strong backward movement of primary exports was observed, and that reduced their share from 81% to 12%. This smaller participation of primary exports was possible at the expense of a larger export industry, especially those industrial goods disseminating technological progress, like machinery and equipment, which came to represent from 1% of exports in 1980 to 40% in 2000. Another strong growth area was the export of durable consumer goods, like electrical appliances and vehicles, which grew from 2% to 23%, and the traditional export industries, like food, beverages and tobacco, that increased from 6% to 18%.
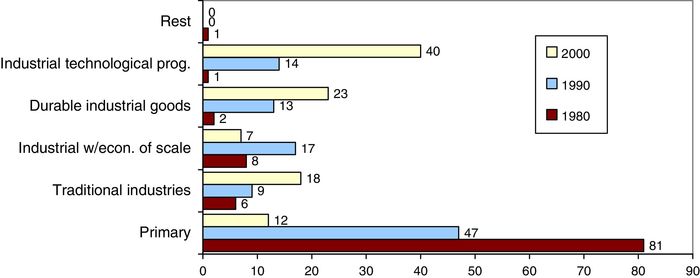
Figure 2: Composition of Mexico's export goods (%).
Source: CEPAL.
2.2. A simple GDP per capita regression model
To analyze the relationship between PBI per capita, trade opening and productive specialization, a single time series model is proposed where the dependent variable is the per capita GDP and the independent or explanatory variables are trade opening and specialization in manufacturing activities. The model to be estimated is the following:

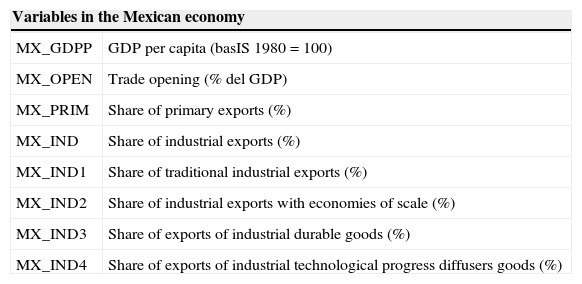
where, GDPPt GDP per capita; OPEN t Exports + imports (as % of GDP); SPEC t Productive specialization: Exports of industrial products (as % of the total export of goods); e t Other variables that affect the GDP per capita.
Both per capita GDP and the indicator of trade opening are calculated in real dollars; while exports composition follows CEPAL's breakdown as: 1) primary exports, 2) industrial exports, and 3) rest. CEPAL subdivides the industrial exports category into: 1) traditional, 2) goods presenting significant economies of scale and high intensity of natural resources, 3) durable goods, and 4) technological progress diffuser goods. (Cepal, 2003; Cepal, 2003a). (See CEPAL's export classification and data base on Appendix A and Appendix B at the end of this article).
In agreement with the trade opening and productive specialization theories on the previous section, the two hypotheses to evaluate are the following:
Hypothesis I
a1 > 0. Trade opening positively affects economic growth.
Hypothesis II
a2 > 0. Export specialization in industrial activities has a positive impact on economic growth.
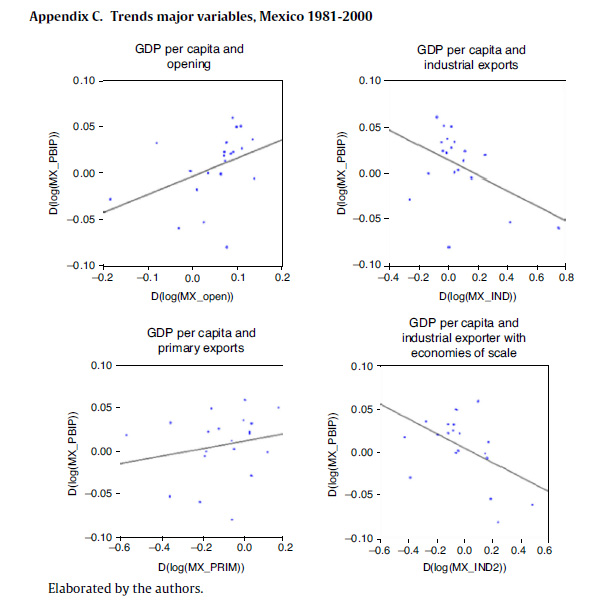
The correlation matrix for primary differences (see Table 1 and 1a) shows a positive relationship between the increase of per capita income (MX_GDPP) and the level of trade openness (MX_OPEN), which is in agreement with economic theory premises that a larger trade opening drives economic growth. However, a negative relationship is observed between per capita income and the participation of industrial exports on the country's total exports goods (MX_IND). Consistently enough a positive relationship is observed between per capita income and the share of primary exports (MX_PRIM) in total exports (See Appendix C).
Table 1: Correlation matrix (in differences).
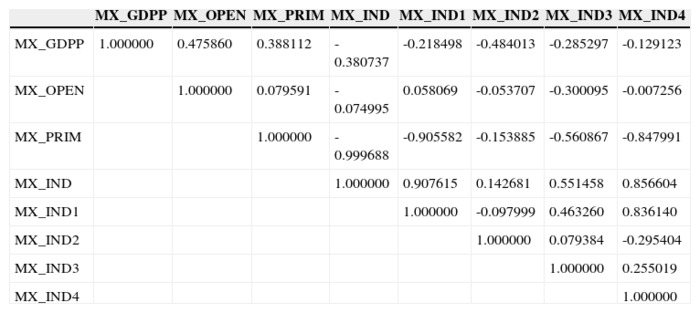
Elaborated by the author.
Moreover, the negative relationship between income per capita and the industrialization of Mexican exports is observed in diverse industrial indicators, as in the case of traditional industrial exports (MX_INDI), products with economies of scale (MX_IND2) (Appendix C), durable goods (MX_IND3) and technological development diffuser products (MX_IND4).
Having taken into account the observed relationships, the estimated equation for the Mexican economy is: D(LOG(MX_GDPP)) = a1 D(LOG(MX_OPEN)) + a2 D(LOG(MX_IND)) + a3 D95 (Regression 1). This regression captures approximately 74% of the increase of per capita GDP between 1981 and 2000 and has as explanatory variables: 1) trade opening, 2) share of industrial exports and 3) a dummy variable D95 representing the 1995 Mexican crisis.
According to these results, the primary hypothesis is confirmed, i.e. trade opening drove Mexico's economic growth between 1980 and 2000; however, the second hypothesis is rejected, in the sense that Mexican industrial exports has a negative relationship with per capita GDP growth.
It is estimated that for each growth point in trade opening (as a share of GDP) the per capita income grew 0.22%; while for each extra point in the share of industrial exports, the income per person decreased by 0.09%. Because the relative negative impact of productive specialization is smaller in absolute terms than that of trade opening, the final impact on the growth of Mexican economy remains positive.
From another perspective, if instead of using in model regression the share of manufacturing exports, we used the share of primary exports, the relationship between this variable with per capita GDP is positive (significant at 11%) and with a value of 0.06%. (See regression 2 below). This means that the increase in the share of natural resource exports will involve —in the case of Mexico— an increase of per capita GDP of 0.06%. This result openly questions the hypothesis that “specialization in raw materials-based production contributes less to the increase of production than producing manufactured goods”. In Mexico the exact opposite occurs. A preliminary explanation of this apparent contradiction with the literature and empirical evidence from other countries (mentioned in the previous section), relates to the specific characteristics of the natural resources sector in Mexico. It may be that the generation of rents in the use of natural resources is so high that on average it exceeds the value creation offered by new manufactured export goods. This indicates that Mexican agriculture and natural resources goods are still in a production zone with growing returns, economies of scale and rent levels that are significantly higher than other production sectors, including manufacturing. Additionally, quite likely its downstream links have a larger domestic multiplier affect than the new links created by the new types of manufactured export goods. The following section analyzes in more detail some of these probable links from the point of view of the potential to create value in the present Mexican manufacturing industry.
Table 2: Contribution to GDP per capita growth Average in the eighties against the nineties.
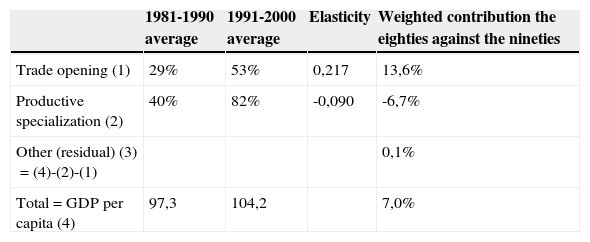
Estimation based on regression 1.
Elaborated by the author.
Table 2 using regression 1 shows the components of Mexico's average economic growth in the eighties against the nineties. It shows that the 7% overall increase of per capita income (between the eighties and the nineties) is explained by the positive contribution from trade opening (13.6%), the negative contribution of productive specialization (-6.7%) and the net positive impact of other factors1 (0.1%). This means that Mexico's per capita GDP growth (7% between these two decades) is fundamentally explained by the trade opening capacity to neutralize and compensate for the negative impact of the productive specialization.
Table 3: Export structure by countries (%).
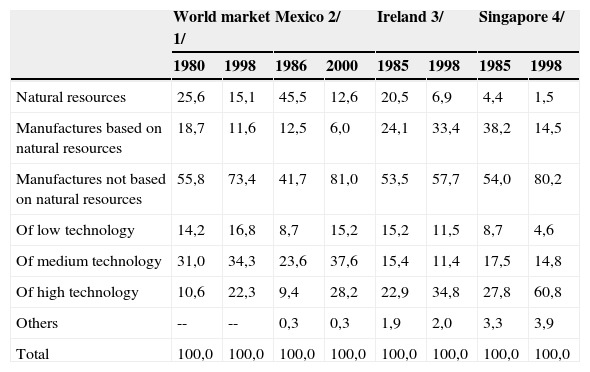
1/BID, 2001.
2/CEPAL, 2003
3/Mortimore, Vergara and Katz, 2001
4/Mortimore, Vergara and Katz, 2001
3. How does trade opening increases GDP per capita?
In general, more open trade favors economic growth to the extend it allows countries to access larger markets and to dispose of new technologies, inputs, ideas, and management, which improve firm efficiency and drive economies of scale and scope in productive activities. In this sense, the growth of Mexico's export industry is largely explained to the signing of the Free Trade Agreement with the United States and Canada (NAFTA) and the development of the maquila industry that goes back, originally, to the Border Industrialization Program of the seventies.
It is clear that NAFTA allowed Mexico free access to 317 million persons (5.2% of world population) with an import capacity of about 1.4 billion dollars (22% of world imports and 9 times Mexican exports). Most importantly is that the Mexican economy took advantage of this preferential access placing itself in ten years among the main trade partners of the United States. This greater commercial exchange was correlated to larger investment flows, given that US firms (looking for efficiency and cost reduction) heavily invested in the Mexican manufacturing sector as a way to effectively compete in its own market with Asian's automobiles, electrical appliances, garments and other imports.
To provide goods to the North American market Mexico had accordingly to restructure its productive sector to the new trends and composition of US and world demand. The Mexican economy changed its export structure originally based in natural resources intensive goods towards a structure based on medium and high technology industrial goods. This new Mexican export development was coherent with last 20 years observed changes in world trade as well as the huge productive transformations of successful export industrializing countries like Ireland and Singapore (see Table 3).
Table 4: Mexican imports by five-year periods (millions of dollars).
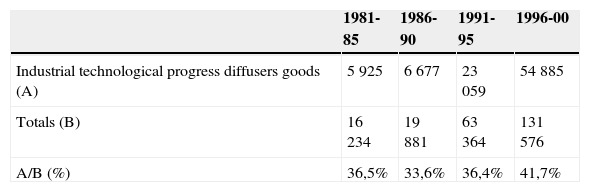
Source: INEGI (www.inegi.gob.mx)
Obviously enough to change its productive structure Mexico had to open itself to greater volumes of imports with higher technological components and productivity (Table 4). Specifically in the last 20 years, imports of industrial goods acting as diffusers of technological progress (machinery and equipment) increased from an annual average of 5.9 billion dollars in the first half of the eighties (36.5% of the total imports) to 54.9 billion dollars in the second half of the nineties (41.7% of the imports).
Table 5: Index of labor productivity in manufacturing (Basis 100 = 1993).
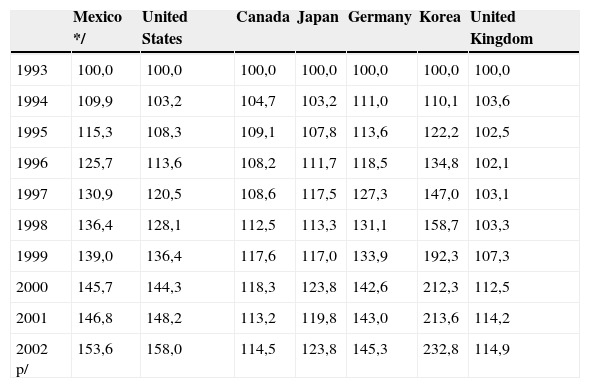
* Excluding maquila. P = Preliminary
Source: INEGI (www.inegi.gob.mx).
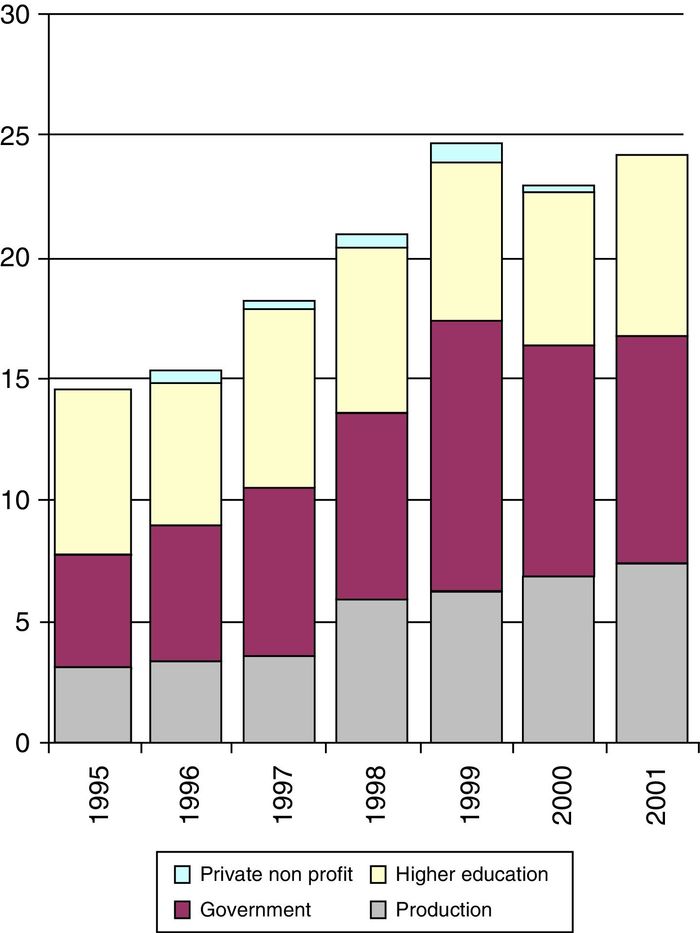
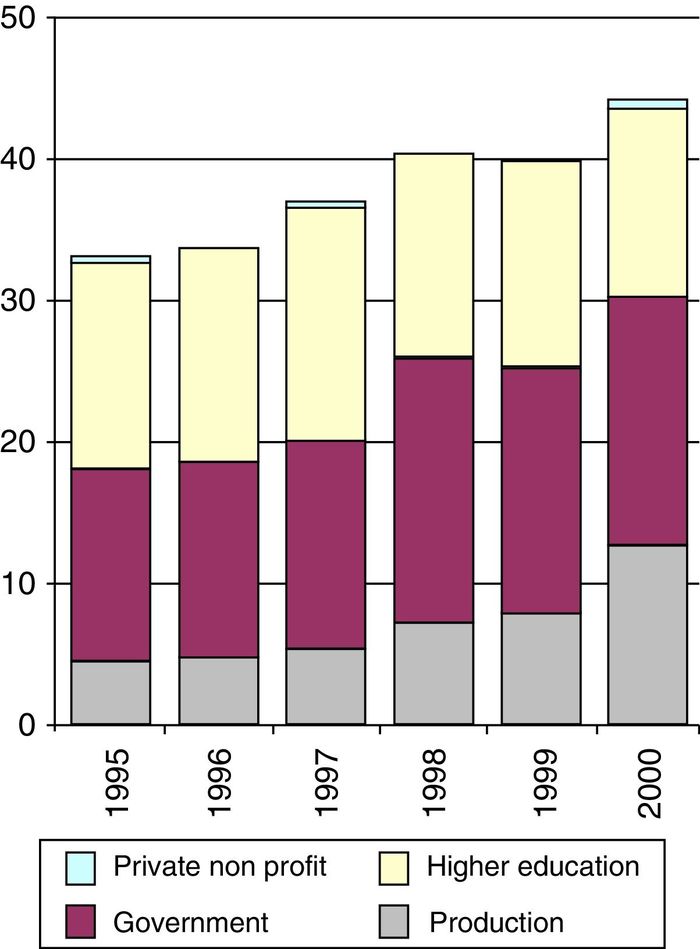
Experimental real terms R&D expenses grew 67% between 1995 and 2001, in particular expenses in the production sector (+143%) and government (+97%). Likewise, the R&D workforce expanded by 32%, with the productive sector absorbing the largest part of this increment through growth of 185% (Figures 3 and 4).
Figure 3: Experimental R&D. Mexico (millions of pesos).
Source: CONACYT.
Figure 4: R&D workforce growth (thousand of equivalent full time.
Source: CONACYT.
These increases in imports and in R&D spending and workforce had positive repercussions in the levels of productivity in the manufacturing sector. Although the low absolute level of average productivity of Mexico's labor in comparison to the developed countries is well known, it is estimated that between 1993 and 2002, labor productivity in the Mexican manufacturing sector (excluding maquila activities) experienced a 54% increase, or slightly less than in the United States (+ 58%), but above Germany (+45%), Japan (+24%), Canada (+15%) and the United Kingdom (+15%). This is an indication that, despite the large differences of productivity in absolute terms that still exist, Mexico has managed to increase its productivity at a faster pace than most industrialized countries (Table 5). South Korea shows the largest productivity increase of all, at about 133%.
Table 6: Mexican maquila: Typology of production organization models.
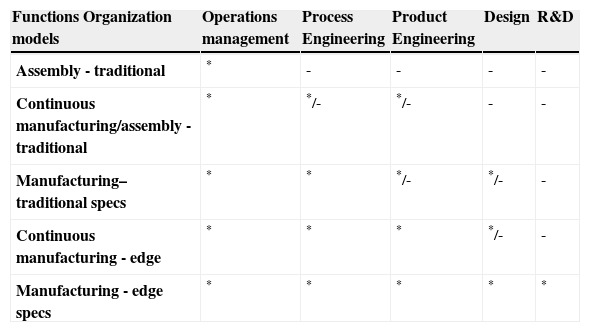
* = present
- = absent
*/- = present only for greater product complexity
Source: Alonso, Carrillo and Contreras, 2002; p. 26.
Concerning the exporting maquila industry, various research studies pointed out that through the years Mexican maquila is moving from the old-coined style (old textile industry) to the newly–coined maquila more related to electric and electronic appliances, and the mecatronics and electronics components industry (Alonso, Carrillo & Contreras, 2002). This process clearly shows that industrial organization, production methods, and labor training among many other variables are experimenting dramatic structural changes in this sector (opus cit).
While the old-coined maquila has almost no impact on business development, since these organizations hardly perform operational administrative activities and process engineering, the newly-coined maquila undertakes much more complex activities (see Table 6). For example, in the electric and electronic appliances industry, in addition to the ordinary old style assembly processes, the authors identify product engineering and design activities. Likewise, in addition to the activities already described, the electronic and mechatronic industry also performs R&D activities, which involve a greater business and technological development, and labor training, among other more complex functions and/or activities (Alonso, Carrillo & Contreras, 2002).
Table 7: Inputs bought by Mexican maquila (as % of GVP).
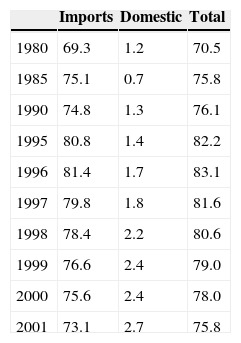
Source: CEPAL, 2003; p. 13.
In summary, this section has analyzed various transmission mechanisms through which “trade opening” is positively impacting economic growth. In the Mexican case it is particularly relevant to point up the role play by NAFTA and the maquila industry. Both allowed access to a larger preferential market and propelled a significant restructuring of exports towards medium and high technology industrial activities. Nonetheless these “trade opening” positive effects, there is also evidence that the greater export of manufactures affected negatively economic growth. More about this last point will be analyze in the next section.
4. Why specialization in manufacturing exports does not increase GDP per capita?
The most controversial finding of the present study is the negative relationship between industrial exports and per capita GDP. This relation is in conflict with the idea that export industrialization per se should bring an increase in GDP per capita. In the case of Mexico each additional point of participation of industrial exports to total exports originates a 0.09% reduction in per capita income per year.
What factors explain this negative relationship between the industrial exports and per capita income? The answer will be explored studying the nature of the Mexican export industry, which for the sake of a more simple analysis, will be define by the characteristics of the maquiladora industry.
Why a “successful” industrialization —in terms of adaptation to the world market and company and technology transformation among other aspects explained in section 3— is counterbalanced in its macroeconomic benefits by these negative forces?
In general and to a great extent, nothing guarantees that specialization in labor intensive activities or even in high technological industrial exports benefits the economy as a whole if those activities (Some of these theses are proposed by UNCTAD (2001):
-
Develop in world market segments that may saturate quickly, and consequently where prices may drop as a tendency.
-
Fail to develop a more profound division of labor and a highly trained specialized technological workforce.
-
Create limited internal and inter-industry links or few ties with the local companies, which will arrest the potential benefits of its growth from spreading to the rest of the economy.
-
Provide limited potential for disseminating or diffusing the lessons learned to other sectors.
-
Be accompanied by a gradual increase of value added by the activity involved and by the entire productive system.
-
Base its competitiveness exclusively on low salaries. If so, sector growth would be self-defeating as it would increase salaries and, therefore, eradicate the presumed competitive advantage of labor.
From the analysis of these six factors, we have information that proves that the growth of Mexican industrial exports failed at least on three accounts: 1) limited industrial links, 2) little growth in value added and, 3) growth largely based on comparative advantage provided by cheap labor. These three factors are analyzed in detail below. Other three issues need further research and statistical information.
In Table 7, purchases of imported inputs account for between 70% and 80% of Gross Value of Production (GVP), while the weight of domestic inputs is extremely small since it does not exceed 3% of GVP. Since the maquila industry's import propensity has not changed significantly in the last 20 years, this sector has failed to develop as an integrated productive system and therefore its internal links remain very limited.
Table 8: Composition of VA in Mexican maquila (as % of GVP).
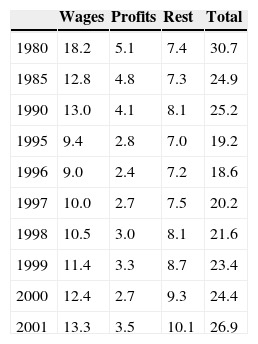
Source: CEPAL, 2003; p. 13.
Likewise, an analysis of inter-industrial links reveals that an increase in maquiladoras value added derives from stagnation or slow growth in other manufacturing industries. This reveals lack of links and complementarities with other activities. In the nineties, while the maquila industry's value added grew 179%, value added in other manufacturing sectors grew only 11% (Figure 5).
Figure 5: Value added. Maquila and other manufacturing industries. (Billion of 1993 pesos)
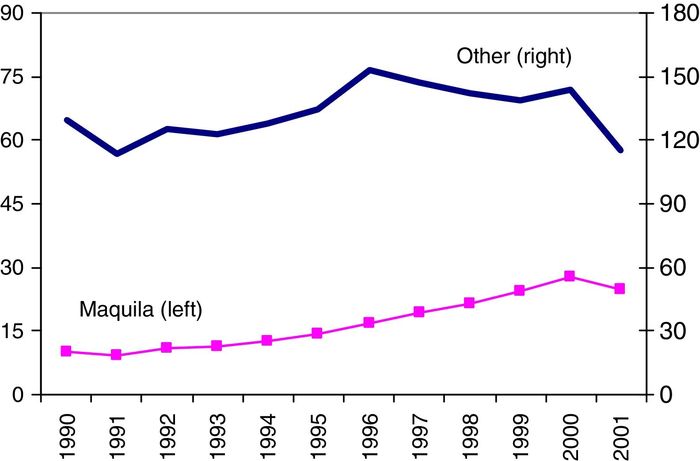
Source: INEGI (www.inegi.gob.mx).
These two facts explain part of the decreasing tendency of per capita income. Progress by the maquila sector will mean —in practice— replacing the traditional productive system that in theory shows better internal linkages and bases its advantages on natural resources (like in the food, beverage, textile, etc. industries), for another new productive system (like the maquila) that shows less internal linkages. In this process to re-structure economic activities, positive externalities from the retreating sector will be lost, with a less than proportional gain in the externalities of the expanding sector. The net balance of recomposing these economic activities would be negative —according to the regressions estimated in this study.
On the other hand value added in the maquila industry, as a share of its GVP decreased until the mid-nineties2, to then bounce back slightly up to 2001, but still at a level below 1980 (see Table 8). Wages and profits the main components of value added, follow a similar path as total VA. Consequently, by 2001 neither of these variables had returned to their 1980 values. In general, in the last 20 years, no remarkable increase was observed in this sector's capacity to create value added. It is unlikely therefore that it will make a contribution to economic growth in any significant way.
Table 9: Maquila's real wages and maquila's GDP (% change).
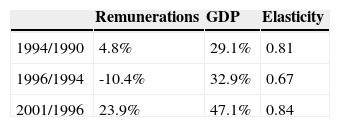
Source: Own elaboration with INEGI data from www.inegi.gob.mx.
Finally, regarding maquila industry competitiveness and investments, Mexican studies by Buitelaar, Padilla, & Urrutia, 1999, show that the principal determinant of these investments is cheap labor —especially by North American companies3. An analysis of evolving real wages in the maquila and its GDP (or VA) in the last 10 years (Figure 6) reveals significant fluctuations in wages, while output rose uninterruptedly except in 2001. Between 1990 and 1994, the average remuneration in the maquila industry increased by 4.8% in real terms, but the financial crisis of 1995 led to a 10.4% fall in the following two years. Between 1996 and 2001 wages grew a strong 23.9%. Maquila's GDP increased over the whole period.
Figure 6: Maquila's real remunerations and GDP (Basis 1990 = 100).
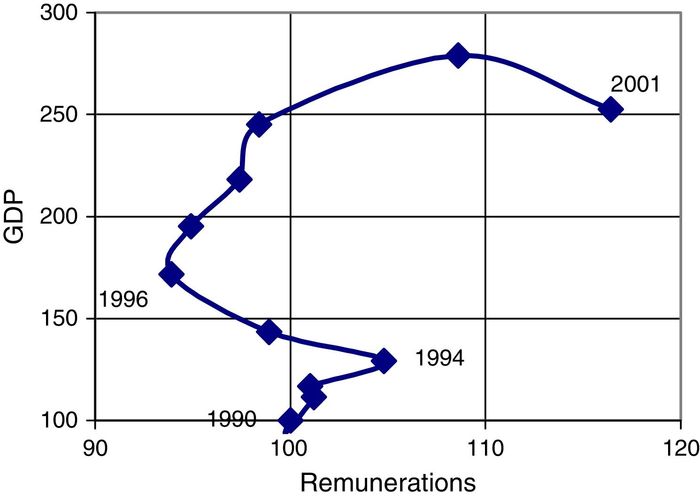
Source: Prepared by the authors with INEGI data from www.inegi.gob.mx.
Table 9 compares this behavior of wages with output growth over the same periods. Estimating a wage to output elasticity indicates that remunerations grew proportionally less than the maquila's GDP. The wage to output elasticity numbers are below 1 (0.81, 0.67, 0.84 and 0.46 for indicated periods).
Although the above data does not point to a clear growth bottleneck, it does indicate that the sector's wages will continue to be competitive, since wages are growing more slowly than value added. Productivity increases are higher than wage increases.
5. Conclusions
This paper evaluates the impact of Mexican trade and productive integration process during the last 20 years. It finds evidence that growing per capita income in Mexico is directly related to its “trade opening”, but is inversely related to the growth of its manufacturing export industry. Specifically, for each point of growth in “trade opening” (as a proportion of GDP) per capita income grew by 0.22%; while each point of increase in the share of industrial exports reduced income per person by 0.09%. It shows that the 7% overall increase of Mexican per capita income between the eighties and the nineties is explained by 13,6 points from trade opening, -6,7 points from specializing in manufacturing exports and 0,1 points from other factors.
To explain this apparent contradiction between the positive effect of “trade opening” and the negative impact of productive manufacturing specialization, we examined the characteristics of Mexico's industry. Results show that although Mexico's export-led industrialization successfully adapted to the world market and transformed its productive, business, organizational and technological structure, it did not translate into adequate macroeconomic benefits due to the absence of strong value dissemination forces over the rest of the economy.
In this sense, poor internal linkages in the maquila industry, its high propensity to import, and its limited value added generation, among other elements, led the Mexican industry to operate as an export enclave. In those circumstances, manufacturing does not generates positive externalities nor articulations, nor strong disseminations that increase and multiplies value in other sectors of industry, thus limiting expansion effects and restraining or even reducing —under some specific circumstances— per capita income growth.
References
Alonso J., Carrillo J., Contreras O. (2002). Enero-Junio. Aprendizaje tecnológico en las maquiladoras del norte de México. En Frontera Norte. 14:(27)43-82.
BID (2001). Competitividad, el motor del crecimiento: progreso económico social en América latina. Informe 2001. Washington, DC: BID, p.292.
Buitelaar R., Padilla R., Urrutia R. (1999). Abril. Industria maquiladora y cambio técnico. Revista CEPAL. 67:133-52.
Cepal (2003). Anuario Estadístico de América latina y el Caribe, 2002. Santiago de Chile: Cepal.
Cepal (2003a). Panorama de la inserción internacional de América latina y el Caribe, 2001-2002. Santiago de Chile: Cepal.
Dollar, D. (1992). April. Outward-oriented developing countries really do grow more rapidly: Evidence from 95 LDCs. 1976-85. Economic Development and Cultural Change.
Dollar, D. and A. Kraay (2001). Trade, growth, and poverty. World Bank Policy Research Working Paper.
Dollar, D. y A. Kraay (2003). Institutions, trade, and growth: Revisiting the evidence. World Bank Research.
Edwards S. (1992). Trade orientation, distortions, and growth in developing countries. Journal of Development Economics ;39:(1)31-57.
Frankel J., Romer D. (1999). June. Does trade cause growth?. The American Economic Review. 379-99.
Graham F.D. (1923). Some aspects of protection further considered. The Quarterly Journal of Economics. February;199-227.
Krugman, P. (comp.) (1991). Una política comercial estratégica para la nueva economía internacional, México, DF: FCE, 303 pp.
Matsuyama, K. (1992). December. Agricultural productivity, comparative advantage, and economic growth. Journal of Economic Theory, 58, New York, Academic Press.
Mortimore, M., Vergara, S. and J. Katz (2001). La competitividad internacional y el desarrollo nacional: implicancias para la política de IDE en América Latina. CEPAL, Serie Desarrollo Productivo, 107.
Reinert, E. (2002). Junio. El rol de la tecnología en la creación de países ricos y pobres: el subdesarrollo en un sistema schumpeteriano. Cuadernos de Difusión, 12. Lima: Escuela de Administración de Negocios para Graduados, ESAN, pp. 7-36.
Roca, S. and L. Simabuko (1999). Diciembre. Value and quality creation: natural resources, industrialization and standards of living in Peru 1950 to 1997. Cuadernos de Difusión, 9-10. Lima: Escuela de Administración de Negocios para Graduados, ESAN, pp. 69-123.
Roca, S., y L. Simabuko (2004) Natural Resources, industrialization and fluctuating standards of living in Peru, 1950-97: A case study of activity-specific economic growth, in Reinert, S. Erik (2004) Globalization, Economic Development and Inequality, Edward Elgar, 339 pp.
Romer, Paul (1990). Endogenous technological change, Journal of Political Economy, Vol. 98, No 5, The University of Chicago Press.
Ros J. (2001). Abril. Política industrial, ventajas comparativas y crecimiento. Revista de la Cepal. 73:129-48.
Sachs, J. and A. Warner (1995). Economic reform and the process of global integration. Brookings Papers on Economic Activity, (1), 1-118.
Sachs, J. y A. Warner (1995a). Natural resource abundance and economic growth. Working Paper 5398, NBER.
Sala-i-Martin X. (1997). I just ran two million regressions. American Economic Review. 87:(1).
Unctad (2001). Informe sobre las inversiones en el mundo, 2001. Objetivo: fomentar las vinculaciones. Panorama general. Nueva York y Ginebra: Naciones Unidas, pp.81.
1Including the negative impact of the 1995 crisis.
2Explained, in part, by the Mexican financial crisis that occured in 1995.
3Other reasons to be considered are preferential access to the North American market (especially, by companies that are not North American), greater profit rates, reduced risk, and tax breaks.
Received October 9, 2014
Accepted August 21, 2015
Corresponding author.
Appendix A. International trade classification categories.
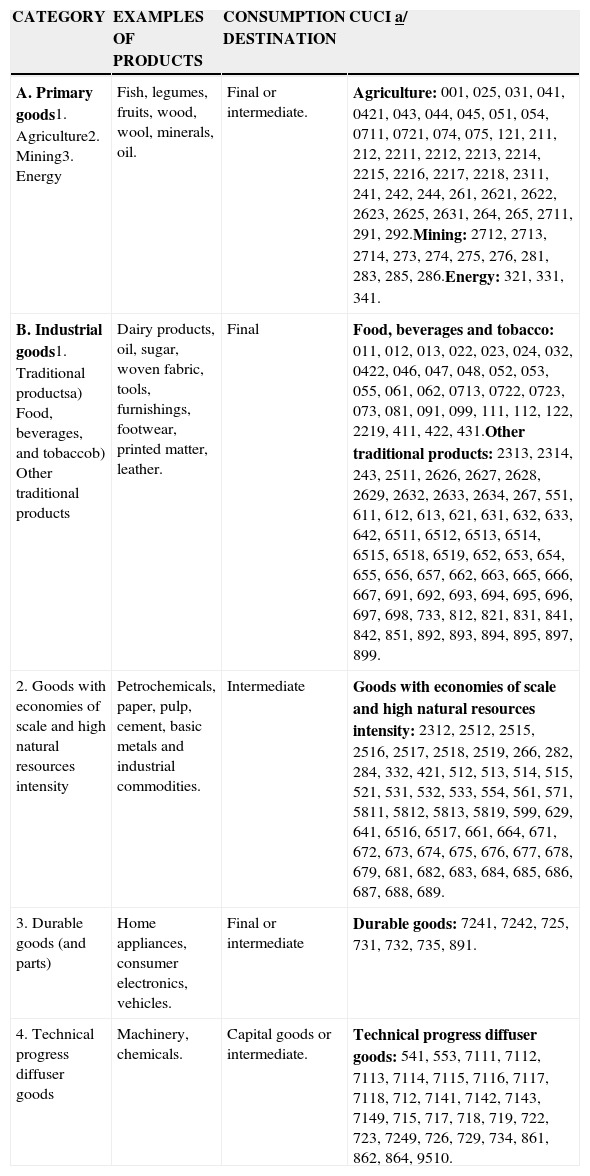
Source: CEPAL, on the base of CEPAL, El comercio de manufacturas de América Latina: evolución y estructura 1962-1989, Estudios e Informes de la CEPAL, N° 88 (LC/G. 1731-P), Santiago de Chile, 1992. ONU publication, N°: S.92.II.G.12; J. C. Ferraz et al., Made in Brazil: desafíos competitivos para a industria, Rio de Janeiro, Editora Campus, 1996; El desafío competitivo para la industria brasileña, Revista de la CEPAL, N° 58 (LC/G. 1916-P), Santiago de Chile, April, 1996; P. Guerrieri y C. Milana, L’Italia e il comercio mondiale: mutamenti e tendeze nella divizione internacional del lavoro, Roma, II Mulino, 1990.a/CUCI = International Trade Uniform Classification, first version.
Appendix B. Statistical data and variables.
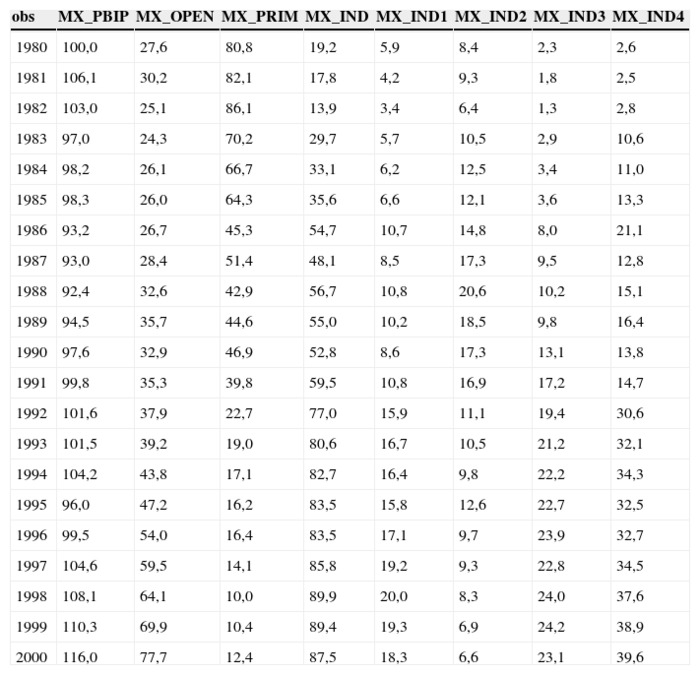
Variables
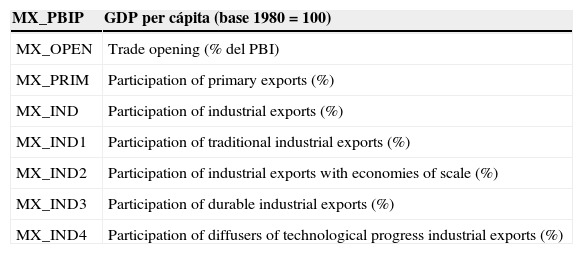
Elaborated by the authors.