


Services on Demand
Journal

Article
 English (pdf)
 Article in xml format
 Article references
 Send this article by e-mail
Indicators
-
 Cited by SciELO
Related links
-
 Similars in
SciELO
Similars in
SciELO
Share

 Permalink
Journal of Economics, Finance and Administrative Science
Print version ISSN 2077-1886
Journal of Economics, Finance and Administrative Science vol.21 no.41 Lima Dec. 2016
ARTICLE
Stock market index prediction using artificial neural network
Predicción del índice del mercado bursátil utilizando una red neuronal artificial
Amin Hedayati Moghaddam1, Moein Hedayati Moghaddam2, Morteza Esfandyari3
1 Department of Chemical and Petroleum Engineering, Sharif University of Technology, Tehran, Iran
2 Faculty of Managing and Accounting, College of Farabi, University of Tehran, Qom, Iran
3 Department of Chemical Engineering, Faculty of Engineering, University of Bojnord, ,Bojnord, Iran
Abstract
In this study the ability of artificial neural network (ANN) in forecasting the daily NASDAQ stock exchange rate was investigated. Several feed forward ANNs that were trained by the back propagation algorithm have been assessed. The methodology used in this study considered the short-term historical stock prices as well as the day of week as inputs. Daily stock exchange rates of NASDAQ from January 28, 2015 to 18 June, 2015 are used to develop a robust model. First 70 days (January 28 to March 7) are selected as training dataset and the last 29 days are used for testing the model prediction ability. Networks for NASDAQ index prediction for two type of input dataset (four prior days and nine prior days) were developed and validated.
Keywords: NASDAQ, ANN, Prediction.
Resumen
En este estudio se investigó la capacidad de previsión del índice bursátil diario NASDAQ, por parte de la red neuronal artificial (RNA). Se evaluaron diversas RNA proalimentadas, que fueron entrenadas mediante un algoritmo de retropropagación. La metodología utilizada en este estudio consideró como inputs los precios bursátiles históricos a corto plazo, así como el día de la semana. Se utilizaron los índices bursátiles diarios de NASDAQ del 28 de enero al 18 de junio de 2015, para desarrollar un modelo robusto. Se seleccionaron los primeros 70 días (del 28 de enero al 7 de marzo) como conjuntos de datos de entrenamiento, y los últimos 29 días para probar la capacidad del modelo de predicción. Se desarrollaron y validaron redes para la predicción del índice NASDAQ, para dos tipos de conjuntos de datos de input (los cuatro y los nueve días previos).
Palabras clave: NASDAQ, ANN, Predicción.
1. Introduction
In studying some phenomenon, developing a mathematical model to simulate the non-linear relations between input and output parameters is a hard task due to complicated nature of these phenomenons. Artificial intelligent systems such as artificial neural networks (ANN), fuzzy inference system (FIS), and adaptive neuro-fuzzy inference system (ANFIS) have been applied to model a wide range of challenging problems in science and engineering. ANN displays better performance in bankruptcy prediction than conventional statistical methods such as discriminant analysis and logistic regression (Quah & Srinivasan 1999). Investigations in credit rating process showed that ANN has better prediction ability than statistical methods due to complex relation between financial and other input variables (Hájek, 2011). Bankruptcy prediction (Alfaro, García, Gámez, & Elizondo, 2008; Lee, Booth, & Alam, 2005; Baek & Cho, 2003), credit risk assessment (Yu, Wang, & Lai, 2008; Angelini, Di Tollo, & Roli, 2008), and security market applications are the other economical areas that ANN has been widely applied. Objective of this study is to investigate the ability of ANN in forecasting the daily NASDAQ stock exchange rate.
2. Background
Guresen, Kayakutlu, and Daim (2011) investigated the performance of multi-layer perceptron (MLP), dynamic ANN, and hybrid ANN models in forecasting the market values. Chen, Leung, and Daouk (2003) used probabilistic neural network (PNN) to predict the direction of Taiwan stock index return. They reported that PNN has higher performance in stock index than generalized methods of moments-Kalman filter and random walk forecasting models. Kuo, Chen, and Hwang (2001) developed a decision support system through combining a genetic algorithm based fuzzy neural network (GFNN) and ANN for stock market. The proposed system was evaluated using the data of Taiwan stock market. Qiu, Liu, and Wang (2012) developed a new forecasting model on the basis of fuzzy time series and C-fuzzy decision trees to predict stock index of shanghai composite index. Atsalakis and Valavanis (2009) developed an adaptive neuro-fuzzy inference controller to forecast next day’s stock price trend. They reported the potential ability of ANFIS in predicting the stock index.
3. Artificial intelligent systems used in forecasting
3.1. Artificial neural network
A neural network is a bio-inspired system with several single processing elements, called neurons. The neurons are connected each other by joint mechanism which is consisted of a set of assigned weights.
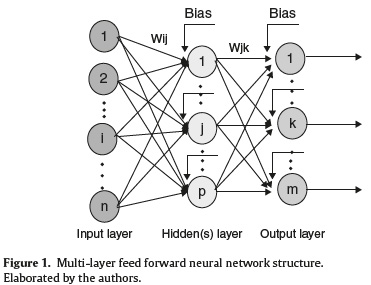
MLP is a common approach in regression-type problems. MLP network has three layers: input layer, output layer, and hidden layer. Neuron takes the values of inputs parameters, sums them up according to the assigned weights, and adds a bias. By applying the transfer function, the value of the outputs would be determined. The number of neurons in input layer corresponded to the number of input parameters. The architecture of a typical MLP is presented in Figure 1.
In mathematical terms, the performance of neuron P can be described as follows:
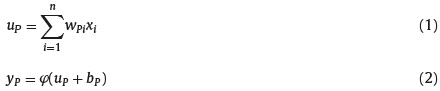
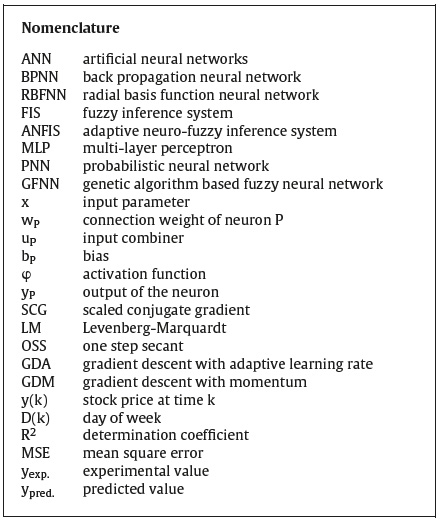
where x1,. . .,xn are the input parameters; wP1,. . .,wPn are the connection weights of neuron P; uP is the input combiner; bP is the bias; is the activation function; and yP is the output of the neuron.
In this study feed forward artificial neural networks that were trained by the back propagation algorithm has been used.
There are several learning techniques such as scaled conjugate gradient (SCG), Levenberg-Marquardt (LM), one step secant (OSS), gradient descent with adaptive learning rate (GDA), gradient descent with momentum (GDM) etc. that are using for training and developing the constructed models.
4. Predicting NASDAQ index
The methodology used in this study considered the short-term historical stock prices as well as the day of week as inputs. The overall procedure is governed by the following equation:

where y(k) is the stock price at time k, n is the number of historical days, and D(k) is the day of week.
Daily stock exchange rates of NASDAQ from January 28, 2015 to 18 June, 2015 are used to develop a robust model. First 70 days (January 28 to March 7) are selected as training dataset and the last 29 days are used for testing the model prediction ability.
For constructing the model, training, and testing procedure MATLAB software R2010a was used. The performance of ANNs was evaluated using the determination coefficient (R2) and the mean square error (MSE) of the modeled output. R2 was determined as follows:
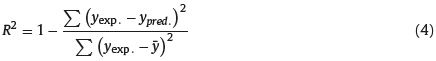
MSE represents the average squared difference between the predicted values estimated from a model and the actual values. MSE was determined by the following equation:
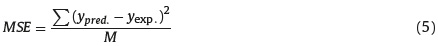
where yexp. and ypred. were experimental and predicted values, respectively, and M was the total number of data.
5. Result and discussion
In this section several networks for NASDAQ index prediction for two input dataset (four prior days and nine prior days) were developed and validated. Then the optimized network structure for both type of dataset was selected according to their abilities in prediction.
5.1. Four prior working days
In Table 1 the values of R2 for different training algorithms and transfer function of a BPNN with 20-40-20 neurons in hidden layers have been shown. In experiments 1 through 3, networks were trained by LM, in experiments 4 through 6 by OSS, and in experiment 7 by GDA method. As is shown, applying OSS training method and TANGSIG transfer function resulted in an optimized trained network according to the values of R2 of validation dataset.
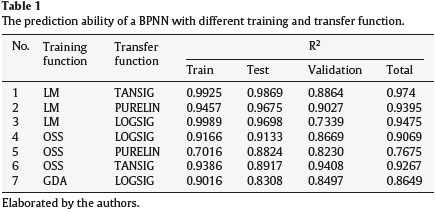
Networks with transfer function of TANSIG or PURELIN and training functions of GDA were not able to generate a robust model (not shown). Accordingly, in the next experiments in the current study OSS and TANSIG were selected as training method and transfer function, respectively.
In Table 2 configurations of MLP are presented. The data achieved from 99 days of NASDAQ index were randomly divided into training set (60%), validation set (20%), and testing set (20%). On the basis of the preliminary study, the training method and transfer function were OSS and TANGSIG, respectively. The architecture of the neural network was optimized by applying different values for the number of hidden layers and number of neurons in each hidden layer. Sixteen networks with different architectures were generated, trained, and tested. R2-values of training set, validation set, and total data were calculated, but only the R2-value of validation was considered to select the optimized architecture of network. It is found that networks with four hidden layers and more were not able to be trained and to generate a robust model (these networks were not shown). As seen in Table 2, R2 had desirable values (maximum value) when the number of hidden layers was 2 and the numbers of neurons in hidden layers were 40. It is worthwhile noting that any changes in number of neurons would influence the model proficiency. For example, as seen in Table 2 although a network with 5-5 had acceptable R2 validation (0.8631) but a network with 5-10 neurons had poor prediction ability.
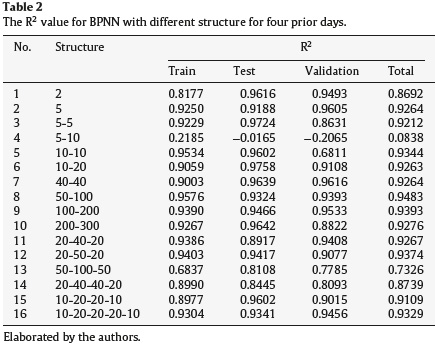
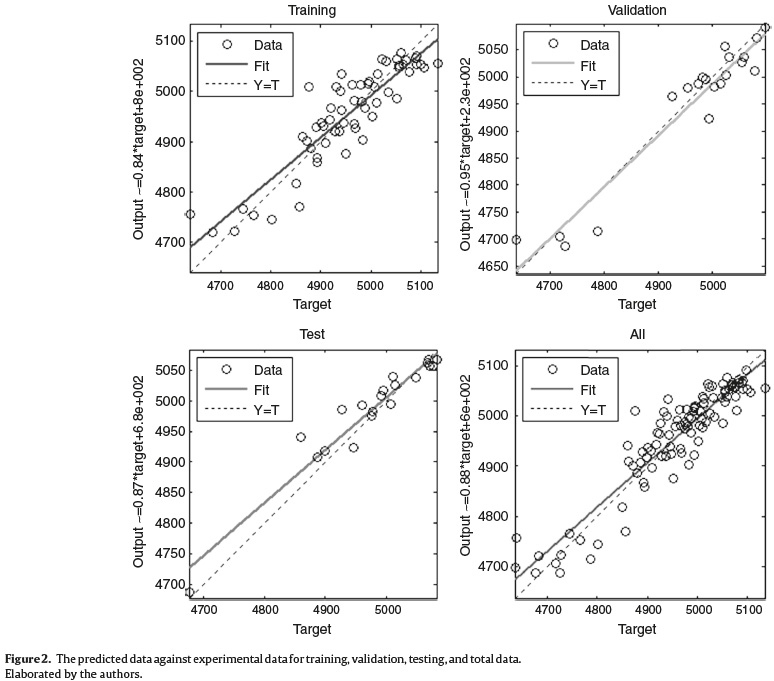
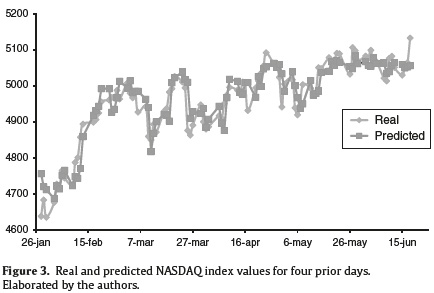
Figure 2 shows the predicted data generated by the optimized BPNN (two hidden layer with forty neurons) against the observed NASDAQ index for training, validation, testing, and total data. Figure 3 shows the real and predicted NASDAQ index values for four prior days in 99 days from 28 January to 18 June 2015.
5.2. Nine prior working days
Similar to four prior days, the values of R2 for different training algorithms and transfer function of aMLPwith 20-40-20 neurons in hidden layers have been generated and tested. Accordingly, applying OSS training method and LOGGSIG transfer function resulted in an optimized trained network according to the values of R2 of validation dataset (0.9622).
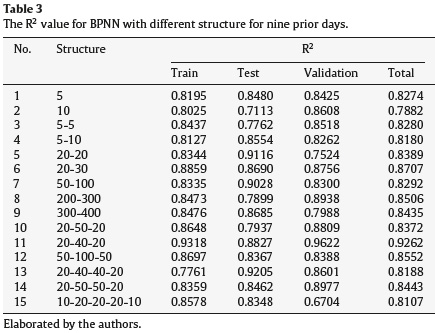
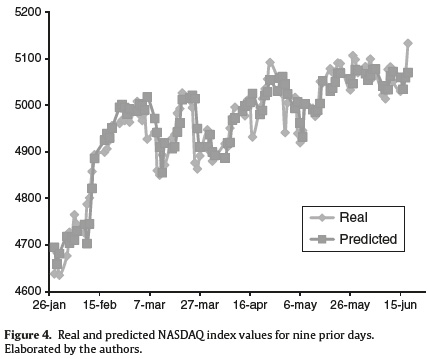
In Table 3 several configurations of MLP are presented. The training method and transfer function were OSS and LOGSIG, respectively. It is found that a network with three hidden layers and 20-40-20 neurons in hidden layers was the optimized network. Figure 4 shows the real and predictedNASDAQindex values for nine prior days in 99 days from 28 January to 18 June 2015. Accordingly, there is no distinct difference between the prediction ability of the four and nine prior working days as input parameters.
6. Conclusion
The model uses the values of NASDAQ exchange rate of last four and nine working days as well as the day of week as the input parameters. For four prior working days, applying OSS training method and TANGSIG transfer function in a network with 20-40-20 neurons in hidden layers resulted in an optimized trained network with R2 values of 0.9408 for validation dataset. For this dataset, the maximum R2 values for the networks with OSS training method and TANGSIG transfer function would be obtained when the number of hidden layers was 2 and the number of neurons was 40-40. For nine prior working days a network with 20-40- 20 neurons in hidden layers OSS training method and LOGSIG transfer function are the optimized network with validation R2 of 0.9622. The model outputs show that there is no distinct difference between the prediction ability of the four and nine prior working days as input parameters.
References
Alfaro, E., García, N., Gámez, M., & Elizondo, D. (2008). Bankruptcy forecasting: An empirical comparison of AdaBoost and neural networks. Decision Support Systems, 45, 110–122. [ Links ]
Angelini, E., Di Tollo, G., & Roli, A. (2008). A neural network approach for credit risk evaluation. The Quarterly Review of Economics and Finance, 48, 733–755. [ Links ]
Atsalakis, G. S., & Valavanis, K. P. (2009). Forecasting stock market short-term trends using a neuro-fuzzy based methodology. Expert Systems with Applications, 36, 10696–10707. [ Links ]
Baek, J., & Cho, S. (2003). Bankruptcy prediction for credit risk using an autoassociative neural network in Korean firms. In Computational Intelligence for Financial Engineering, 2003. Proceedings. 2003 IEEE International Conference, 25- 29. IEEE. [ Links ]
Chen, A. S., Leung, M. T., & Daouk, H. (2003). Application of neural networks to an emerging financial market: Forecasting and trading the Taiwan Stock Index. Computers & Operations Research, 30, 901–923. [ Links ]
Guresen, E., Kayakutlu, G., & Daim, T. U. (2011). Using artificial neural network models in stock market index prediction. Expert Systems with Applications, 38, 10389–10397. [ Links ]
Hájek, P. (2011). Municipal credit rating modelling by neural networks. Decision Support Systems, 51, 108–118. [ Links ]
Kuo, R. J., Chen, C., & Hwang, Y. (2001). An intelligent stock trading decision support system through integration of genetic algorithm based fuzzy neural network and artificial neural network. Fuzzy Sets and Systems, 118, 21–45. [ Links ]
Lee, K., Booth, D., & Alam, P. (2005). A comparison of supervised and unsupervised neural networks in predicting bankruptcy of Korean firms. Expert Systems with Applications, 29, 1–16. [ Links ]
Qiu, W., Liu, X., & Wang, L. (2012). Forecasting shanghai composite index based on fuzzy time series and improved C-fuzzy decision trees. Expert Systems with Applications, 39, 7680–7689. [ Links ]
Quah, T. S., & Srinivasan, B. (1999). Improving returns on stock investment through neural network selection. Expert Systems with Applications, 17, 295–301. [ Links ]
Yu, L., Wang, S., & Lai, K. K. (2008). Credit risk assessment with a multistage neural network ensemble learning approach. Expert Systems with Applications, 34, 1434–1444. [ Links ]
E-mail address: moein hedayati67@yahoo.com
Received 27 October 2015
Accepted 1 July 2016
