


Servicios Personalizados
Revista

Articulo
 Inglés (pdf)
 Articulo en XML
 Referencias del artículo
 Enviar articulo por email
Indicadores
-
 Citado por SciELO
Links relacionados
-
 Similares en
SciELO
Similares en
SciELO
Compartir

 Permalink
Journal of Economics, Finance and Administrative Science
versión impresa ISSN 2077-1886
Journal of Economics, Finance and Administrative Science vol.22 no.43 Lima jul./dic. 2017
ARTICLE
The role of liquidity in asset pricing: the special case of the Portuguese Stock Market
María del Mar Miralles-Quirós1; José Luis Miralles-Quirós1; Celia Oliveira2
1Faculty of Economics and Business Sciences, Universidad de Extremadura, Badajoz, Spain
2School of Technology and Management, Polytechnic Institute of Leiria, Leiria, Portugal
Abstract
Purpose – The aim of this paper is to examine the role of liquidity in asset pricing in a tiny market, such as the Portuguese. The unique setting of the Lisbon Stock Exchange with regards to changes in classification from an emerging to a developed stock market, allows an original answer to whether changes in the development of the market affect the role of liquidity in asset pricing.
Design/methodology/approach – The authors propose and compare two alternative implications of liquidity in asset pricing: as a desirable characteristic of stocks and as a source of systematic risk. In contrast to prior research for major stock markets, they use the proportion of zero returns which is an appropriated measure of liquidity in tiny markets and propose the separated effects of illiquidity in a capital asset pricing model framework over the whole sample period as well as in two sub-samples, depending on the change in classification of the Portuguese market, from an emerging to a developed one.
Findings – The overall results of the study show that individual illiquidity affects Portuguese stock returns. However, in contrast to previous evidence from other markets, they show that the most traded stocks (hence the most liquid stocks) exhibit larger returns. In addition, they show that the illiquidity effects on stock returns were higher and more significant in the period from January 1988 to November 1997, during which the Portuguese stock market was still an emerging market.
Research limitations/implications – These findings are relevant for investors when they make their investment decisions and for market regulators because they reflect the need of improving the competitiveness of the Portuguese stock market. Additionally, these findings are a challenge for academics because they exhibit the need for providing alternative theories for tiny markets such as the Portuguese one.
Practical implications – The results have important implications for individual and institutional investors who can take into account the peculiar effect of liquidity in stock returns to make proper investment decision.
Originality/value – The Portuguese market provides a natural experimental area to analyse the role of liquidity in asset pricing, because it is a tiny market and during the period studied it changed from an emerging to a developed stock market. Moreover, the authors have to highlight that previous evidence almost exclusively focuses on the US and major European stock markets, whereas studies for the Portuguese one are scarce. In this context, the study provides an alternative methodological approach with results that differ from those theoretically expected. Thus, these findings are a challenge for academics and open a theoretical and a practical debate.
Keywords Portugal, Stock liquidity, Asset pricing, Commonality
1. Introduction
In recent years, a large part of financial research has been devoted to the study of equity market liquidity. Initial studies focused on the liquidity of individual assets and its impact on returns (Amihud and Mendelson, 1986; Brennan and Subrahmanyam, 1996; Datar et al., 1998; Eleswarapu and Reinganum, 1993). However, recent studies have been based on the analysis of commonality in liquidity (Chordia et al., 2000; Hasbrouck and Seppi, 2001; Huberman and Halka, 2001) and demonstrate that individual liquidity co-moves with aggregate or systematic liquidity. Consequently, another strand of liquidity-related studies has emerged, which focuses on the link between asset returns and liquidity risk (Amihud, 2002; Pástor and Stambaugh, 2003) Acharya and Pedersen (2005). However, these previous studies have focused on the analysis of the US stock market and the evidence for tiny markets as the Portuguese one is limited.
The aim of our study is to analyse the role of liquidity in asset pricing in a tiny market as the Portuguese one. The contribution of our study is two-fold. First, we improve international empirical evidence with an in-depth analysis of the Portuguese stock market over the period 1988-2013. The unique setting of the Lisbon Stock Exchange with regards to changes in classification from an emerging to a developed stock market over the sample period, allows for an original answer to whether changes in the development of the market affect the role of liquidity in asset pricing. Moreover, gathering evidence from other data sets is important to check the robustness of the available results and to avoid the problem of data snooping (Lo and MacKinlay, 1990), as the majority of the empirical results previously reported use of US data. In addition, it is acknowledged that liquidity effects are more pronounced for illiquid assets and markets. So, studying markets that are sufficiently illiquid may allow for a better understanding of the pervasiveness of these effects. In the current study, such a goal is best achieved by selecting the Portuguese stock market in which illiquidity is likely to be an important factor for many of its listed stocks.
Second, we propose and compare two alternative implications of liquidity in asset pricing. More precisely, we adapt the liquidity-adjusted capital asset pricing model (CAPM) proposed by Acharya and Pedersen (2005) for the Portuguese case and suggest two alternative specifications of a liquidity-adjusted CAPM, to separate and compare the effects of liquidity and liquidity risk in asset pricing. Moreover, we use the proportion of zero returns proposed by Lesmond et al. (1999), which is an appropriated measure of liquidity in tiny markets such. However, before drawing some overall conclusions, we also evaluate the money-augmented CAPM proposed by Balvers and Huang (2009), which is characterised by adding a risk premium for money growth which can be interpreted as an economy’s liquidity premium. To our knowledge, this is the first study that provides evidence of the MCAPM for a small and tiny market as the Portuguese one.
Our initial results show that individual illiquidity affects Portuguese stock returns. However, in contrast to previous evidence from other markets, they show that the most traded stocks (hence the most liquid stocks) exhibit larger returns. In addition, we show that the illiquidity effects on stock returns were higher and more significant in the period from January 1988 to November 1997, during which the Portuguese stock market was still an emerging market. Similar results are provided when the M-CAPM is tested. These findings are relevant for investors when they make their investment decisions and for market regulators because they reflect the need for improving the competitiveness of the Portuguese stock market. Additionally, these findings are a challenge for academics because they exhibit the need for providing alternative theories for tiny markets such as the Portuguese one.
The remainder of the paper is organised as follows: Section 2 presents the literature review. Section 3 describes the data, the liquidity measure and the portfolio formation procedure. The methodology and results of the asset pricing tests are presented and discussed in Section 4. Finally, Section 5 concludes the paper.
2. Previous empirical evidence
Studies about liquidity primarily concentrated on analysing the impact of individual assets liquidity on returns (Amihud and Mendelson, 1986; Brennan and Subrahmanyam, 1996; Datar et al., 1998; Eleswarapu and Reinganum, 1993). However, the evidence reported is ambiguous: some authors find a positive relation between asset returns and illiquidity, but others only find such a positive relation in January. The work of Amihud and Mendelson (1986) was one of the first to examine the role of liquidity in asset pricing using the bid – ask spread as a proxy for illiquidity. They document a positive relation between expected return and illiquidity. However, Eleswarapu and Reinganum (1993), who extended the sample period by 10 years, find that the existence of a positive liquidity premium is only limited to January. Brennan and Subrahmanyam (1996) examine the liquidity premium and find a positive return-illiquidity relation even after taking price, size and book to market factors into account in the Fama–French framework. Nevertheless, it is important to note that these authors consider liquidity as a stock characteristic rather than an aggregate risk factor of concern to investors.
The recent relative consensus about the existence of commonality in liquidity raises a new question about the role of liquidity in asset pricing. Therefore, commonality in liquidity could represent a source of non-diversifiable risk, and, in that case, the sensitivity of an individual stock to liquidity shocks could induce the market to require a higher average return. Consistent with this proposition, several authors provide evidence that expected returns are positively related to market-wide liquidity or liquidity risk, such as Pástor and Stambaugh (2003), Amihud (2002), Acharya and Pedersen (2005), Miralles-Marcelo and Miralles-Quirós (2006), among others.
In their seminal paper, Acharya and Pedersen (2005) propose a liquidity-adjusted CAPM (LCAPM), in which a security required return depends on its expected liquidity, as well as on the co-variances of its own return and liquidity with the market return and liquidity. Using the Amihud (2002) illiquidity ratio and stock returns, these authors find some evidence that illiquidity betas are priced in the USA, and that their model is better than the standard CAPMin terms of goodness of fit. Other authors, such as Lee (2011), Papavassiliou (2013), Li et al. (2014) and Butt and Virk (2015) also use the Acharya and Pedersen (2005) model to study the relationship between stock returns and liquidity, respectively.
The work of Lee (2011) is different, as he empirically tests the LCAPM of Acharya and Pedersen (2005) on a global level. The empirical evidence presented is supportive of the LCAPM, in which liquidity risks are priced independently of market risk in international financial markets.
Li et al. (2014) use data from the second largest equity market, Japan, to test whether liquidity and liquidity risk are priced. In consistent with the findings of Acharya and Pedersen (2005) in the USA, these authors also report evidence that the liquidity-adjusted CAPM is superior to standard CAPM but they only obtain weak evidence for the argument that liquidity risk is priced in addition to the liquidity level and the market risk.
The Acharya and Pedersen (2005) model was also tested in other developed yet small stock markets, such as Greece and Finland. For the Greek stock market, Papavassiliou (2013) provides evidence that liquidity risk is a priced factor, mainly arising from the covariation of individual liquidity with local market liquidity, and that the level of liquidity seems to be an irrelevant variable in asset pricing. Butt and Virk (2015) use the proportion of the zero-returns illiquidity measure, in addition to the Amihud (2002) illiquidity ratio, to report evidence that a substantial risk premium related to illiquidity risk exists in the Finnish market, and that a liquidity-adjusted CAPM performs better than simple CAPM specifications.
Although this strand of the financial literature is boundless, prior evidence for the Portuguese stock market is scarce. The initial works of Escalda (1993) and Mello and Escalda (1994) were focused on analysing the role of individual liquidity in asset pricing for a sample period in which the Portuguese market was an emerging market. However, subsequent studies, such as those of Pereira and Cutelo (2013) and Miralles-Marcelo et al. (2015), have focused on other aspects of liquidity. More precisely, Pereira and Cutelo (2013) observe that low-price stocks are less liquid than high-price stocks and trade at lower valuation ratios. Finally, they argue that their results do not support any of the existing theories on optimal price per share. On the other hand, Miralles-Marcelo et al. (2015) analyse whether there exists commonality in liquidity in the Portuguese market over the 1988-2011 period. Following the Chordia et al. (2000) methodology, some evidence of commonality in liquidity is found in the Portuguese market when the proportion of zero returns is used as a measure of liquidity. However, they do not take into account the change froman emerging to a developed market.
In this context, in the present study for the Portuguese stock market, we analyse the effects of liquidity in asset pricing, both as an individual characteristic of financial assets, like the initial studies, and as a source of systematic risk, like more recent studies. Moreover, we analyse possible changes affected by the evolution of this market into a developed one.
3. Data
In this study, we use monthly and daily data for the period from 2 January 1988 to 31 December 2013, retrieved from Thomson Datastream. The data obtained include the following variables: price, trading volume, market capitalisation and book-to-market ratio.
We select all stocks traded in the Euronext Lisbon Stock Exchange with available data for at least 24 months. The final sample is composed of 233 different stocks, which were traded during some period of time between 1988 and 2013.
The return of the market portfolio is proxied by the equally-weighted return of all stocks available in each month of the sample. And, as Portugal did not have short-term government securities during most of the period covered by this study, we proxy the risk-free rate of return by the equivalent monthly Interbank Money Market Overnight interest rate. Data on this interest rate are taken from BPstat Estatísticas online from Banco de Portugal, which is an internet online access to the Banco de Portugal Statistical Interactive Database[1].
Finally, we have to highlight that, over the sample period studied in this paper, some important events affected the Portuguese stock market’s evolution, namely, its classification as a developed stock market by Standard & Poor’s and Morgan Stanley Capital International in 1997; its merger with Euronext N.V. in 2002 and its consequent integration in the Euronext platform; and later, in 2007, owing to the acquisition of Euronext by NYSE, its integration in the world’s biggest stock market platform, which consolidated its internationalisation. The merger of the Portuguese stock market with Euronext in 2002 did not bring about many fundamental changes. The consolidated Euronext exchange maintained the market structure of the participating exchanges, and the main implication of the unification was to make cross-border trading easier (Nielsson, 2009). Therefore, it seems important to study the effects of the 1997 classification event[2].
3.1. The illiquidity measure
Following recent evidence for the Portuguese stock market (Miralles-Marcelo et al., 2015), we construct for each asset a monthly time series for the monthly proportion of zero returns, ZR, computed as the number of daily zero returns, #ZR divided by the total number of transactions days in each month, D:
As argued by Lesmond et al. (1999), securities with high transaction costs will have less frequent price movements and more zero returns than securities with low transaction costs. So, the occurrence of zero returns can be considered a measure of illiquidity. The biggest advantage of this measure is that it only requires a time series of daily equity returns. Moreover, Bekaert et al. (2007) and Goyenko et al. (2009) demonstrated that this measure is correlated with finer spread and price impact proxies estimated from low frequency data.
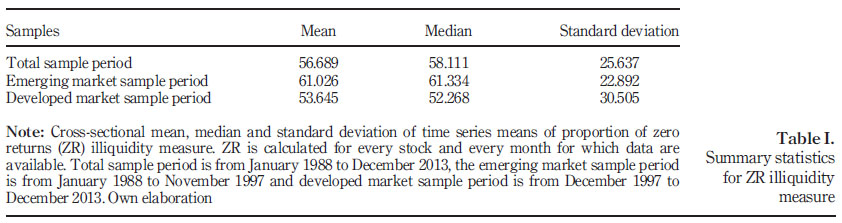
Table I presents summary statistics for this illiquidity measure for the entire sample period and for two subsample periods: the period from January 1988 to November 1997, during which the Portuguese stock market was still an emerging market, and the period from December 1997 to December 2013 when it became a developed stock market[3]. During the entire sample period, the average ZR is 56.689 per cent, which means that on average there are 56.689 per cent of days during which there were no price movements. As expected, in the emerging market sample period the average illiquidity is higher than in the period after the classification as a developed stock market. Actually, ZR average is 61.026 per cent in the first sub-period which contrasts to an average of 53.645 per cent in the later period.
Monthly aggregated illiquidity or market illiquidity is computed for each month as the average of the illiquidity measure across all sample stocks. Figure 1 plots market illiquidity during 1988-2013. As can be seen, it is at the beginning of 1993 that illiquidity reaches its highest levels and starts to decline from that year onwards. This improvement in liquidity is because of the reorganisation and regulation of the Portuguese stock market, which led to its international recognition as a developed market in 1997. In 1998/1999 illiquidity rises were
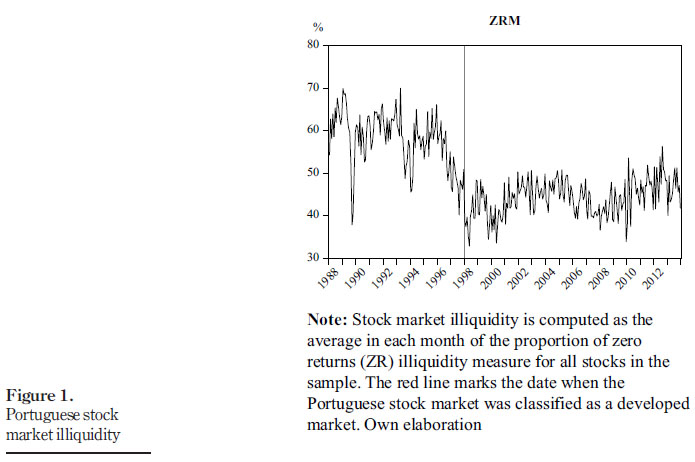
caused by the instability related to the Asian and Russian crisis. The end of the speculative bubble in the year 2000 also contributed to the deterioration of the liquidity levels. Afterwards, stock market liquidity was negatively affected by the worldwide financial crisis of 2007/2008, which was followed by the strong economic recession and sovereign debt crisis in the Eurozone, and the international financial assistance programme to the Portuguese economy. These more recent financial crises are well reflected in increasing ZR.
3.2. Portfolios formation procedure
The limited number of listed stocks in Euronext Lisbon constrains the use of a large crosssection of portfolios with respect to a particular stock characteristic. Moreover, we take into account the suggestion of Lewellen et al. (2010) who show that for returns with a covariance structure similar to the risks factors, loading on any proposed factor will line up with the true expected returns as long as the factor weakly correlates with the common source of variation in returns. Thus, using portfolios constructed on the same basis as the risk factor may generate high cross-sectional R-squared values even though this factor is not able to explain the cross-section of true expected returns.
For those reasons, we include portfolios based on four different stock characteristics[4]: liquidity, size, B/M and systematic market risk[5]. The availability of 20 characteristic portfolios provides an adequate number of test portfolios for the statistical power of crosssectional tests.
The portfolio formation methodology consists of three steps. First, all sample stocks are ranked in ascending order of the stock characteristic. Second, based on the previous year’s stock characteristic, stocks are divided into five groups with approximately the same number of stocks. Third, the portfolio composition is revised every December and maintained throughout the following year. To be included in a portfolio, stocks must have been traded fromJanuary to December of year t.
The size, B/M and beta risk portfolios are ranked on the year-end information, considering the values of December of each year. The quintile portfolios increase in size, B/M and beta risk. This means that for size portfolios, S1 represents the smallest year-end market capitalised firms and S5 represents the largest year-end market capitalised firms. Regarding B/M, the BM1 portfolio contains the 20 per cent of stocks with the lowest B/M in December of each year, and BM5 contains the 20 per cent of stocks with the highest B/M. With respect to beta risk, B1 is the portfolio that contains the 20 per cent of stocks with the lowest beta risk in December of each year and B5 is the portfolio containing the 20 per cent of stocks with the highest beta. The liquidity portfolios are ranked on annual information, based on the values of ZR computed with annual frequency. The liquidity quintile portfolios increase in liquidity, so the stocks are sorted in descending order ZR. Therefore, L1 represents the most illiquid stocks and L5 contains the most liquid stocks in our sample.
For each month and portfolio, we calculate the equally-weighted returns and illiquidity. We use the equal weighting scheme for the test portfolios, as this seems to be the usual methodology followed by liquidity-related studies.
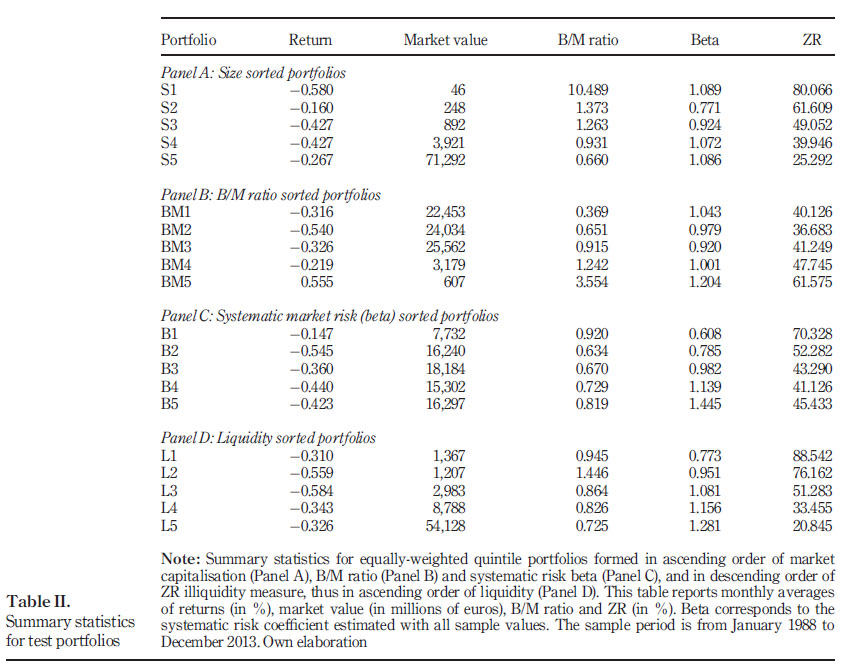
Summary statistics for test portfolios are presented in Table II. This table shows that sorting based on previous year illiquidity allows for computing portfolios whose average liquidity ascends from L1 to L5. This means that illiquidity is persistent and less liquid assets in the previous year tend to be less liquid for a long time. This result justifies the estimation of liquidity innovations using autoregressive models, as explained in Section 5. Moreover, there is no evidence of a relation between average portfolio returns and liquidity, which could suggest that it is not liquidity level but rather liquidity shocks that affect stock returns. Almost all portfolios exhibit average negative returns in the period 1988-2013. The only exception is the BM5 portfolio that has an average return of 0.555 per cent. This negative return can be explained by the high losses experienced in the stock market during the post-dot-com bubble and the financial crisis periods.
As expected, market value increases with liquidity because the most liquid stocks are also the stocks of firms with the largest capitalisation. Also, B/M ratio decreases with liquidity, suggesting that the least liquid stocks are also the ones less profitable or relatively distressed.
4. Asset pricing with liquidity
Previous empirical evidence suggests that there is commonality in illiquidity in Portugal (Miralles-Marcelo et al., 2015). In this sense, as Chordia et al. (2000) argue, commonality in liquidity could represent a source of systematic risk, and in that case the sensitivity of an individual stock to liquidity shocks could induce the market to require a higher average return. Hence, in this section, we analyse the role of liquidity in asset pricing, within the context of CAPM and Acharya and Pedersen (2005) models. Our main goal is to ascertain whether liquidity level and/or liquidity risk is priced in the Portuguese stock market.
4.1 Liquidity-adjusted pricing model
The CAPM of Sharpe (1964), Lintner (1965) and Mossin (1966) is, for its simplicity, a very attractive model for investigation. This model states that the expected excess return of an asset is proportional to its covariance with market returns; thus, the only risk factor that matters is the market beta. Nevertheless, it seems to have had limited empirical ability to explain asset returns in recent times, and some studies reveal that the CAPM model cannot explain the expected returns from some investment strategies based on firm characteristics such as liquidity.
In this context, Acharya and Pedersen (2005) developed LCAPM. This model provides a unified framework for understanding the various channels through which liquidity risk may affect asset prices. As in the standard CAPM, in the LCAPM model, the required return on an asset increases linearly with the market beta, that is covariance between the asset return and the market return. However, this model also yields three additional effects which could be regarded as three forms of liquidity risks. The first effect is that the return increases with the covariance between the asset illiquidity and the market illiquidity. The second effect on expected returns is because of co-variation between a security return and the market illiquidity. And, finally, the third effect on required returns is because of covariation between security illiquidity and the market return.
We consider that the LCAPM model combines the two main arguments related to the consideration of illiquidity in asset pricing. The first argument is that illiquidity is a stock characteristic that acts as a market friction because individual illiquidity reduces stock returns. The second argument is that illiquidity is a source of systematic risk and that it is important to measure the co-movements between asset returns and market illiquidity. However, because of the inter-relation of these two arguments, it is not possible to know for sure which effect dominates.
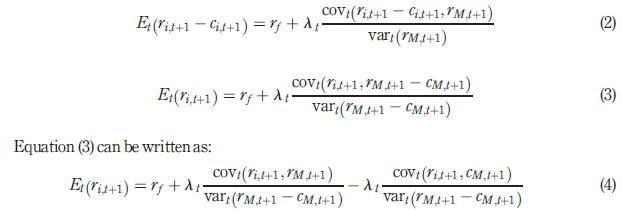
Therefore, to ascertain whether liquidity level and/or liquidity risk is priced in the Portuguese stock market, we consider the separated effects of illiquidity in the CAPM framework. The equation (2) model incorporates illiquidity as a market friction, whereas the equation (3) model considers illiquidity as a source of systematic risk:
4.2. Innovation in return and illiquidity
Empirical literature shows that liquidity is time-varying and persistent. The persistence of liquidity implies that liquidity predicts future returns and co-moves with contemporaneous returns. So, as reported by Acharya and Pedersen (2005) and Butt and Virk (2015), we use innovations instead of original series in our empirical analysis. Moreover, using innovations also circumvents the stationarity issues, given the high persistence in the levels of illiquidity series. The innovations in portfolio and market illiquidity are gathered by imposing ARMA (p, q) structures, where p is the lag length for the autoregressive term and q is the lag length of the moving average term:
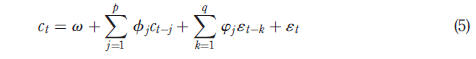
In equation (5), an algorithm that selects the best adjustment according to Akaike’s information criteria chooses the lag order. We also collect innovations in the aggregate market return series using the same methodology.
Illiquidity innovations are computed as the difference between total and expected illiquidity, that is:

4.3. Model testing
The models of equations (2) and (4) translate into the following unconditional testable model equations:

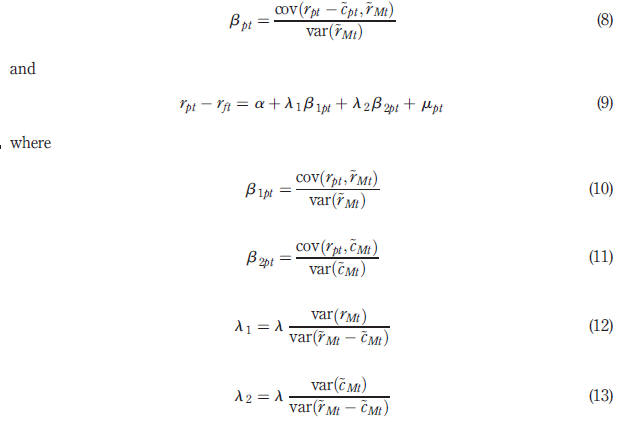
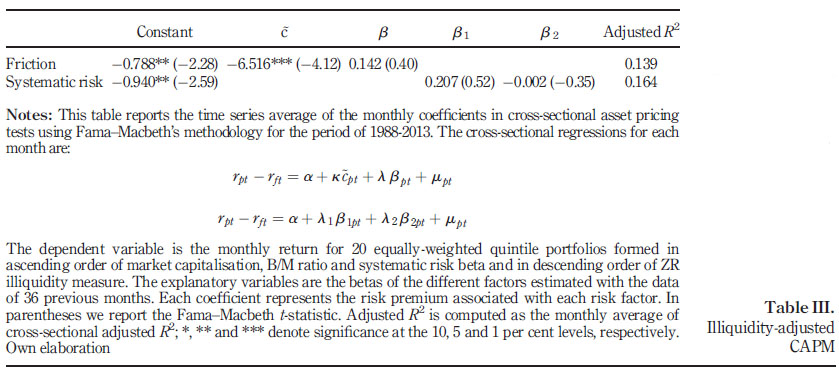
These cross-sectional specifications are tested using the Fama and Macbeth (1973) threestep procedure. In the first step, for each of the 20 test portfolios, we compute the time series for each beta coefficient with 36 previous monthly observations. In the second step, we estimate in cross-section equations (7) and (9) models, where the betas are the ones estimated in the first step. Finally, in the third step, based on the sampling distribution mean and standard error of the risk factors’ premiums (l), we compute the t-statistics.
The results are presented in Table III. When illiquidity is incorporated as a friction, the results show that the relation between returns and systematic risk is insignificant[6]. The level of illiquidity is negatively priced, which suggests that most liquid portfolios earn a higher return or a less negative return, as the average portfolio’s returns are negative in the period studied. On the other hand, for the model of equation (9), the results show that the estimated risk premiums are insignificant and only the constant is negative and significant at the 5 per cent level.
These results confirm the idea that in the Portuguese stock market individual illiquidity acts as a market friction that is priced. Additionally, in contrast to empirical evidence reported from other countries, there is no illiquidity premium as most liquid portfolios are the ones that exhibit higher risk-adjusted returns. However, the evidence of an illiquidity discount is consistent with Nguyen and Lo (2013) for New Zealand, which is also a developed but small stock market like the Portuguese one[7].
4.4. Model testing for subsample periods
To ascertain whether the efforts made to reorganise and regulate the Portuguese stock market that result in its classification as developed alter the role of liquidity in asset pricing, we tested the asset pricing models presented before with two subsamples. The first subsample corresponds to the emerging market period and comprises the period from
January 1988 to November 1997. The other subsample corresponds to the developed period and consists of the period fromDecember 1997 to December 2013.
The results of the estimation of equations (6) and (8) models using Fama and Macbeth (1973) methodology for each subsample period are presented in Table IV. Again, the results confirm that, in the Portuguese stock market systematic illiquidity risk is not priced but the level of illiquidity is. In fact, the estimates of the illiquidity level obtained are negative and significant at the 5 per cent level: 6.636 in the emerging market period and 5.237 in the developed market period.
As before, these results support that individual illiquidity is negatively priced for the ZR illiquidity measure, suggesting that most liquid portfolios earn a less negative return. Nevertheless, this illiquidity discount is stronger in the first part of our sample period. This is consistent with previous evidence reported for the Portuguese stock market[8].
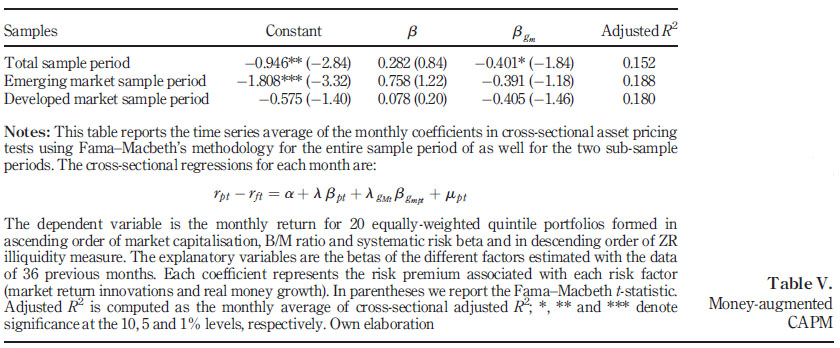
4.5. The money-augmented CAPM
Before drawing some overall conclusions, it is instructive to conduct additional tests. In this sense, we evaluate an alternative implication of liquidity in asset pricing. In particular, we consider the aggregate level of liquidity in the Portuguese economy instead of individual liquidity or the aggregate level of liquidity in the stock market. To that end, we use the money-augmented CAPM proposed by Balvers and Huang (2009).
Under the rationale that the availability of money is a source of liquidity that facilitates transactions, affects the marginal value of wealth and contributes to the economy via several mechanisms, Balvers and Huang (2009) introduced money to the CAPM as we can see in equation (14):

where the additional risk factor is the real money growth computed as the growth rate of the monetary aggregate M2 deflated by the consumer price index. For the Portuguese case, these series are available fromthe Banco de Portugal.
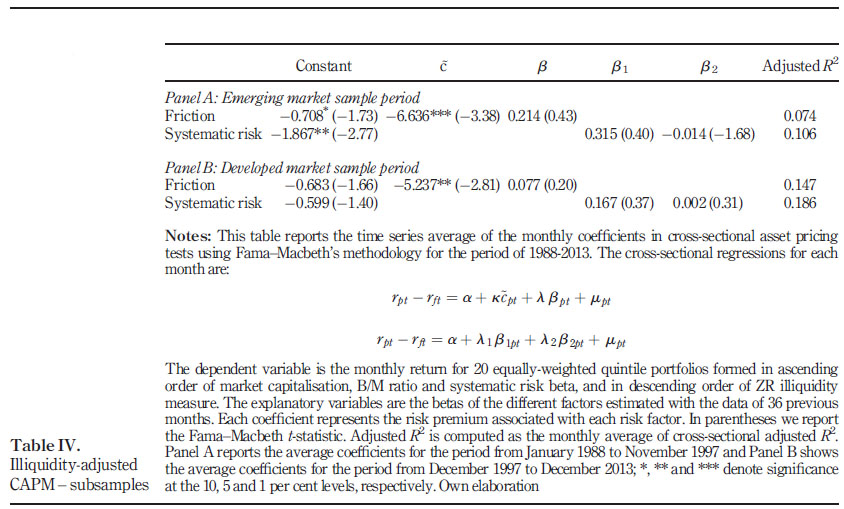
Table V provides the Fama and Macbeth (1973) estimates of this alternative model for the entire sample period, as well as for each subsample period (the January 1988-November 1997 emerging market period and the December 1997-December 2013 developed market period).
The goodness of fit of this alternative asset pricing model is in line with the one obtained for the Acharya and Pedersen (2005) LCAPM, with adjusted R2 between 15 and 19 per cent. The coefficients are also in line with previous results. The intercepts imply a risk-adjusted return that is negative and significant for the period studied and, especially, for the first part of our sample period. The systematic risk premium is positive but insignificant, and the risk premium for monetary growth is negative and significant for the entire sample but insignificant for both sub-samples. These results confirm the results obtained for the Acharya and Pedersen (2005) LCAPM and, as before, suggest that in Portugal there exists a negative premium for liquidity.
5. Conclusions
In this paper, we examine whether liquidity levels and liquidity risk are priced in the Portuguese stock market. The motivation for our study is provided by the growing interest in stock liquidity that has emerged in literature over recent years and the multiple roles that liquidity could play in asset pricing, as liquidity could represent a desirable stock characteristic and/or a source of systematic risk which is priced with a higher return.
In contrast to the extant literature, this study examines the role of liquidity in the Euronext Lisbon Stock Exchange over a 26-year period. Regarding the role of illiquidity in asset pricing, the evidence found weakly supports liquidity-adjusted or moneyadjusted models. Nevertheless, the results show that individual illiquidity is priced, as the estimates of individual illiquidity coefficients are significant although negative for the proportion of zero returns measure, within a CAPM augmented by the illiquidity level framework.
These findings suggest it is individual illiquidity, not systematic illiquidity, which matters most to Portuguese investors and that there is an inverse relation between returns and the proportion of zero returns illiquidity measure. This is consistent with previous evidence reported for the Portuguese stock market. Similar results were also reported by Nguyen and Lo (2013) for New Zealand, a developed but small stock market such as the Portuguese one. Moreover, we show that there exists a negative risk premium for money growth in the Portuguese market over the entire sample period, which can be interpreted as a negative economy’s liquidity premium.
These particular findings are not only relevant for academics but also for practitioners. In spite of the effort made to increase the international visibility of the Portuguese stock market, there are no substantial improvements in terms of its liquidity and alternative theories about the role of liquidity in asset pricing should be provided for tiny markets as the Portuguese one. Moreover, we have to highlight that future research should focus on analysing alternative extensions of the CAPM, such as those provided by Balvers and Huang (2007), Balvers et al. (2012) and Balvers et al. (2017) among others, to find which kind of risk is nowadays priced in the Portuguese stock market.
References
Acharya, V.V. and Pedersen, L.H. (2005), "Asset pricing with liquidity risk", Journal of Financial Economics, Vol. 77 No. 2, pp. 375-410. [ Links ]
Amihud, Y. (2002), "Illiquidity and stock returns: cross-section and time-series effects", Journal of Financial Markets, Vol. 5 No. 1, pp. 31-56. [ Links ]
Amihud, Y. and Mendelson, H. (1986), "Asset pricing and the bid-ask spread", Journal of Financial Economics, Vol. 17 No. 2, pp. 223-249. [ Links ]
Baillie, R.T. and DeGennaro, R.P. (1990), "Stock returns and volatility", Journal of Financial and Quantitative Analysis, Vol. 25 No. 2, pp. 203-214. [ Links ]
Balvers, R.J. and Huang, D. (2007), "Productivity-based asset pricing: theory and evidence", Journal of Financial Economics, Vol. 86 No. 2, pp. 405-445. [ Links ]
Balvers, R.J. and Huang, D. (2009), "Money and the C-CAPM", Journal of Financial and Quantitative Analysis, Vol. 44 No. 2, pp. 337-368. [ Links ]
Balvers, R.J., Gu, L. and Huang, D. (2017), "Profitability, value and stock returns in productionbased asset pricing without frictions", Journal of Money, Credit and Banking, Vol. 49 No. 7, pp. 1621-1651. [ Links ]
Balvers, R.J., Hu, O. and Huang, D. (2012), "Transitory market states and the joint occurrence of momentum and mean reversion", Journal of Financial Research, Vol. 35 No. 4, pp. 471-495. [ Links ]
Bekaert, G., Harvey, C.R. and Lundblad, C. (2007), "Liquidity and expected returns: lessons from emerging markets", Review of Financial Studies, Vol. 20 No. 6, pp. 1783-1831. [ Links ]
Bollerslev, T. and Zhou, H. (2006), "Volatility puzzles: a simple framework for gauging return-volatility regressions", Journal of Econometrics, Vol. 131 Nos 1/2, pp. 123-150. [ Links ]
Brennan, M.J. and Subrahmanyam, A. (1996), "Market microstructure and asset pricing: on the compensation for illiquidity in stock returns", Journal of Financial Economics, Vol. 41 No. 3, pp. 441-464. [ Links ]
Butt, H.A. (2015), "A comparison among various dimensions of illiquidity effect: a case study of Finland", Research in International Business and Finance, Vol. 33 (January), pp. 204-220. [ Links ]
Butt, H.A. and Virk, N.S. (2015), "Liquidity and asset prices: an empirical investigation of the Nordic stock markets", European Financial Management, Vol. 21 No. 4, pp. 672-705. [ Links ]
Campbell, J.Y. and Hentschel, L. (1992), "No news is good news: an asymmetric model of changing volatility in stock returns", Journal of Financial Economics, Vol. 31 No. 3, pp. 281-318. [ Links ]
Chordia, T., Roll, R. and Subrahmanyam, A. (2000), "Commonality in liquidity", Journal of Financial Economics, Vol. 56 No. 1, pp. 3-28. [ Links ]
Datar, V.T., Naik, N.Y. and Radcliffe, R. (1998), "Liquidity and stock returns: an alternative test", Journal of Financial Markets, Vol. 1 No. 2, pp. 203-219. [ Links ]
Eleswarapu, V.R. and Reinganum, M.R. (1993), "The seasonal behavior of the liquidity premium in asset pricing", Journal of Financial Economics, Vol. 34 No. 3, pp. 373-386. [ Links ]
Escalda, A. (1993), Risco e liquidez - Uma análise do mercado accionista Português, Master Thesis, Universidade Técnica de Lisboa, Instituto Superior de Economia e Gestão, Lisboa. [ Links ]
Fama, E.F. and French, K.R. (1993), "Common risk factors in the returns on stocks and bonds", Journal of Financial Economics, Vol. 33 No. 1, pp. 3-56. [ Links ]
Fama, E.F. and Macbeth, J.D. (1973), "Risk, return, and equilibrium - empirical tests", The Journal of Political Economy, Vol. 81 No. 3, pp. 607-636. [ Links ]
French, K.R., Schwert, G.W. and Stambaugh, R.F. (1987), "Expected stock returns and volatility", Journal of Financial Economics, Vol. 19 No. 1, pp. 3-29. [ Links ]
Glosten, L.R., Jagannathan, R. and Runkle, D.E. (1993), "On the relation between the expected value and the volatility of the nominal excess return on stocks", The Journal of Finance, Vol. 48 No. 5, pp. 1779-1801. [ Links ]
Goyenko, R.Y., Holden, C.W. and Trzcinka, C.A. (2009), "Do liquidity measures measure liquidity?", Journal of Financial Economics, Vol. 92 No. 2, pp. 153-181. [ Links ]
Harrison, P. and Zhang, H.H. (1999), "An investigation of the risk and return relation at long horizons", The Review of Economics and Statistics, Vol. 81 No. 3, pp. 399-408. [ Links ]
Hasbrouck, J. and Seppi, D.J. (2001), "Common factors in prices, order flows, and liquidity", Journal of Financial Economics, Vol. 59 No. 3, pp. 383-411. [ Links ]
Huberman, G. and Halka, D. (2001), "Systematic liquidity", Journal of Financial Research, Vol. 24 No. 2, pp. 161-178. [ Links ]
Lee, K.H. (2011), "Theworld price of liquidity risk", Journal of Financial Economics, Vol. 99 No. 1, pp. 136-161. [ Links ]
Lesmond, D.A., Ogden, J.P. and Trzcinka, C.A. (1999), "A new estimate of transaction costs", Review of Financial Studies, Vol. 12 No. 5, pp. 1113-1141. [ Links ]
Lewellen, J., Nagel, S. and Shanken, J. (2010), "A skeptical appraisal of asset pricing tests", Journal of Financial Economics, Vol. 96 No. 2, pp. 175-194. [ Links ]
Li, B., Sun, Q. and Wang, C. (2014), "Liquidity, liquidity risk and stock returns: evidence from Japan", European Financial Management, Vol. 20 No. 1, pp. 126-151. [ Links ]
Lintner, J. (1965), "The valuation of risk assets and the selection of risky investments in stocks portfolios and capital budgets", The Review of Economics and Statistics, Vol. 47 No. 1, pp. 13-37. [ Links ]
Lo, A.W. and MacKinlay, A.C. (1990), "Data-snooping biases in tests of financial asset pricing models", Review of Financial Studies, Vol. 3 No. 3, pp. 431-467. [ Links ]
López, G., Marhuenda, J. and Nieto, B. (2009), "The relationship between risk and expected returns with incomplete information", Investigaciones Económicas, Vol. 33 No. 1, pp. 69-96. [ Links ]
Mello, A.S. and Escalda, A. (1994), "Is there a size effect or a liquidity premium in Portuguese stocks?", Quarterly Bulletin of the Central Bank of Portugal, Vol. 16 No. 1, pp. 55-64. [ Links ]
Miralles-Marcelo, J.L. and Miralles-Quirós, M.M. (2006), "The role of an illiquidity risk factor in asset pricing: empirical evidence from the Spanish stock market", The Quarterly Review of Economics and Finance, Vol. 46 No. 2, pp. 254-267. [ Links ]
Miralles-Marcelo, J.L., Miralles-Quirós, M.M. and Miralles-Quirós, J.L. (2013), "Estructura financiera de la empresa y valoración de activos en el mercado bursátil español", The Spanish Journal of Finance and Accounting, Vol. 42 No. 160, pp. 561-589. [ Links ]
Miralles-Marcelo, J.L., Miralles Quirós, M.M. and Oliveira, C. (2015), "Systematic liquidity: commonality and inter-temporal variation in the Portuguese stock market", Cuadernos De Gestión, Vol. 15 No. 2, pp. 39-64. [ Links ]
Mossin, J. (1966), "Equilibriumin a capital asset market", Econometrica, Vol. 34 No. 4, pp. 768-783. [ Links ]
Nguyen, N.H. and Lo, K.H. (2013), "Asset returns and liquidity effects: evidence from a developed but small market", Pacific-Basin Finance Journal, Vol. 21 No. 1, pp. 1175-1190. [ Links ]
Nielsson, U. (2009), "Stock exchange merger and liquidity: the case of Euronext", Journal of Financial Markets, Vol. 12 No. 2, pp. 229-267. [ Links ]
Pagano, M. and Padilla, A. (2005), "Gains from stock exchange integration: the Euronext evidence", in Research, C.F.E.P. (Ed.), Centre for Economic Policy Research Working Paper. [ Links ]
Papavassiliou, V.G. (2013), "A new method for estimating liquidity risk: insights from a liquidityadjusted CAPM framework", Journal of International Financial Markets, Institutions and Money, Vol. 24 (April), pp. 184-197. [ Links ]
Pástor, L. and Stambaugh, R.F. (2003), "Liquidity risk and expected stock retums", The Journal of Political Economy, Vol. 111 No. 3, pp. 642-685. [ Links ]
Pereira, J.P. and Cutelo, T. (2013), "Tiny prices in a tiny market: evidence from Portugal on optimal share prices", European Financial Management, Vol. 19 No. 3, pp. 579-598. [ Links ]
Sharpe, W.F. (1964), "Capital asset prices: a theory of market equilibrium under conditions of risk", The Journal of Finance, Vol. 19 No. 3, pp. 425-442. [ Links ]
About the authors
María del Mar Miralles-Quirós is an Associate Professor of Financial Economics at the Universidad de Extremadura in Spain and Director of the Research Group on Financial Assets and Markets (GIMAF). She is the author of numerous research articles, books and book chapters in the field of finance that deal with asset valuation and optimisation, liquidity and risk in stock markets and socially responsible investment strategies. She has directed various PhD theses. In the management area, she has been Deputy Dean of Institutional Relations of the Faculty of Economics and Business Sciences of the Universidad de Extremadura, where she is currently teaching the subject of Mathematics of Financial Operations. María del Mar Miralles-Quirós is the corresponding author and can be contacted at: marmiralles@unex.es
José Luis Miralles-Quirós is an Associate Professor of Financial Economics at the Universidad de Extremadura in Spain and member of the Research Group on Financial Assets and Markets (GIMAF). He is the author of numerous research articles, books and book chapters in the field of finance that deal with asset valuation and optimisation, liquidity and risk in stock markets and socially responsible investment strategies. He has directed until the moment a total of five doctoral thesis. In the teaching field, he is currently teaching Mathematics of Financial Operations the Faculty of Economics and Business Sciences of the Universidad de Extremadura.
Celia Oliveira is an Associate Professor at the Polytechnic Institute of Leiría in Portugal, where she teaches financial valuation in the School of Management. She holds her PhD in Economics and Business from the Universidad de Extremadura in Spain. Her doctoral thesis was entitled "The role of liquidity in asset pricing: the Portuguese case" and the present study is part of this research.
Received 22 December 2016
Revised 8 February 2017 4 May 2017
Accepted 4 May 2017
Notes
1. Available at www.bportugal.pt/EstatisticasWEB.
2. See Pagano and Padilla (2005) and Nielsson (2009) for a comprehensive analysis of the Euronext merger effects.
3. Outliers at the upper and lower 1 per cent tails of the illiquidity variable are discarded.
4. This procedure was also adopted by López et al. (2009), Miralles-Marcelo, Miralles-Quirós and Miralles-Quirós (2013), Butt (2015) and Butt and Virk (2015) among others.
5. Systematic market risk is estimated as the market beta of the traditional market model with 36 previous months’ observations of stock and market returns.
6. Many studies fail to identify a robust and significant relation between risk and return on the aggregate stock market portfolio (Baillie and DeGennaro, 1990; Bollerslev and Zhou, 2006; Campbell and Hentschel, 1992; French et al., 1987; Glosten et al.,1993; Harrison and Zhang, 1999).
7. We have also evaluated the traditional CAPM and the Fama and French (1993) three-factor model, as well as illiquidity augmented versions of these models with similar findings. These results are available upon request.
8. Mello and Escalda (1994) use monthly data from 1988 to -1993 to compute different proxies for liquidity, as the proportional quoted bid-ask spread, trading frequency and turnover rate. They only consider liquidity as a stock characteristic and their results reveal that liquidity affects Portuguese stock returns and that most traded stocks (hence most liquid stocks) exhibit larger returns.

