


Serviços Personalizados
Journal

Artigo
 Inglês (pdf)
 Artigo em XML
 Referências do artigo
 Enviar este artigo por email
Indicadores
-
 Citado por SciELO
Links relacionados
-
 Similares em
SciELO
Similares em
SciELO
Compartilhar

 Permalink
Journal of Economics, Finance and Administrative Science
versão impressa ISSN 2077-1886
Journal of Economics, Finance and Administrative Science vol.24 no.47 Lima jun. 2019
http://dx.doi.org/https://doi.org/10.1108/JEFAS-10-2018-0111
ARTICLE
The relationship between the income and behavioural biases
Renu Isidore R.1,*
Christie P.1
1 Loyola Institute of Business Administration, Chennai, Tamil Nadu, India
Corresponding author:*renuisidore@gmail.com
Abstract
Purpose: The purpose of this paper is to test the relationship between the annual income earned by the investors and eight behavioural biases exhibited by the investors such as mental accounting, anchoring, gambler's fallacy, availability, loss aversion, regret aversion, representativeness and overconfidence.
Design/methodology/approach: The relationship is derived based on a questionnaire survey conducted on 436 secondary equity investors residing in Chennai, India.
Findings: Analysis of variance test was performed on the normalised and non-normalised version of the biases divided in terms of the annual income earned by the investor. The test found that for the significant biases except the overconfidence bias, the investors with higher annual income were less prone to the biases when compared to investors with lower annual income. On the other hand, with respect to the overconfidence bias, the investors with higher annual income were prone to exhibit overconfidence bias when compared to the investors with lower annual income. Correlation analysis showed that the investors with high annual income were more likely to exhibit higher overconfidence bias but lower representativeness, loss aversion, availability and mental accounting biases.
Originality/value: A contribution in the financial and economic front which would benefit the financial advisors to now consider the income earned by the clients as an important factor while giving financial advice to the clients and while guiding them about the biases they are prone to exhibit.
Keywords: Mental accounting, Anchoring, Gambler's fallacy, Availability, Loss aversion, Regret aversion, Representativeness, Overconfidence
Introduction
Several demographic variables have been used to describe the profile of investors in both the primary and secondary equity markets. Among the demographic variables, the income earned by the investors play an important role, as it determines the proportion of income which goes into savings, the proportion of income which could be invested and the proportion which could be allocated for equity investment. The affordability of expert financial advice also depends on the amount of income earned. The better is the quality of the advice when more money is spent on it and hence the results of the financial investment are better. Very few studies look at the relationship between the income earned and investor behaviour in terms of the biases exhibited. This study aims at testing the relationship between the income earned and the biases exhibited by the secondary equity investors residing in Chennai.
Investor behaviour explained in terms of the behavioural biases exhibited has been the focus of several researchers lately. The investors had been assumed to be rational in most classical financial theories like, portfolio theory (Markowitz, 1952), capital asset pricing model (Sharpe, 1964), efficient market hypothesis (Fama, 1965a, 1965b, 1970). A rational investor is one who always makes normatively acceptable decisions and amends his beliefs on a continuous basis based on the incoming information (Thaler, 2005). The efficient market theory assumed that investors were rational and were able to process all the available information (Shiller, 1999). Several behavioural economists had questioned this rationality assumption, given the limited resources of time, money and processing capability of the human mind. According to them, the irrationality of the investors was reflected as random patterns in the stock prices in the stock market. Sentiments influenced the stock price movements and even led to extreme mispricing (Mathur and Rastogi, 2018).
In the decision of equity investment, emotions played an important role as information was abundant and uncertainties were high. With the market anomalies lining up due to the irrational behaviour of the investors, academics were directed to investigate psychology to explain the investor behaviour (Phung, 2010). Psychologists had documented that it was more likely for decisions to be influenced by emotions when the decisions to be taken became very complex (Cianci, 2008). Also, only seven plus or minus two bits of information can be assimilated at the same time by the human mind as indicated by Miller (1956). Hence, to manage the cognitive load which exceeded the normal capability of data processing, people were forced to take the help of heuristics to make decision-making more feasible, which in turn lead to irrational decision-making (Tversky and Kahneman, 1974; Simon and Newell, 1971; Gabaix and Laibson, 2000; Simon, 1979).
Chitra and Sreedevi (2011) on their investigation on how the personality traits of the investor influence the choice of investment, showed that the returns and emotional stability were more strongly correlated with equity than with other investment choices, hence proving that emotions affected the equity investment process the most. These emotions made the investors vulnerable and more prone to biases. Foerster (2011) also showed how the usage of heuristics in the stock market environment led to disappointments.
Kumar (2009) proved empirically that the investors were more likely to exhibit stronger biases when the stocks were more cumbersome to be valued and when there was a rise of uncertainty in the market. Hence when there was high valuation anxiety, the investors were more likely to commit larger financial mistakes. Sahi et al. (2013) suggested that the making of investment decisions could be better understood only when the psychology of the investors was understood. Waweru et al. (2008) showed that the behavioural factors played a prominent role in the process of decision-making of the investor in an environment bombarded with enormous information. Behavioural finance has been used to study the decision-making behaviour in different sectors including real estate (Waweru et al., 2014) and the biases influencing the decision had been identified.
The biases of the investors disturbed the effective decision-making ability of the investor in the stock market. The behavioural factors were mostly not considered by individual investors, and this in turn led to suboptimal investment performance (Chandra, 2008).
This study analyses the behaviour of secondary equity investors residing in Chennai by testing the relationship between the income earned and the eight biases suggested by Chandra and Kumar (2012) and Jayaraj (2013). Biases cause the investors to behave irrationally. Each bias leads to a different behaviour.
Mental accounting bias causes the investors to see each stock in terms of its value. The stocks whose prices have risen above the purchase price, i.e. the wining stocks are kept in a separate mental account and the stocks whose prices have fallen below the purchase price, i.e. the losing stocks are kept in a separate mental account. All the stock market transactions would be based on which mental account the stock is currently in. Anchoring bias causes the investors to adjust all the investment decisions based on an anchor. The anchor could be the purchase price of the stock, or the 52-week high, or the price at which a friend purchased a stock. The anchor selected is very subjective to the investor. Gambler's Fallacy causes the investors to anticipate the change in the trend of the stock market depending on the number of years of bullish success or bearish failure. Though each financial year is independent, they are assumed to be sequential. It is an intuitive judgement because of the belief that there are always two sides of a coin. Availability bias causes the investors to see only the information which is readily available about the stock while making the buy/sell decision. Important information could be ignored and only information which is popular and noticeable would be taken into decision-making. Loss Aversion bias causes the investors to be extremely averse to loses and hence hold on to the losing stocks of the portfolio and sell only the winning stocks. The losing stocks would be held in the portfolio till they make a profit even if the period of holding depreciates the stock's value. Regret Aversion bias causes the investors to postpone decisions which result in regret. Regret adverse investors would monitor the price of the stocks already sold and tend to regret if the price further increased post the sale. Representativeness bias causes the investors to look at the past prices of the stocks while making stock market decisions as the past price of the stock is assumed to be representative of the future. Overconfidence bias causes the investors to be overconfident about their stock picking ability, about their knowledge, about their information processing capability and about their skill set. Overconfident investors tend to take credit for all their successes in their portfolio but tend to blame others for their failures.
Literature review
The review of literature section is divided into five sections based on the different roles the income plays.
Role of income in shaping investors' behaviour
Income plays an important role in determining investors' behaviour in terms of the biases exhibited. Mittal and Vyas (2008) empirically proved that investors with annual income of less than Rs 1 lakh belonged to the cautious investment personality, whereas investors in the annual income range of Rs 1 to 2.5 lakhs belonged to the casual investment personality. Investors with higher annual income of Rs 2.5 to 4 lakhs belonged to the technical investment personality, and those with more than Rs 4 lakhs belonged to the informed investment personality. Chandra (2009) surveyed the investors in the Delhi region and found that the investors in the high annual income category were more competent and also trade frequently in the stock market as the high-income investors were more overconfident compared to the investors with lower annual income. But however, investors of all income groups preferred safety of their equity investment and avoided taking too many trading decisions thereby preferring status quo.
Zhu (2003) showed that the high-income investors exhibit less local bias, which means less favourism towards stocks of local companies compared to the low-income investors. They also documented that the wealthier investors exhibit less disposition effect because the rich investors have better access to expert financial advice for all their investments and are more capable of processing the information. The high-income investors exhibiting low disposition effect have an increasing tendency to sell the losing stocks and decreasing tendency to sell the wining stocks. Dhar and Zhu (2006) analysed the trading details of a large brokerage house and showed that the wealthier investors exhibited lesser disposition effect as irrespective of the education and financial knowledge possessed, they could afford to spend on financial advice and thereby reduce the bias.
Tseng and Yang (2011) documented that the income plays a moderating role in the influence of information search on risky investment preferences. Rana et al. (2014) recorded that income level had a significant positive relationship with digital and advice-seeking information search. The results of the study showed that the rich investors were keener to acquire information from financial experts compared to the poor investors to invest in risky assets. Islamog!lu et al. (2015) examined the factors influencing investor behaviour among the bankers in the Bartin region in Turkey. They showed that as the income level increased, the follow-up of information about the investments increased, their banking and payment behaviour was positively influenced, the influence of society and religion on investment decisions increased and the traditional investor attitude also improved. The influence of income on investment decision was best explained by the variable which stated that the rise in the level of income increases investors' interest in financial instruments. Umamaheswari and Kumar (2014) analysed the salaried middle-class investors in the Coimbatore region of India and found that the majority of them have the knowledge to make good investment decisions and choose the right proportion to save for the future, but one-third of them lack investment awareness to choose the correct financial plan.
Role of income in portfolio selection
Income plays an important role in portfolio selection. Shum and Faig (2006) analysing data from the USA Survey of Consumer Finances in the period 1992 to 2001 documented empirically that the decision of holding stocks was correlated positively with labour income and hence higher income signifies more probability to invest in stocks. Ranjith (2002) examined the risk preferences of the investors in the Ahmedabad region and showed that the investors in the annual income category of Rs 1 to 1.5 lakhs actively invest in the equity market. Thulasipriya (2015) found that there was no significant association between monthly income and the level of preferred investment avenues among the government employees. However, those with up to Rs 25,000 as monthly income have high level of investment preference.
Velmurugan et al. (2015) examined the investors' perception about the different investment avenues in the Vellore region in India and recorded that the high-income investors preferred to invest only in safe investment options like post office and bank deposits. Bhatt and Bhatt (2012) recorded that the low-income investors have less saving capacity and hence invest in safe investment options like bank deposit and post office deposit. On the other hand, the high- income investors invest in equity, insurance, mutual funds, F&O, real estate and commodities. Tirupathi and Ignatius (2013) examined the preference of the various investment avenues among the salaried investors in the Namakkal region of Tamil Nadu. They found that the investor's income level played a prominent role in deciding the portfolio composition. The lower-income investors were found to prefer Insurance and Bank Deposits compared to the other investment avenues. Sood and Medury (2012) found that investors in the annual income range of Rs 2 lakhs preferred mutual funds, investors in the annual income range of Rs 10 to 15 lakhs preferred life insurance products, investors in the annual income range of up to Rs 2 lakhs preferred fixed deposits, investors in the annual income range of Rs 5 to 10 lakhs preferred recurring deposits and investors in the annual income range of Rs 2 to 5 lakhs preferred market investments. They recorded that the investors in the annual income range of Rs 10 to 15 lakhs preferred risky investments and investments offering high returns. On the other hand, investors with annual income of up to Rs 2 lakhs preferred safer investment alternatives.
Ramanathan and Meenakshisundaram (2015) showed that the annual income of the investor and the investment made have a positive correlation and they also share a significant relationship. They also proved that 68.3 per cent of the respondents having an annual income lower than Rs 5 lakhs invest with the objective of return on income, 42.3 per cent of the respondents having an annual income in the category of Rs 5-10 lakhs invest with the objective of asset creation. Vaidehi and Vijayakumar (2016) analysed the behaviour of the investors in the Chennai region towards the equity market and documented that the investors in the high annual income range of more than Rs 30 lakhs were more aggressive and preferred growth stocks. Goetzmann and Kumar (2008) analysed the portfolio diversification among the US individual investors. They documented that the low-income investors are more bound to carry under-diversified portfolios and the level of diversification improved with the rise in income levels. Kannadhasan (2006) showed that the investor's income plays a prominent role in deciding the investment strategy and investment behaviour. Fu (2006) investigated the investors' behaviour in the Taiwan stock market and showed that investors with higher income were more concerned about the firms' ownership structure, were more attentive to financial transparency, disclosure of information, process and composition of Board of Directors when compared to the investors with lower income. Donkers and Van Soest (1999) showed that the high-income category was more interested in financial affairs when compared to the representative group of Dutch households, as the high-income category would have more investment opportunities.
Role of income in investors' saving behavior
Income plays an important role in determining investors' saving attitude. Bhabha et al. (2014) recorded that income was one of the important deciding factors of saving behaviour. Ahmad et al. (2006) showed that the growth rate of per capita income and the per capita income have a significant positive influence on the household saving rate in Pakistan. Faridi and Bashir (2010) explored the deciding factors of saving behaviour in the Multan region of Pakistan and proved that the saving capacity of the household increases with the rise in income level. Suman and Sabat (2012) documented that the income level of the investor was related to the saving objective and as the income varied, the proportion of savings also varied. seeking than the lower-income investors. Investors who were self-employed had a variable income and hence were less risk averse. Donkers et al. (2001) recorded strong relationship links between risk aversion and the income level, and they found that the individuals with high income levels were found to be less risk averse.
Role of income in investors' risk appetite
Income plays a prominent role in determining investors' risk appetite. Gupta and Sharma (2016) recorded that the investors with higher income have higher risk bearing capacity and are more likely to invest in mutual funds while analysing the factors affecting the level of satisfaction of the mutual fund investors in the Jaipur region. Geetha and Vimala (2014) documented that there is a significant relationship between the income level of the investor and the risk-taking capacity. Riley and Chow (1992) developed a model which indicated that the risk aversion reduces as individuals' income increases above the poverty level, and it also significantly reduces for the rich. The higher risk appetite of higher income individuals could be explained by the higher amount of funds available for investment and the better tolerance for the consequences of a bad decision as the income levels are above the subsistence level. Hence, the relative risk aversion index developed showed a negative relationship with the income. However, the individuals below the poverty line cannot be assumed to be very risk averse, as they hold no discretionary income thereby leading to very little flexibility in their budgets. Sung and Hanna (1996) analysed the factors influencing the risk tolerance of investors and documented that the non-investment income had a positive relationship with the risk tolerance level. Hence, higher income investors were more risk
Role of income in investors' financial literacy level
Income plays an important role in determining investors' financial literacy level. Kumar and Kasilingam (2017) surveyed investors in the Tamil Nadu region in India to examine the factors influencing financial literacy. They recorded that the financial literacy level improved with rise in monthly income. Investors in the high monthly income level of Rs 75,001 to Rs 1,00,000 and greater than Rs 1,00,000 exhibited the highest financial literacy levels. Whereas, investors in the low monthly income category of up to Rs 25,000 and Rs 25,001 to Rs 50,000 exhibited low financial literacy. Adequate financial literacy was exhibited by the investors with monthly income in the category of Rs 50,001 to Rs 75,000. Hence, investors with monthly income level of more than Rs 50,000 exhibited high financial literacy. Beal and Delpachitra (2003) analysed Australian university students and showed that the financial literacy increased as the income increased. Bujan et al. (2016) empirically assessed the financial literacy level of Croatian investors and showed that the income level significantly influenced financial literacy positively which implied that the high-income investors were more likely to possess adequate financial literacy levels. De Clercq and Venter (2009) documented that there is a significant difference among the financial literacy levels of the respondents with various income levels.
Objectives of the study
-
To study the role of income in the behaviour of investors with respect to the behavioural biases, namely, mental accounting, anchoring, gambler's fallacy, availability, loss aversion, regret aversion, representativeness and overconfidence exhibited by the secondary equity investors residing in Chennai;
-
to examine if the investors belonging to the various income groups differed with respect to the behavioural biases exhibited; and
-
to examine the relationship between the behavioural biases exhibited by the investors and the income earned by them.
Hypotheses of the study
H1. There is no significant difference between the means of the behavioural biases divided in terms of the income earned by the investors.
H2. There is no significant relationship between the behavioural biases and the income earned by the investors.
Materials and methods
The present research was carried out in the Chennai city of Tamil Nadu. The secondary equity investors chosen were the members of the Tamil Nadu Investors Association (TIA) and the clients of a popular financial services company, Integrated. TIA was selected as it was the only formal body which allowed access to collect data from its members. Integrated was selected as it was the only company which allowed access to collect data from its clients. Scheduled interviews were used to collect data from 436 secondary equity investo.
Results
Based on the demographic profile of the sample, in the annual income category, most of the samples belonged to the lower-income category. In total, 60.1 per cent of the sample was in the category of Rs 4 lakhs and below. The average annual income of the sample was Rs 4.24 lakhs. The reliability score of the biases measured is determined by way of Cronbach's coefficient alpha technique which indicates the acceptable internal consistency (0.826). The biases were measured using the questionnaire survey method on a Likert scale and five scenario-based questions were used to measure each bias.
ANOVA results of behavioural biases
For each of the biases the ANOVA was performed, and the summary of the results is shown in Table I . The significant biases include mental accounting, anchoring, availability, loss aversion, representativeness and overconfidence.
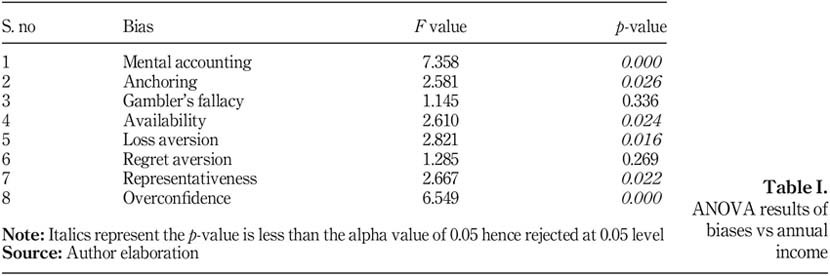
From the ANOVA test results (Table I), we can infer that except in gambler's fallacy and regret aversion, respondents belonging to the various income groups differed in all other biases
-
The respondents in the annual income category of Rs 4.01 to 6 lakhs had the highest mean of 16.27, and the respondents in the annual income category of more than Rs 10 lakhs had the lowest mean of 12.89 (based on Table II).
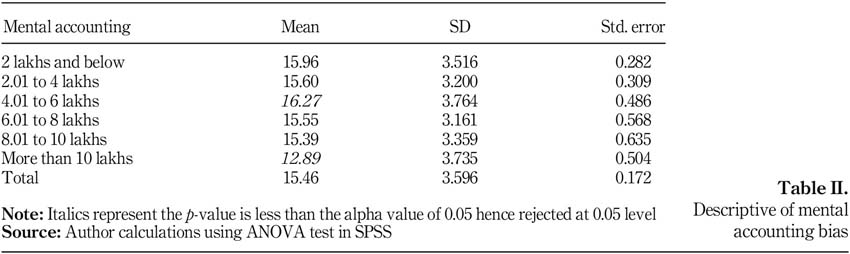
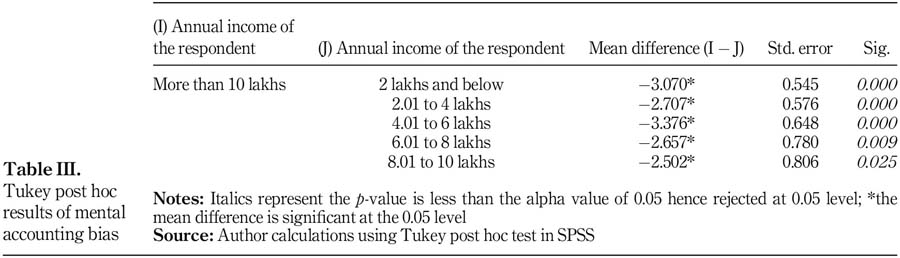
Based on the Tukey post hoc test (Table III), the mean of the mental accounting bias in the annual income category of greater than Rs 10 lakhs was significantly less than the means of the mental accounting biases in all other annual income groups. Thus, the respondents with an annual income of more than Rs 10 lakhs were less likely to exhibit the mental accounting bias when compared to the other income groups. Hence, it seemed that higher the annual income less was the propensity to exhibit the mental accounting bias. Also, with respect to most other biases like anchoring, availability and representativeness, the respondents in the annual income category of greater than Rs 10 lakhs had the lowest mean.
-
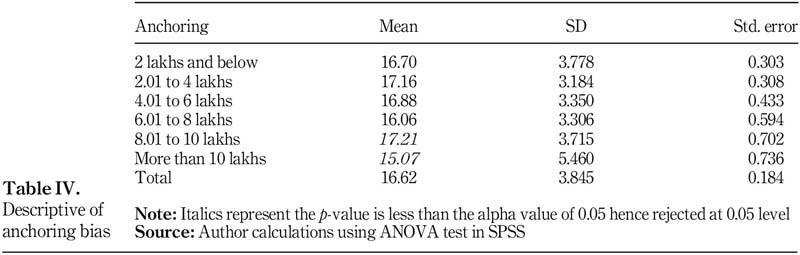
Anchoring bias: The respondents in the annual income category of Rs 8.01 to 10 lakhs had the highest mean of 17.21 and the respondents in the annual income category of greater than Rs 10 lakhs had the lowest mean of 15.07 (based on Table IV).
-
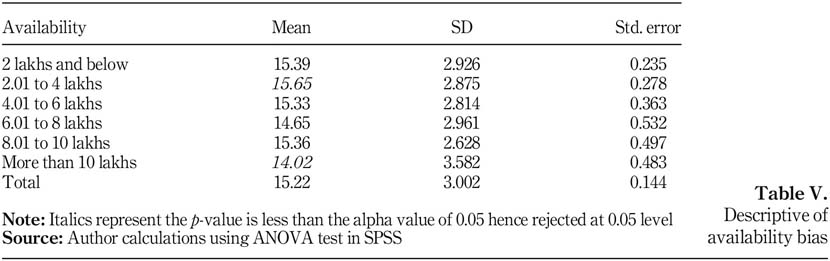
Availability bias: The respondents in the annual income category of Rs 2.01 to 4 lakhs had the highest mean of 15.65 and the respondents in the annual income category of greater than Rs 10 lakhs had the lowest mean of 14.02 (based on Table V).
-
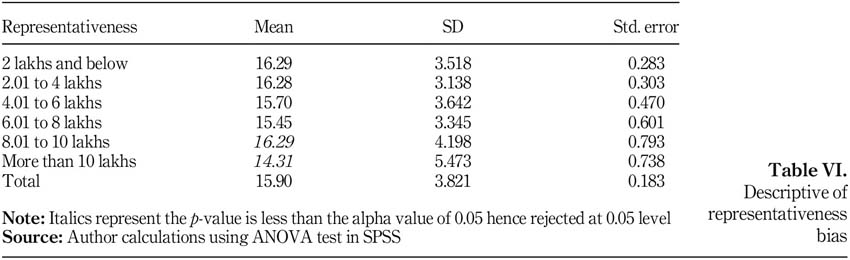
Representativeness bias: The respondents in the annual income categories of Rs 2.01 lakhs and below and Rs 8.01 to 10 lakhs had the highest mean of 16.29 and the respondents in the annual income category of greater than Rs 10 lakhs had the lowest mean of 14.31 (based on Table VI).
-
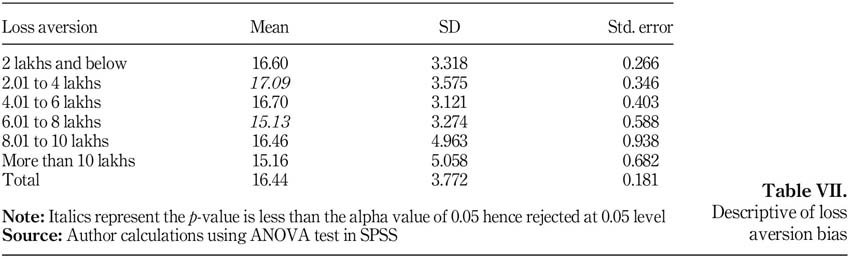
Loss aversion bias: The respondents in the annual income category of Rs 2.01 to 4 lakhs had the highest mean of 17.09, and the respondents in the annual income category of Rs 6.01 to 8 lakhs had the lowest mean of 15.13 (based on Table VII).
Overconfidence bias: The respondents in the annual income category of Rs. 8.01 to 10 lakhs had the highest mean of 19.68 and the respondents in the annual income category of Rs 2 lakhs and below had the lowest mean of 15.94 (based on Table VIII).
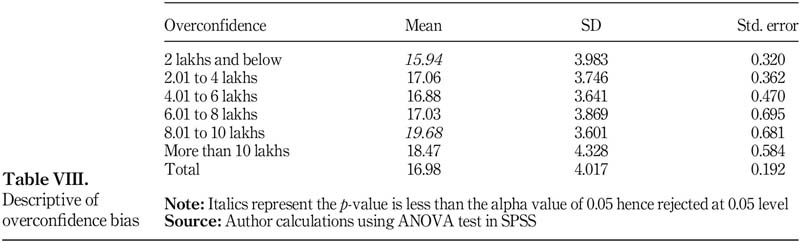
Only with respect to the overconfidence bias, the lower and higher means were reversed implying that respondents in the higher annual income exhibit higher overconfidence. This relation seemed logical as with increase in wealth came increase in purchasing power, and hence increase in confidence level.
From the test results, we found that the investors belonging to the higher end of the annual income range were less prone to the biases. Hayat et al. (2010) showed that investors with high income levels had better self-control and higher level of confidence on stock picking ability and specific skills. This explains the low propensity of the high-income category to exhibit the biases and the high overconfidence levels in this category because of the high knowledge levels.
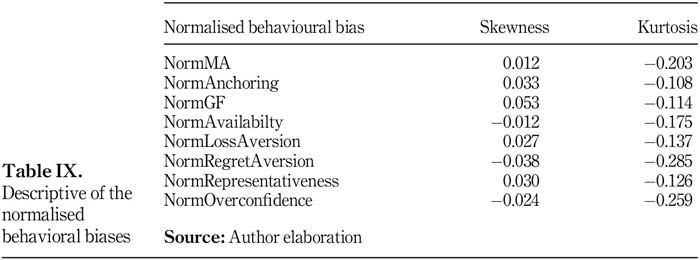
ANOVA results of normalised behavioural biases
The eight biases were normalised using the Transform function's IdfNormal command. These normalised variables have skewness within the acceptable range of -1 to +1 and kurtosis within the acceptable range of -3 to +3 indicating normality. The description of these normalised biases is given in Table IX.
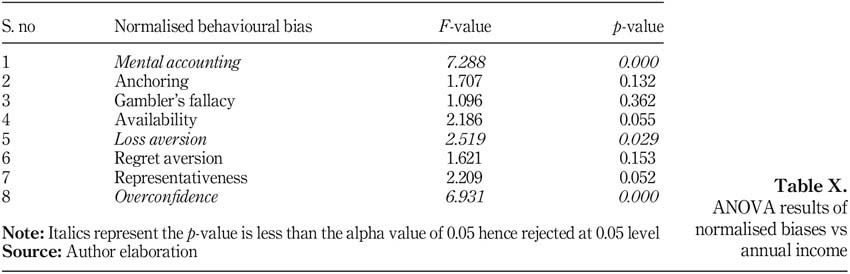
ANOVA test was performed on the normalised biases to examine if similar biases were significant. The results shown in Table X showed that only mental accounting, loss aversion and overconfidence were significant now after normalisation.
-
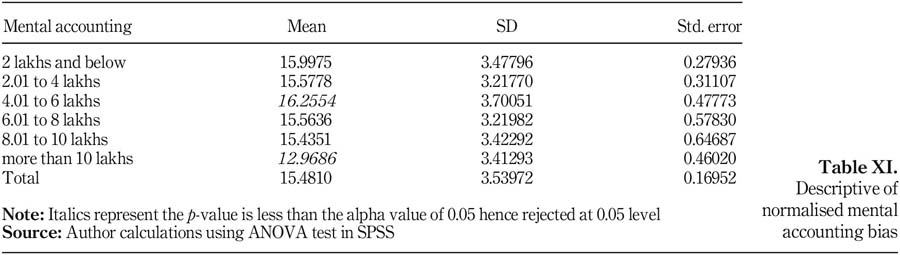
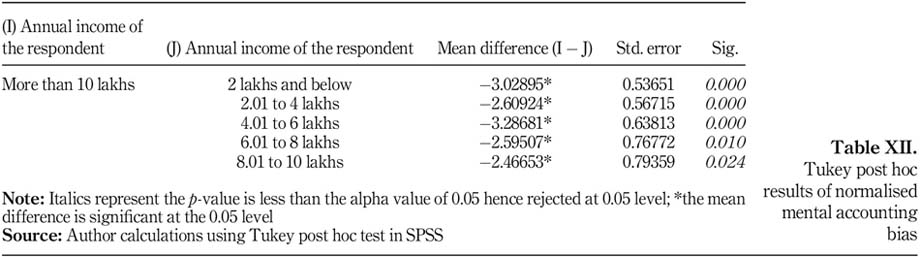
Mental accounting bias: The respondents in the annual income category of Rs 4.01 to 6 lakhs had the highest mean of 16.2554 and the respondents in the annual income category of greater than Rs 10 lakhs had the lowest mean of 12.9686 (based on Table XI). Based on the Tukey post hoc test (Table XII), the mean of the mental accounting bias in the annual income category of greater than Rs 10 lakhs was significantly lower than the means of the mental accounting biases in all other income groups. Hence, it seemed that higher the annual income less was the propensity to exhibit the mental accounting bias.
-
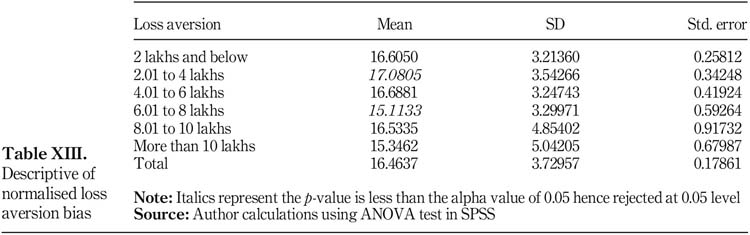
Loss aversion bias: The respondents in the annual income category of Rs 2.01 to 4 lakhs had the highest mean of 17.0805 and the respondents in the annual income category of Rs 6.01 to 8 lakhs had the lowest mean of 15.1133 (based on Table XIII).
-
Overconfidence bias: The respondents in the annual income category of Rs. 8.01 to 10 lakhs had the highest mean of 19.7143 and the respondents in the annual income category of Rs 2 lakhs and below had the lowest mean of 15.9470 (based on Table XIV).
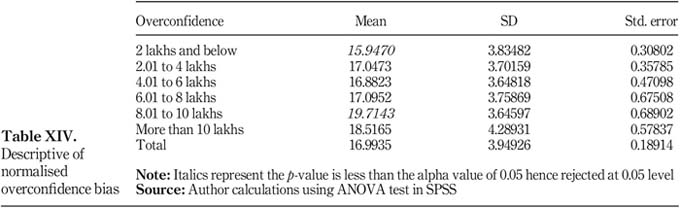
Only with respect to the overconfidence bias, the lower and higher means were reversed implying that respondents in the higher annual income exhibit higher overconfidence. This relation seemed logical as with increase in wealth came increase in purchasing power, and hence increase in confidence level.
From the test results of the normalised biases also, we found that the investors belonging to the higher end of the annual income range were less prone to the biases.
From the ANOVA results of both the normalised and the non-normalised biases, it is clear that the lower-income category of investors is those who are more likely to exhibit biases. The reasons for this could be drawn from the literature review:
-
Lack of affordability to spend on good financial advice as pointed out by Dhar and Zhu (2006) and Zhu (2003) could be one reason for the lower-income investors to be more prone to biases.
-
Low financial literacy level of the lower-income investors as pointed out by Kumar and Kasilingam (2017); Beal and Delpachitra (2003) and Bujan. (2016) could be another reason for them to be more prone to biases.
-
Low-income investors are risk averse in nature as pointed out by Gupta and Sharma (2016); Riley and Chow (1992); Sung and Hanna (1996) and Donkers et al. (2001). As a result, they could be prone to loss aversion bias and regret aversion bias.
-
Low competency level of the lower-income investors as pointed out by Chandra (2009) could be another reason for them to be more prone to biases.
-
Being less keen to acquire information from financial advisors as pointed out by Rana et al. (2014) could be another reason for the lower-income investors to be more prone to biases.
-
Having lesser information processing capacity as pointed out by Zhu (2003) could be another reason for the lower-income investors to be more prone to biases.
Correlation analysis
Pearson correlation (shown in Table XV) was performed between the normalised biases and the annual income earned. A significant positive correlation was found between the annual income and the overconfidence bias. A significant negative correlation was found between the annual income and the biases: representativeness, loss aversion, availability and mental accounting. This implies that investors with high annual income are more likely to exhibit higher overconfidence bias but lower representativeness, loss aversion, availability and mental accounting biases. Similarly, investors with lower annual income are more likely to exhibit lower overconfidence bias but higher representativeness, loss aversion, availability and mental accounting biases.
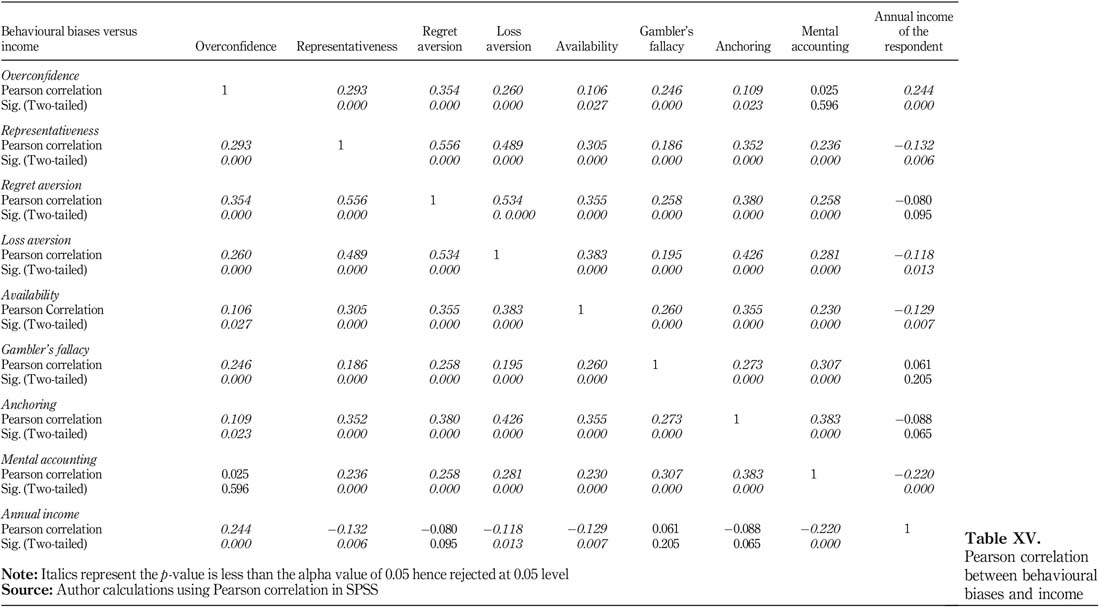
Significant correlation was also found among the behavioural biases. There was a significant positive correlation between:
-
the overconfidence bias and the biases: representativeness, regret aversion, loss aversion, availability, gambler's fallacy and anchoring;
-
the representativeness bias and the biases: overconfidence, regret aversion, loss aversion, availability, gambler's fallacy, anchoring and mental accounting;
-
the regret aversion bias and the biases: overconfidence, representativeness, loss aversion, availability, gambler's fallacy, anchoring and mental accounting;
-
the loss aversion bias and the biases: overconfidence, representativeness, regret aversion, availability, gambler's fallacy, anchoring and mental accounting;
-
the availability bias and the biases: overconfidence, representativeness, regret aversion, loss aversion, gambler's fallacy, anchoring and mental accounting;
-
the gambler's fallacy bias and the biases: overconfidence, representativeness, regret aversion, loss aversion, availability, anchoring and mental accounting;
-
the anchoring bias and the biases: overconfidence, representativeness, regret aversion, loss aversion, availability, gambler's fallacy and mental accounting; and
-
the mental accounting bias and the biases: representativeness, regret aversion, loss aversion, availability, gambler's fallacy and anchoring.
Managerial implications
The stock market is filled with several stocks and abundant information about each stock. Processing this information and taking a rational decision as to which transaction to make is a very difficult decision and a big drain on the mind. Emotions play a vital role in this decision-making process and that results in irrational decisions. The financial advisors and wealth managers are assigned the most important task of guiding the investors through this process of emotional decision-making. Serving clients having varied personalities and financial profiles is a very cumbersome task. The findings of this research will be useful to the advisors as now they can look into the income earned by the clients and segment them accordingly to high income and low-income groups and cater to each group based on the biases they are likely to exhibit.
Conclusion
This study examined if there is a relationship between the income earned by the investor and his/her behaviour with respect to the biases exhibited. In total, 436 secondary equity investors residing in Chennai were surveyed using the questionnaire survey method to measure eight behavioural biases on a Likert scale. By using the ANOVA test, it was determined that the means of the biases divided based on the annual income earned by the investors was significant for the biases: mental accounting, anchoring, availability, loss aversion, representativeness and overconfidence. In all the significant biases except the overconfidence bias, the investors who earned higher annual income were less prone to biases and the investors who earned lower annual income were more prone to biases. With respect to the overconfidence bias, the investors who earned a higher annual income were more overconfident than those who earned a lower annual income. When the biases measured were normalised, similar results were obtained but the significant biases were reduced to mental accounting, loss aversion and overconfidence. Correlation analysis showed that the investors with lower annual income were more likely to exhibit lower overconfidence bias but higher representativeness, loss aversion, availability and mental accounting biases. Hence, special attention needs to be given to the lower-income category of investors. Due to reasons like less money available to spend on good financial advice, less financial knowledge, poor education and low financial literacy level, the lower-income category of investors could be more prone to exhibit biases. Financial advisors and wealth mangers should advice the lower-income investors accordingly and educate them to be more cautious regarding the biases they are prone to exhibit.
References
Ahmad, M.H., Atiq, Z., Alam, S. and Butt, M.S. (2006), "The impact of demography, growth and public policy on household saving: a case study of Pakistan", Asia Pacific Development Journal, Vol. 13 No. 2, pp. 57-72. [ Links ]
Beal, D.J. and Delpachitra, S.B. (2003), "Financial literacy among Australian University students", Economic Papers: A Journal of Applied Economics and Policy, Vol. 22 No. 1, pp. 65-78. [ Links ]
Bhabha, J.I., Kundi, G.M., Qureshi, Q.A., Khan, S. and Nawaz, A. (2014), "Factors affecting the attitude of working-women towards saving-investment in developing countries", Journal of Economics and Sustainable Development, Vol. 5 No. 11, pp. 36-41. [ Links ]
Bhatt, K.A. and Bhatt, K. (2012), "Effects of investor occupation and education on choice of investment: an empirical study in India", International Journal of Management, Vol. 29 No. 4, pp. 439-454. [ Links ]
Bujan, I., Cerovic, L. and DukicSamarca, N. (2016), "Socio demographic determinants of financial literacy of the citizens of the Republic of Croatia", Ekonomskipregled, Vol. 67 No. 3, pp. 206-226. [ Links ]
Chandra, A. (2008), "Decision making in the stock market: incorporating psychology with finance", paper presented at the National Conference on Forecasting Financial Markets of India, 29 December, IIT Kharagpur, Kharagpur, available at: https://mpra.ub.uni-muenchen.de/id/eprint/21288 [ Links ]
Chandra, A. (2009), "Individual investors' trading behaviour and the competence effect", IUP Journal of Behavioural Finance, Vol. 6 No. 1, pp. 56-70. Income and behavioural biases 141 [ Links ]
Chandra, A. and Kumar, R. (2012), "Factors influencing Indian individual investor behaviour: survey evidence", Decision, Vol. 39 No. 3, pp. 141-167. [ Links ]
Chitra, K. and Sreedevi, V.R. (2011), "Does personality traits influence the choice of investment?", IUP Journal of Behavioural Finance, Vol. 8 No. 2, pp. 47-57. [ Links ]
Cianci, A.M. (2008), "The impact of investor status on investors' evaluation of negative and positive, separate and combined information", The Journal of Behavioural Finance, Vol. 9 No. 3, pp. 117-131. [ Links ]
De Clercq, B. and Venter, J.M.P. (2009), "Factors influencing a prospective chartered accountant's level of financial literacy: an exploratory study", Meditari Accountancy Research, Vol. 17 No. 2, pp. 47-60. [ Links ]
Dhar, R. and Zhu, N. (2006), "Up close and personal: investor sophistication and the disposition effect", Management Science, Vol. 52 No. 5, pp. 726-740. [ Links ]
Donkers, B. and Van Soest, A. (1999), "Subjective measures of household preferences and financial decisions", Journal of Economic Psychology, Vol. 20 No. 6, pp. 613-642. [ Links ]
Donkers, B., Melenberg, B. and Van Soest, A. (2001), "Estimating risk attitudes using lotteries: alarge sample approach", Journal of Risk and Uncertainty, Vol. 22 No. 2, pp. 165-195. [ Links ]
Fama, E.F. (1965a), "Random walks in stock market prices", Financial Analysts Journal, Vol. 21 No. 5, pp. 55-59. [ Links ]
Fama, E.F. (1965b), "The behavior of stock-market prices", The Journal of Business, Vol. 38 No. 1, pp. 34-105. [ Links ]
Fama, E.F. (1970), "Efficient capital markets: a review of theory and empirical work", The Journal of Finance, Vol. 25 No. 2, pp. 383-417. [ Links ]
Faridi, M.Z. and Bashir, F. (2010), "Households saving behaviour in Pakistan: a case of Multan district", Pakistan Journal of Social Sciences (PJSS), Vol. 30 No. 1, pp. 17-29. [ Links ]
Foerster, S. (2011), "Double then nothing: why stock investments relying on simple heuristics may disappoint", Review of Behavioural Finance, Vol. 3 No. 2, pp. 115-140. [ Links ]
Fu, H. (2006), "Effects of financial information transparency on investor behavior in Taiwan stock market", Order No 3223496, available from ABI/INFORM Collection. (304911821), available at: https://search.proquest.com/docview/304911821?accountid=39490 (accessed 26 September 2018). [ Links ]
Gabaix, X. and Laibson, D. (2000), "A boundedly rational decision algorithm", American Economic Review, Vol. 90 No. 2, pp. 433-438. [ Links ]
Geetha, S.N. and Vimala, K. (2014), "Perception of household individual investors towards selected financial investment avenues (with reference to investors in Chennai city)", Procedia Economics and Finance, Vol. 11, pp. 360-374. [ Links ]
Goetzmann, W.N. and Kumar, A. (2008), "Equity portfolio diversification", Review of Finance, Vol. 12 No. 3, pp. 433-463. [ Links ]
Gupta, N. and Sharma, A. (2016), "A study on factors effecting the satisfaction level of mutual funds investors in Jaipur city", SAMVAD, Vol. 12, pp. 80-84. [ Links ]
Hayat, M.A., Bukhari, K. and Ghufran, B. (2010), "Understanding investment behavior of individual investors: how they handle investment decisions? Do they act rationally?", unpublished doctoral dissertation, Institute of Management Science, Bahauddin Zakariya University, Multan. [ Links ]
Islamoglu, M., Apan, M. and Ayvali, A. (2015), "Determination of factors affecting individual investor behaviours: a study on bankers", International Journal of Economics and Financial Issues, Vol. 5 No. 2, pp. 531-543. [ Links ]
Jayaraj, S. (2013), "The factor model for determining the individual investment behavior in India", Journal of Economics and Finance, Vol. 1 No. 4, pp. 21-32. [ Links ]
Kannadhasan, M. (2006), "Risk appetite and attitudes of retail investors with special reference to Capital market", The Management Accountant, pp. 448-454. [ Links ]
Kumar, A. (2009), "Hard-to-value stocks, behavioral biases, and informed trading", Journal of Financial and Quantitative Analysis, Vol. 44 No. 6, pp. 1375-1401. [ Links ]
Kumar, V.R. and Kasilingam, R. (2017), "Does the demographics and selected investor profile factors influence financial literacy? An investor perception study", Sumedha Journal of Management, Vol. 6 No. 2, pp. 75-89. [ Links ]
Markowitz, H. (1952), "Portfolio selection", The Journal of Finance, Vol. 7 No. 1, pp. 77-91. [ Links ]
Mathur, S. and Rastogi, A. (2018), "Investor sentiment and asset returns: the case of Indian stock market", Afro-Asian Journal of Finance and Accounting, Vol. 8 No. 1, pp. 48-64. [ Links ]
Miller, G.A. (1956), "The magical number seven, plus or minus two: some limits on our capacity for processing information", Psychological Review, Vol. 63 No. 2, pp. 81-97. [ Links ]
Mittal, M. and Vyas, R.K. (2008), "Personality type and investment choice: an empirical study", The ICFAI University Journal of Behavioral Finance, Vol. 5 No. 3, pp. 7-22. [ Links ]
Phung, A. (2010), "Behavioral finance", available at: http://i.investopedia.com/inv/pdf/tutorials/BehavioralFinance.pdf (accessed 26 September 2018). [ Links ]
Ramanathan, K.V. and Meenakshisundaram, K.S. (2015), "A study of the investment pattern of bank employees", Proceedings of International Conference on Management Finance Economics, pp. 156-162. [ Links ]
Rana, H.M., Khan, J. and Baig, A.A. (2014), "Information searches as a mediator between income and risky decision-making behavior and influence of education on risky decision-making behavior: a study from Pakistan", The Business and Management Review, Vol. 4 No. 3, pp. 81-93. [ Links ]
Ranjith, V.K. (2002), "Risk preference of investors in the city of Ahmedabad", Finance India, Vol. 16 No. 2, pp. 531-539. [ Links ]
Riley, W.B., Jr and Chow, K.V. (1992), "Asset allocation and individual risk aversion", Financial Analysts Journal, Vol. 48 No. 6, pp. 32-37. [ Links ]
Sahi, S.K., Arora, A.P. and Dhameja, N. (2013), "An exploratory inquiry into the psychological biases in financial investment behavior", Journal of Behavioral Finance, Vol. 14 No. 2, pp. 94-103. [ Links ]
Sharpe, W.F. (1964), "Capital asset prices: atheory of market equilibrium under conditions of risk", The Journal of Finance, Vol. 19 No. 3, pp. 425-442. [ Links ]
Shiller, R.J. (1999), "Human behavior and the efficiency of the financial system", Handbook of Macroeconomics, Vol. 1, pp. 1305-1340. [ Links ]
Shum, P. and Faig, M. (2006), "What explains household stock holdings?", Journal of Banking and Finance, Vol. 30 No. 9, pp. 2579-2597. [ Links ]
Simon, H.A. (1979), "Rational decision making in business organizations", The American Economic Review, Vol. 69 No. 4, pp. 493-513. [ Links ]
Simon, H.A. and Newell, A. (1971), "Human problem solving: the state of the theory in 1970", American Psychologist, Vol. 26 No. 2, pp. 145-159. [ Links ]
Sood, P.B. and Medury, Y. (2012), "Investment preferences of salaried individuals towards financial products", International Journal of Management and Behavioural Sciences, Vol. 1 No. 1, pp. 95-107. [ Links ]
Suman, C. and Sabat, K.D. (2012), "A study of saving and investment behaviour of individual households: an empirical evidence from Orissa", RJEBS, Vol. 2 No. 1, pp. 24-33. [ Links ]
Sung, J. and Hanna, S. (1996), "Factors related to risk tolerance", Journal of Financial Counseling and Planning, Vol. 7, pp. 11-19. [ Links ]
Thaler, R.H. (Ed.) (2005), Advances in Behavioral Finance, Princeton University Press, Upper Saddle River, NJ. [ Links ]
Thulasipriya, B. (2015), "A study on the investment preference of government employees on various investment avenues", International Journal of Management Research and Social Science (IJMRSS, ), Vol. 2 No. 1, pp. 9-16. [ Links ]
Tirupathi, T. and Ignatius, A. (2013), "A study on preferred investment avenues among salaried peoples with reference to Namakkal Taluk, Tamilnadu", Trends and Challenges in Global Business Management, pp. 90-94. [ Links ]
Tseng, S. and Yang, C. (2011), "Influence of information search on risky investment preferences: testing a moderating role of income", Proceedings of the 3rd International Conference on Information and Financial Engineeringin Singapore, Vol. 12, pp. 452-456. [ Links ]
Tversky, A. and Kahneman, D. (1974), "Judgment under uncertainty: heuristics and biases", Science (New York, N.Y.), Vol. 185 No. 4157, pp. 1124-1131. [ Links ]
Umamaheswari, S. and Kumar, M.A. (2014), "A special study on Coimbatore based salaried investors' awareness, attitude, expectation and satisfaction over their investments", Impact: International Journal of Research in Business Management, Vol. 2 No. 2, pp. 99-108. [ Links ]
Vaidehi, R. and Vijayakumar, J.G. (2016), "A study on equity investment motives and styles of individual investors", Journal of Exclusive Management Science, Vol. 5 No. 2, pp. 1-10. [ Links ]
Velmurugan, G., Selvam, V. and Nazar, N.A. (2015), "An empirical analysis on perception of investors' towards various investment avenues", Mediterranean Journal of Social Sciences, Vol. 6 No. 4, pp. 427-435. [ Links ]
Waweru, N.M., Munyoki, E. and Uliana, E. (2008), "The effects of behavioral factors in investment decision-making: asurvey of institutional investors operating at the Nairobi stock exchange", International Journal of Business and Emerging Markets, Vol. 1 No. 1, pp. 24-41. [ Links ]
Waweru, N.M., Mwangi, G.G. and Parkinson, J.M. (2014), "Behavioural factors influencing investment decisions in the Kenyan property market", Afro-Asian Journal of Finance and Accounting, Vol. 4 No. 1, pp. 26-49. [ Links ]
Zhu, N. (2003), "Investor behavior, differential information, and asset pricing", Order No. 3109486, available from ABI/INFORM Collection, (304737089), available at: https://search.proquest.com/docview/304737089?accountid=39490 (accessed 26 September 2018). [ Links ]
Citation:
Isidore R., R. and P., C. (2019), "The relationship between the income and behavioural biases", Journal of Economics, Finance and Administrative Science, Vol. 24 No. 47, pp. 127-144. https://doi.org/10.1108/JEFAS-10-2018-0111
Received: 26 October 2018
Revised: 26 October 2018
Accepted: 10 December 2018

