


Services on Demand
Journal

Article
 English (pdf)
 Article in xml format
 Article references
 Send this article by e-mail
Indicators
-
 Cited by SciELO
Related links
-
 Similars in
SciELO
Similars in
SciELO
Share

 Permalink
Journal of Economics, Finance and Administrative Science
Print version ISSN 2077-1886
Journal of Economics, Finance and Administrative Science vol.24 no.48 Lima July/Dic. 2019
http://dx.doi.org/https://doi.org/10.1108/JEFAS-01-2018-0013
ARTICLE
Fractional differencing in stock market price and online presence of global tourist corporations
Francisco Flores-Muñoz1,*
Alberto Javier Báez-García2
Josué Gutiérrez-Barroso3
1Department of Economics, University of La Laguna, San Cristóbal de La Laguna, Spain
2Department of Political Science, Universidad de La Laguna, La Laguna, Spain
3Department of Sociology, Universidad de La Laguna, La Laguna, Spain
Corresponding author: *francisco.flores.munhoz@gmail.com
Abstract
Purpose: This work aims to explore the behavior of stock market prices according to the autoregressive fractional differencing integrated moving average model. This behavior will be compared with a measure of online presence, search engine results as measured by Google Trends.
Design/methodology/approach: The study sample is comprised by the companies listed at the STOXX® Global 3000 Travel and Leisure. Google Finance and Yahoo Finance, along with Google Trends, were used, respectively, to obtain the data of stock prices and search results, for a period of five years (October 2012 to October 2017). To guarantee certain comparability between the two data sets, weekly observations were collected, with a total figure of 118 firms, two time series each (price and search results), around 61,000 observations.
Findings: Relationships between the two data sets are explored, with theoretical implications for the fields of economics, finance and management. Tourist corporations were analyzed owing to their growing economic impact. The estimations are initially consistent with long memory; so, they suggest that both stock market prices and online search trends deserve further exploration for modeling and forecasting. Significant differences owing to country and sector effects are also shown.
Originality/value: This research contributes in two different ways: it demonstrate the potential of a new tool for the analysis of relevant time series to monitor the behavior of firms and markets, and it suggests several theoretical pathways for further research in the specific topics of asymmetry of information and corporate transparency, proposing pertinent bridges between the two fields.
Keyword: ARFIMA, Global corporations, Online search trends, Stock market behaviour
1. Introduction
Financial markets constitute challenging subjects of study that attract the interest of economists, psychologist and other scholars. Its expected performance is highly based on our conceptions about rationality of agents involved, along with the proper availability of data sources for informed decision-making. Asymmetry of information is almost evident when considering the great variety of investors that operate in financial markets, from sophisticated institutional investors to noisy traders (Barber and Odean, 2007), with different time horizons and disparate level of sophistication in their level of analysis of business facts and economic trends. This asymmetry also comes from the fact that the goals of investors and quoted corporations do not always coincide. Within corporations, there is also a gap between the purpose of those in charge of the corporate government and the providers of financial capital (Hart, 1995). Investment decisions imply data search and processing, and this process could be initiated by means of search engines like Google; so, there exists the hypothesis that online popularity and market behavior can be somehow connected (Preis et al., 2013). An in-depth research on these links is strongly needed, involving both theoretical and methodological implications. Both theoretical and practical questions arise to clarify if these series are, to a certain extent, suitable for modeling and forecasting.
2. Background
Firms are exposed to a great pressure in modern economies owing to growing scrutiny by different interest groups and the society as a whole. In this scenario, a given person can subsequently play the role of interested citizen, customer, employee or shareholder of a given quoted corporation. The decision to play each of these roles depends largely on what online data sources about that corporation are effectively available. Stock market prices are the classic data set, now in competition with other relevant digital barometers like Google Trends (Choi and Varian, 2012). Roughly speaking, stock market behavior can be considered representative of the shareholders, whereas online attention is provided by a whole set ofstakeholders.
Efficient market hypothesis (EMH) and competing frameworks to explain market behavior were summarized by Glen (2005). The discussion gravitates around the concept of predictability. If the market follows the hypothesis, then making forecast is an unnecessary exercise, as long as the current stock prices reflect all available information and is open to change in the light of unexpected news. If a certain degree of predictability is possible, further questions arise: To what extent is it possible to make reliable forecasts? Could then relevant breakpoints be efficiently detected? Are there long-term impacts of certain events in the studied phenomena?
According to Fama (1970), available information is key to classify how efficient is a certain market. Weak-form efficiency implies that only past prices and returns are the key factors that influence current and prices. A semi-strong form includes all publicly available information – not only past prices – influencing current prices. Finally, according to the strong-form efficiency, not only public but also private information influences market behavior. For all these cases, the EMH represents a negation of the possibility of predicting future market prices, as long as current prices already reflect all the relevant information and will do so in the future. As a result, stock prices are expected to behave as unpredictable random walks, independent observations. Departures from these statements can be found under the so-called "noisy trader" and "chaos" theories. The noisy trader theory assumes that, in a given market, there is heterogeneity in how investors process information. This leads to nonlinearity and the emergence of the chaos theory (Glen, 2005), according to which a certain level of modeling and forecasting is possible. These departures are strongly linked with the fruitful field of behavioral finance; some approaches, like the adaptive market hypothesis (Lo, 2005), tried to reconcile some aspects of EMH to the abovementioned heterogeneity, inspired by the idea of the market as an ecosystem of different agents evolving and adapting to changes, but these views remain still in a qualitative form of discussion.
In his comment, Glen (2005) also pointed to the chaos theory as a potential instrument to understand markets that diverge from the hypothesized efficiency. Since the developments of Lorenz (1963), the chaos theory has been present in diverse fields, connected to notions of limited short-run-only predictability (a popular concept in meteorology) and self-similarity. Without being exhaustive, we consider to mention some interesting details on these concepts:
-
Lorenz presents a model (of atmospheric behavior) in which, from relatively simple equations, given certain initial conditions and specific values for the parameters, an apparently random behavior can be obtained. This provides a new interesting view for researchers in many fields: perhaps apparently complex behavior is generated from simple deterministic process.
-
This new type of system tends to be very sensitive to initial conditions; therefore, it has a long memory.
-
Other authors like Mandelbrot (1983) developed a geometry based on the concept of the fractal dimension. In fact, under this approach, dimensions do not need to take integer values (0 in a point, 1 in a line, 2 in a plane figure, 3 in a body, like in Euclidean geometry) but can present fractional values that can be accurately measured as the "fractal" dimension. The profile presented by many economic and financial time series resembles this kind of graphical objects.
-
Another interesting feature of the chaotic systems is its self-similarity (e.g. smaller parts resemble the shape and properties of a bigger piece of it).
As pointed out by Mouck (1998), Fama (1963) warned the academia, highlighting Mandelbrot’s findings about market behavior, a warning largely ignored by research in economics, accounting and finance until the instability of the 80s and the proposals of Peters (1994) and his fractal market hypothesis.
In this empirical paper, an exploration of the relationship between stock market prices and online search trends is attempted, to contribute to this ongoing discussion. This report complements the previous work of Ikeda (2017), who found that most of the US industrial sector stocks are fractal. The present paper complements that view by using directly stock market prices and online search trends as data sources and uses autoregressive fractional differencing integrated moving average [ARFIMA(p, d, q; P, Q)] processes (Granger and Joyeux, 1980) instead of the Hurst exponent (Hurst, 1951) to approach the fractal nature of the processes involved; so, this paper also provides in the sense of estimation procedures with respect to previous work like Acuña-Opazo and Álvarez-Marín (2017) and Flores-Muñoz et al. (2018).
3. Methodology
To analyze relevant economic and financial time series, several methods are available. In recent years, owing to the inspiration of the chaos theory, fractal geometry and several other instrumental advancements, along with a significantly growing availability of data, this type of empirical studies has flourished. Mandelbrot’s (1983) dimension would then be somehow connected with time-series analysis by means of the so-called long-run dependence systems or long memory processes. With this, chaos theory concepts have a certain connection with a robust methodology for the analysis of time series: the Box– Jenkins methodology (1971) or the autoregressive integrated moving average (ARIMA) estimation process. Abraham-Frois (1998) offers a didactic view of this connection, which is not free of controversy, and that we follow here.
Let yt be a relevant time series for our purposes (stock market price for a given firm was already mentioned, and other proxies will be introduced later). When performing ARIMA, the first step is to evaluate if the series is stationary or not, that is if the mean and autocovariances of the series do not depend on time. Therefore, usually the time series first needs to be differenced until it is stationary. The number of times the series needs to be differenced to achieve stationarity is reflected in the d parameter (Box and Jenkins, 1976). When d is allowed to be a non-integer, then the result is a fractionally integrated, autoregressive and moving average estimation model (ARFIMA) (see Appendix for some extra details on notations).
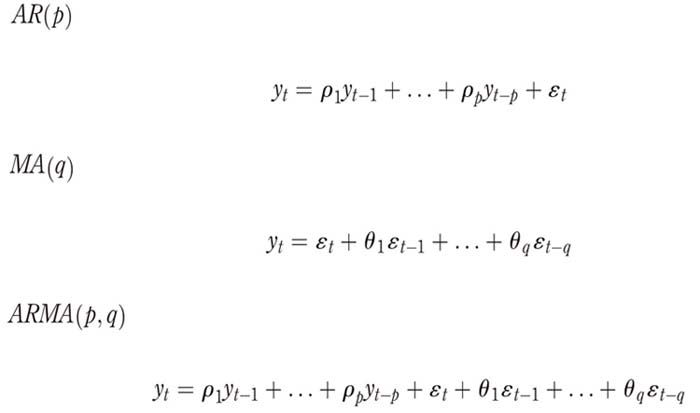
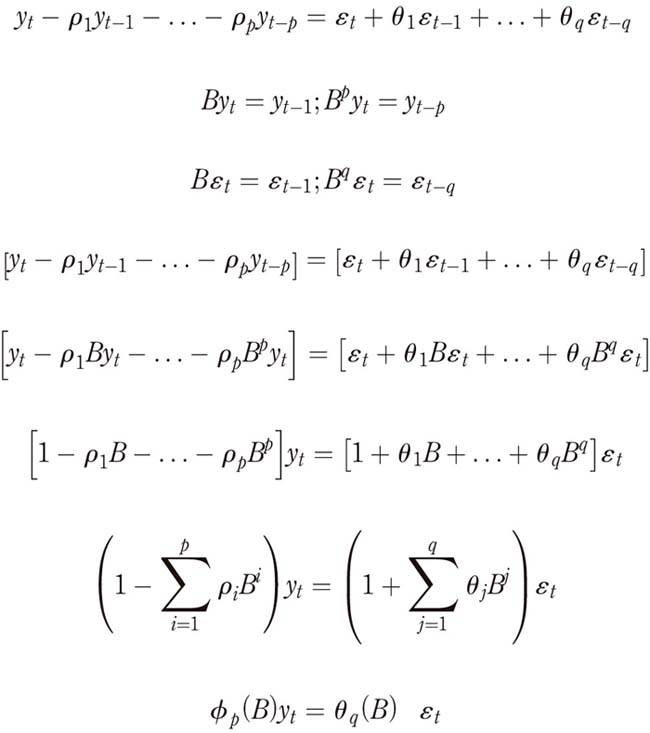
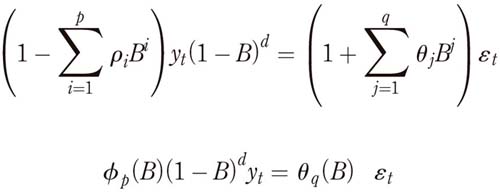
Originally proposed by Granger and Joyeux (1980), the ARFIMA model follows the expression:
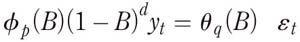
or
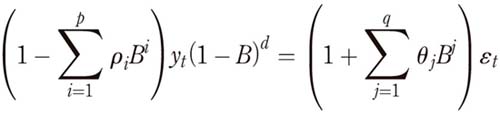
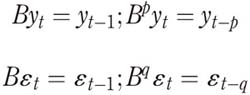
where (1 – B)d allows for the fractional differencing of yt in pursuit of stationarity, where Ρi and θj are, respectively, the p and q corresponding AR(p) and MA(q) estimations; B is the "lag" operator; and t εj is the usual random residual.
As noted by Peters (1994), a non-integer value for d is connected to the concept of fractal dimension D developed by Mandelbrot, as follows:
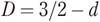
The fractal dimension is related to a set of objects whose dimension is not an integer. Figure 1 illustrates the comparison with the classic Euclidean idea of dimension compared with the one studied in fractal geometry. Volatile stock prices and online search results are among candidates in social sciences to be analyzed to the light of this novel approach. The d parameter is also related to the popular Hurst exponent (Hurst, 1951), which is a measure of long memory in time series (Nile river behavior). This relationship allows researchers to establish certain boundaries and to some extent decipher the behavior of the corresponding time series as follows:
-
If d = 0, the process does not present long memory, only short term. D = 1.5
-
If 0 < d < 0.5, the process is persistent and presents long memory.
-
If d = 0.5, the process can be considered as random walk, and thus unpredictable.
ARFIMA estimations have been used by Panas (2001), indicating the presence of long memory in the Athens Stock Exchange. Complementary measurements of the fractal dimension, as the Hurst rescaled range, offered by Ikeda (2017), are also applied to other stock indices. Estimating d in a financial time series is relevant because if significantly different from 0 and 0.5, it is related to long memory and to a certain degree of predictability. Additionally, a correct modeling of a time series allows for a more efficient detection of structural breaks. Several other studies attempt to find nonlinear and/or chaos behavior in market dynamics. Those are summarized by Barnett and Serletis (2000) and include different stock market indices like FSTE 100. These previous works are here completed with a new methodological perspective and under the light of a comparison with a nonfinancial concurrent time series as proxy of"online popularity", the nonmonetary vote of the digital era, represented by Google Trends series. We also compare classic ARIMA(p, d, q; P, Q) processes with the corresponding ARFIMA ones. The study sample is comprised by the companies listed at the STOXX® Global 3000 Travel and Leisure. Google Finance and Yahoo Finance, along with Google Trends, were used, respectively, to obtain the data of stock prices and search results, for a period of five years (October 2012 to October 2017). In the case of the stock market, we used prices instead of returns to avoid over-differentiation. To guarantee certain comparability between the two data sets, weekly observations were collected, with a total figure of 118 firms, two time series each (price and search results), 52 weeks per year per series, around 61,000 observations. Relationships between the two data sets are explored, with theoretical implications for the fields of economics, finance and management. A sample of tourist corporations was analyzed owing to their growing economic impact. Estimation of d was performed using EViews9 (based on Sowell, 1992; Doornik and Ooms, 2003). This research contributes in two different ways: it demonstrates the potential of a new tool for the analysis of relevant time series to monitor the behavior of firms and markets, and it suggests several theoretical pathways for further research in the specific topics of asymmetry of information and corporate transparency, proposing pertinent bridges between the two fields.
Euclid’s versus Mandelbrot’s dimensional object is presented in Figure 1.
4. Empirical results
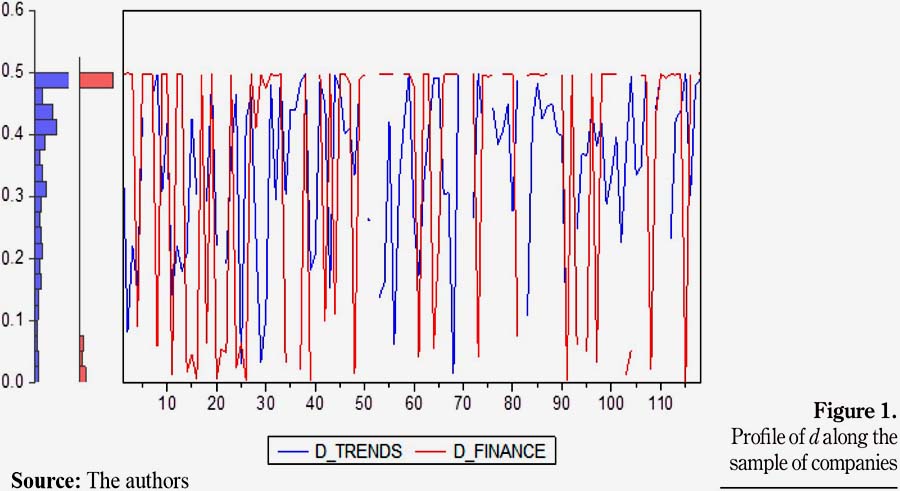
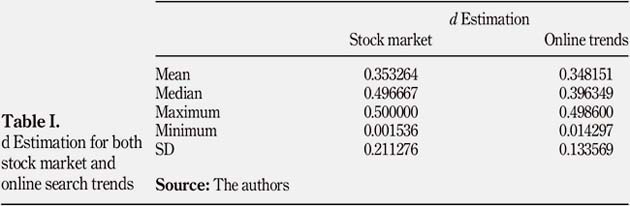
Preliminary descriptive results are fully provided below. Table I offers a first view of the estimation of d for all suitable models. It is relevant to note that both sets of models situate the differencing parameter in the proximity of 0.35, corresponding to long memory, with similar standard deviations.
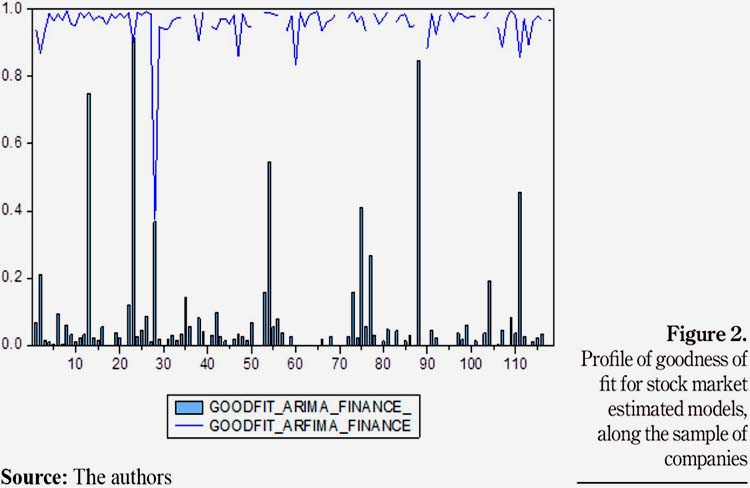
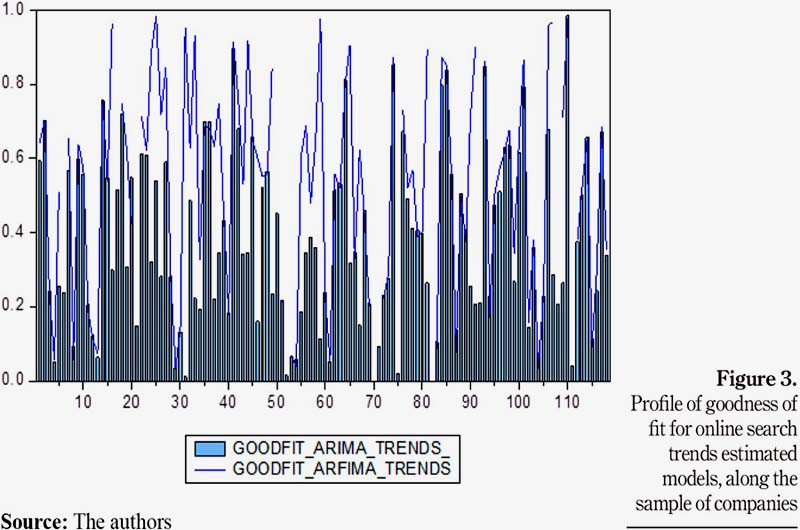
A graphic profile of both sets of estimations, firm by firm, is provided in Figure 1. Subsequent figures, Figure 2 and 3, respectively, compare the R2 of ARIMA versus their corresponding ARFIMA model against the sample of companies; in this case, the behavior of models for trends is more similar between the two techniques, and the overperforming of ARFIMA is higher for stock market prices (a unit root was detected in almost all of them).
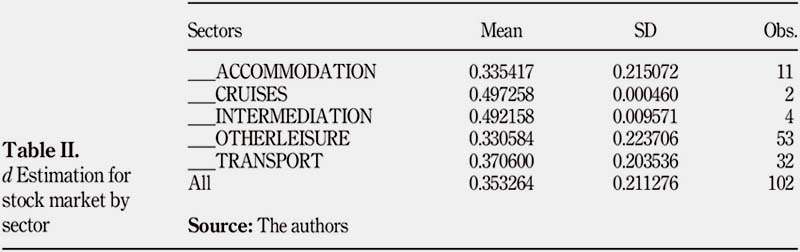
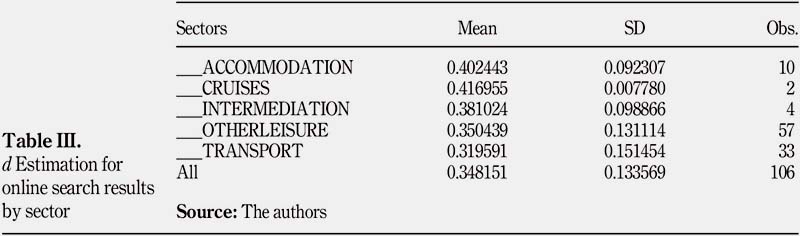
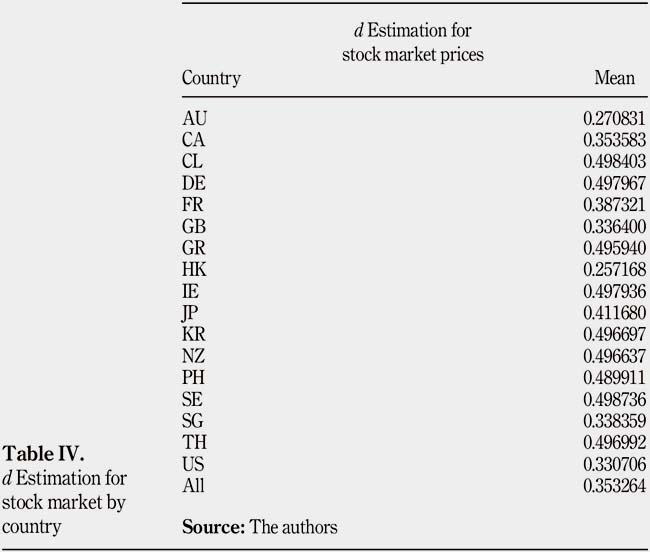
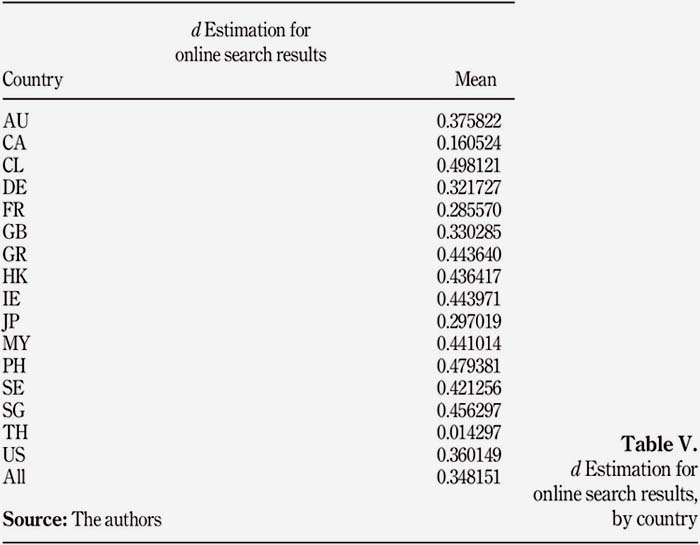
After this initial analysis, three factors (country, sector and size of each corporation) were considered, to explore differences between firms. Both the sector (Table II and III) and the country (Table IV and V) of the corporation seem to have an impact on d, which will require further investigation.
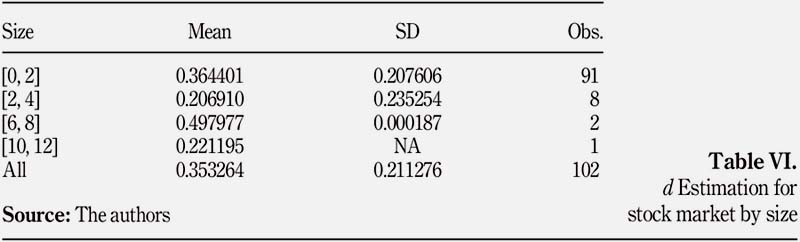
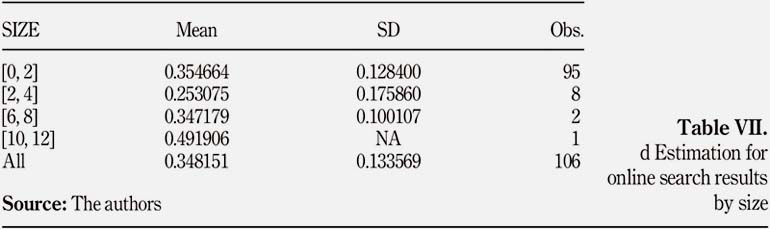
Both stock prices and online search trends, the bigger the firm, the closer the value of d estimation to 0.5 (Table VI and VII ).
5. Conclusion
In this paper, an initial exploration on the value of d for ARFIMA(p, d, q; P, Q) processes is attempted, using both stock market prices and online search trends, trying to capture the behavior of, respectively, both shareholders in particular and stakeholders in general. Results are initially scrutinized by country, sub-sector and other potential relevant explanatory factors, like size of the corresponding firm, and significant impacts of these factors on the estimation of d were found. These estimations of d are initially consistent with long memory, which suggests that both stock market prices and online search trends deserve further exploration for modeling and forecasting. A significant coherence with previous results of Ikeda (2017) seems to appear, leading to a stronger connection between the study of financial markets and the research on online impact and presence. As long as corporations can effectively impact their online presence via corporate transparency, further research will be required to connect disclosure to online popularity to stock market behavior and to clarify the causality between these phenomena.
References
Abraham-Frois, G. (1998), "Non-linear dynamics and endogenous cycles", Vol. 463, Springer Science and Business Media. [ Links ]
Acuña-Opazo, C. and Álvarez-Marín, A. (2017), "Dependencia serial de largo plazo en el índice bursátil chileno, a través del coeficiente de hurst y hurst ajustado", Journal of Economics, Finance and Administrative Science, Vol. 22 No. 42, pp. 37-50. [ Links ]
Barber, B.M. and Odean, T. (2007), "All that glitters: the effect of attention and news on the buying behavior of individual and institutional investors", Review of Financial Studies, Vol. 21 No. 2, pp. 785-818.
Barnett, [ Links ] W.A. and Serletis, A. (2000), "Martingales, nonlinearity, and chaos", Journal of Economic Dynamics and Control, Vol. 24 Nos 5/7, pp. 703-724. [ Links ]
Box, G.E. and Jenkins, G.M. (1976), Time Series Models for Forecasting and Control, San Francisco. [ Links ]
Choi, H. and Varian, H. (2012), "Predicting the present with Google Trends", Economic Record, Vol. 88 No. s1, pp. 2-9.
Doornik, [ Links ] J.A. and Ooms, M. (2003), "Computational aspects of maximum likelihood estimation of autoregressive fractionally integrated moving average models", Computational Statistics and Data Analysis, Vol. 42 No. 3, pp. 333-348.
Fama, [ Links ] E.F. (1963), "Mandelbrot and the stable Paretian hypothesis", The Journal of Business, Vol. 36 No. 4, pp. 420-429. [ Links ]
Fama, E.F. (1970), "Efficient capital markets: a review of theory and empirical work", Journal of Finance, Vol. 25 No. 2, pp. 383-417. [ Links ]
Flores-Muñoz, F., Báez-García, A. and Guriérrez-Barroso, J. (2018), "Predictability and self-similarity in demand maturity of tourist destinations: the case of Tenerife", Cuadernos de Economía, in press. [ Links ]
Glen, P.J. (2005), "The efficient capital market hypothesis, chaos theory, and the insider filing requirements of the securities exchange act of 1934: the predictive power of form 4 filings", Fordham Journal of Corporate and Financial Law, Vol. 11 No. 1, pp. 85-114.
Granger, [ Links ] C.W. and Joyeux, R. (1980), Journal of Time Series Analysis, Vol. 1 No. 1, pp. 15-29.
Hart, [ Links ] O. (1995), "Corporate governance: some theory and implications", The Economic Journal, Vol. 105 No. 430, pp. 678-689. [ Links ]
Hurst, H.E. (1951), "Long-term storage capacity of reservoirs", Transactions of the American Society of Civil Engineers, Vol. 5 No. 5, pp. 770-799. [ Links ]
Ikeda, T. (2017), "A fractal analysis of world stock markets", Economics Bulletin, Vol. 37, pp. 1514-1532. [ Links ]
Lo, A.W. (2005), "Reconciling efficient markets with behavioral finance: the adaptive markets hypothesis", Journal of Investment Consulting, Vol. 7 No. 2, pp. 21-44. [ Links ]
Lorenz, E.N. (1963), "Deterministic non-periodic low", Journal of the Atmospheric Sciences, Vol. 20 No. 2, pp. 130-141.
Mandelbrot, [ Links ] B.B. (1983), The Fractal Geometry of Nature/Revised and Enlarged Edition, WH Freeman and Co., New York, NY.
Mouck, [ Links ] T. (1998), "Capital markets research and real world complexity: the emerging challenge of chaos theory", Accounting, Organizations and Society, Vol. 23 No. 2, pp. 189-215. [ Links ]
Panas, E. (2001), "Estimating fractal dimension using stable distributions and exploring long memory through ARFIMA models in Athens Stock Exchange", Applied Financial Economics, Vol. 11 No. 4, pp. 395-402. [ Links ]
Peters, E.E. (1994), "Fractal Market Analysis: Applying Chaos Theory to Investment and Economics", Vol. 24, John Wiley and Sons. [ Links ]
Preis, T., Moat, H.S., and Stanley, H.E. (2013), "Quantifying trading behavior in financial markets using Google Trends", Scientific Reports 3, Nature.com. [ Links ]
Sowell, F. (1992), "Maximum likelihood estimation of stationary univariate fractionally integrated time series models", Journal of Econometrics, Vol. 53 Nos 1/3, pp. 165-188. [ Links ]
Further reading
Graves, T., Gramacy, R., Watkins, N. and Franzke, C. (2017), "A brief history of long memory: Hurst, Mandelbrot and the road to ARFIMA, 1951-1980", Entropy, Vol. 19 No. 9, p. 437.
Appendix
ARFIMA (p; d; q)
If yt is not stationary, it needs to be differentiated d times. d is allowed to be a fractional number.
Citation:
Flores-Muñoz, F., Báez-García, A. and Gutiérrez-Barroso, J. (2019), "Fractional differencing in stock market price and online presence of global tourist corporations", Journal of Economics, Finance and Administrative Science, Vol. 24 No. 48, pp. 194-204. https://doi.org/10.1108/JEFAS-01-2018-0013
Received: 23 January 2018
Accepted: 19 June 2018

