


Servicios Personalizados
Revista

Articulo
 Inglés (pdf)
 Articulo en XML
 Referencias del artículo
 Enviar articulo por email
Indicadores
-
 Citado por SciELO
Links relacionados
-
 Similares en
SciELO
Similares en
SciELO
Compartir

 Permalink
Journal of Economics, Finance and Administrative Science
versión impresa ISSN 2077-1886
Journal of Economics, Finance and Administrative Science vol.24 no.48 Lima jul./dic. 2019
http://dx.doi.org/https://doi.org/10.1108/JEFAS-09-2018-0088
ARTICLE
Seasonal anomalies in the market for American depository receipts
Júlio Lobão1,*
1Faculdade de Economia, Universidade do Porto, Porto, Portugal
Corresponding author: *jlobao@fep.up.pt
Abstract
Purpose: The literature provides extensive evidence for seasonality in stock market returns, but is almost non-existent concerning the potential seasonality in American depository receipts (ADRs). To fill this gap, this paper aims to examine a number of seasonal effects in the market for ADRs.
Design/methodology/approach: The paper examines four ADRs for the period from April 1999 to March 2017 to look for signs of eight important seasonal anomalies. The authors follow the standard methodology of using dummy variables for the time period of interest to capture excess returns. For comparison, the same analysis on two US stock market indices is conducted.
Findings: The results show the presence of a highly significant pre-holiday effect in all return series, which does not seem to be justified by risk. Moreover, turn-of-the-month effects, monthly effects and day-of-the-week effects were detected in some of the ADRs. The seasonality patterns under analysis tended to be stronger in emerging market-based ADRs.
Research limitations/implications: Overall, the results show that significant seasonal patterns were present in the price dynamics of ADRs. Moreover, the findings lend support to the idea that emerging markets are less efficient than developed stock markets.
Originality/value: This is the most comprehensive study to date for indication of seasonal anomalies in the market for ADRs. The authors use an extensive sample that includes recent significant financial events such as the 2007/2008 financial crisis and consider ADRs with different characteristics, which allows to draw comparisons between the differential price dynamics arising in developed market-based ADRs and in the ADRs whose underlying securities are traded in emerging markets.
Keyword: Emerging markets, American depository receipts, Seasonal anomalies, Market efficiency, Developed markets
1. Introduction
American depository receipts (ADRs) programs have been expanding during the past decades at a remarkable pace. Over the 2014-2016 period alone, 327 new programs were established. According to the Bank of New York Mellon, there are now almost 3,500 ADR programs worth US$152.1bn. In 2016, the combined trading value of listed depositary receipts on US exchanges totaled a staggering figure of US$2.9tn.
An ADR is a negotiable certificate that represents ownership of the securities of a non-US resident company. ADR plays an important role in the global financial markets as it allows investors to diversify their portfolios internationally. Moreover, they constitute one of the most cost-effective and convenient tools for cross-border investing and bring for investors the advantages of liquidity, transparency and ease of trading of shares in US markets of companies located in developed and emerging markets. ADRs also present significant advantages for non-US resident companies because they allow them to introduce its equity in the US market in a form more readily acceptable to US investors.
Given the economic significance of ADR programs, it is surprising that so little attention has been paid in the literature to the price dynamics in this market. Finding any systematic pattern in the behavior of ADRs is an important matter in financial economics. However, to the best of our knowledge, only one study by Bouges et al. (2009) addressed the topic of seasonality in ADR prices.
Seasonal anomalies refer to the tendency of financial asset returns to display systematic patterns at certain times of the day, week, month or year. For example, one of the best wellknown stock market anomalies is the January effect (Rozeff and Kinney, 1976; Haugen and Jorion, 1996), which occurs when stock returns in January are significantly higher than returns in the remaining months of the year. The existence of seasonal effects may be problematic to the efficient market hypothesis as they might be taken to imply that investors could develop trading strategies which generate systematic abnormal profits based on such patterns. Moreover, the finding of particular anomalies cast a considerable amount of doubt on the existing asset pricing models, thus suggesting that new, alternative, market equilibrium models are needed.
This paper studies the informational efficiency of ADRs through the examination of eight seasonal patterns in this market:
(1) The month-of-the-year effect.
(2) The quarter-of-the-year effect.
(3) The half-of-the-year effect.
(4) The Halloween effect.
(5) The day-of-the-week effect.
(6) The half-of-the-month effect.
(7) The turn-of-the-year effect.
(8) The pre-holiday effect.
We expand the pioneering contribution of Bouges et al. (2009) in several important directions. First, we triple the sample size of that study by examining 18 years of data instead of the 6 years considered by the authors. Our sample period thus includes recent significant financial events such as the 2007/2008 financial crisis, which may have altered the dynamics of the market prices under scrutiny. Moreover, having a larger sample is important as it will likely lead to more robust results, i.e. results less sensitive to periodspecific features in the data. Second, we examine the price seasonality in four different ADRs and not only in the S&P ADR as in Bouges et al. (2009). The inclusion of ADRs with different characteristics is important in that it allows us to draw comparisons between the differential price dynamics arising in developed market-based ADRs and in those ADRs whose underlying securities are traded in emerging markets. Third, we are the first to test in the ADR market the existence of seasonality patterns in the different quarters and semesters of the year, as well as the anomalies identified in the literature as the Halloween effect (Bouman and Jacobsen, 2002; Jacobsen and Visaltanachoti, 2009) and the half-of-the-month effect (Ariel, 1987; Mills and Coutts, 1995). We also test for the first time whether pre-holiday effects in ADRs vary significantly according to the holiday under consideration. Given the scarcity of studies on seasonality patterns in the market for ADRs, the purpose of this article is primarily to document the existence of such effects and not to provide explanations as to why these anomalies may occur.
We report three main findings. First, our results reveal the existence of a strong preholiday effect. The pre-holiday effect was detected in all ADRs, it is highly significant and is concentrated on the trading sessions that took place immediately before the Good Friday, the Labour Day and the Christmas Day. Second, there are moderate signs of the turn-of-themonth effect. Also, in some of the ADRs under analysis, the returns observed seem to have been significantly higher on Thursdays and in the months of April and December. Third, in general, the anomalies examined tend to be stronger on emerging market-based ADRs. This result is pertinent in the context of the ongoing debate between the authors who argue that developed markets are more efficient (Bekaert and Harvey, 2003) and those who maintain that emerging markets are at least as efficient as developed markets (Griffin et al., 2010). The evidence obtained in the present study clearly supports the position of the former group of academics.
The remainder of this study is organized as follows. Section 2 reviews the empirical evidence regarding financial market anomalies. Section 3 presents the data and the methodologies used in this paper. Section 4 displays the empirical results. Section 5 offers conclusions.
2. Literature review
In the present paper we study a number of seasonality patterns. The literature review that follows focuses on the seminal contributions and on those that deal with the issue at hand mainly in developed stock markets.
2.1 Monthly effects
Rozeff and Kinney (1976) were among the first to document the existence of monthly seasonality patterns. The phenomenon was studied in an index of shares of the New York Stock Exchange (NYSE) for the 1904-1974 period. The authors concluded that January presented significantly higher returns (3.48 per cent on average compared to 0.42 per cent in the remaining months of the year).
However, some scholars are skeptical about the significance of this January effect on today’s markets. For example, Fountas and Segredakis (2002) examined 18 emerging markets in the 1987-1996 period. Although they have found significant seasonal effects, the authors point out the lack of evidence for the January effect. Similarly, Marquering et al. (2006) note that the signs of such effect faded following the publication of Rozeff and Kinney’s (1976) paper. Despite these results, the evidence presented by other authors point toward the persistence of the January effect at the present. For example, Haugen and Jorion (1996) found that the returns in the first month of the year in the USA remained strong in the 1977-93 period, with an excess of profitability in January of 2.9 per cent on average. More recently, Haugen and Hirschey (2006) examined data from the 1802-2004 period to show that the effect persists until the last years of the sample. Easterday et al. (2009, p. 1192) conclude their study with the following sentence: "We show that the January effect persists over a long period (1946-2007) and find no evidence that January premiums are declining as would be predicted in an efficient market."
2.2 Halloween effect
In their seminal article, Bouman and Jacobsen (2002) analyzed 37 major stock markets from January 1970 through August 1998. They found that the returns were significantly higher during the winter months (November-April) than during the remainder of the year (May-October) in 36 of those markets. The authors concluded that this Halloween effect was difficult to reconcile with the efficient market paradigm. In a later paper, Jacobsen and Visaltanachoti (2009) and Haggard and Witte (2010) studied the Halloween effect in detail in the USA, showing that it differs from the January effect, being also unrelated to the behavior of portfolios formed on the criteria of liquidity or beta.
However, Lucey and Zhao (2008) disagreed about the significance of the phenomenon. They re-examined the effect in the US market in the 1926-2008 period and concluded that the Halloween effect can be a reflection of the January anomaly and that may not be present in US equities in the long term. Dichtl and Drobetz (2014) studied the Halloween anomaly in five indices (S&P 500, euro Stoxx 50, Dax 30, CAC 40, and FTSE 100) in samples ending in December 2012 to show the Halloween effect decreased or virtually vanished in the last years under scrutiny.
The debate continues today. For example, Andrade et al. (2013) report that in an out-ofsample period (1998-2012), all countries contained in the Bouman and Jacobsen (2002) study still performed better in November-April than during the rest of the year. Jacobsen and Zhang (2014) expanded the sample of Bouman and Jacobsen (2002) to include data from 109 countries. They report that the effect is pervasive around the world, it persists out-of-sample and in fact has been increasing in strength in recent years. Finally, on a related study, Dzhabarov et al. (2018) show that Halloween strategies exhibited a strong outperformance in international equity futures markets other than the USA. Furthermore, the authors document that the profitability of those strategies continues to be present following the recent increased publicity around them.
2.3 Day-of-the-week effect
One of the most commonly investigated seasonal pattern is the difference in returns across the days of the week. Since French (1980) originally observed that stock returns in the USA are higher than average on Fridays and lower than average on Mondays, many researchers have attempted to test what has come to be known as the day-of-the-week effect. For example, Jaffe and Westerfield (1985) found significantly negative mean returns on Mondays and significantly positive mean returns on Fridays in Australia, Canada, Japan and the UK stock markets. Agrawal and Tandon (1994) documented large, positive mean returns on Fridays and Wednesdays and lower or even negative mean returns on Mondays and Tuesdays in most of the eighteen markets (both developed and emerging) under analysis. Dubois and Louvet (1996) re-examined the day-of-the-week effect for eleven indexes from nine countries during the 1969-1992 period, finding negative returns on Mondays, which were compensated by abnormal positive returns on Wednesdays.
However, some studies show that the day-of-the-week effect has weakened in some of the developed markets. For example, Chang et al. (1993) studied 23 markets to conclude that the US day-of-the-week effects were statistically insignificant. However, it was found that five European markets (France, Italy, The Netherlands, Spain and Sweden) were still negative on average on Mondays. Also, Kohers et al. (2004) analyzed the differences in the distribution of stock returns for each day of the week in the world’s largest developed equity markets over a 22 year-period. The results indicate that, during the 1980s, the day-of-the-week effect was clear in the vast majority of the developed markets, but it appears to have faded away starting in the 1990s.
The debate persists today. In fact, Dicle and Levendis (2014) recently conducted a worldwide study covering 51 markets in 33 countries for the 2000-2007 period. Their results reveal that the day-of-the-week effect persists for a significant proportion of equity markets and for a significant fraction of individual stocks in almost all the markets included in the study. Finally, Zhang et al. (2017) used the method of rolling sample tests and the GARCH model to investigate the stock returns of main indices in 28 markets from 25 countries in the 1990-2016 period. The authors detected significant day-of-the-week effects in all the countries of the sample.
2.4 Half-of-the-month effect
Ariel (1987) examined the pattern of returns within months. He found an intriguing result: in the 19 years of data from 1963 through 1981, the returns in the first half of each month were significantly higher than the ones observed in the latter half. In fact, the mean return observed in the second part of each month was negative, that is, all the returns for the period occurred in the first part of the month. This half-of-the-month effect was found to be independent from other known calendar anomalies such as the January effect.
Lakonishok and Smidt (1988) investigated this same issue using 90 years of data finding only mild support to the half-of-the-month effect. The returns observed in the first fortnight of each month continued to be higher, but they found the difference in the two halves of the month to be much less significant than the one reported by Ariel (1987). Furthermore, the average rate of return was positive for both halves of the month.
Jaffe and Westerfield (1989) examined the anomaly in four other countries, finding a similar pattern in Australia, the reverse effect in Japan and not much evidence of any effect in Canada and in the UK. Conversely, Ziemba (1991) used a larger sample to confirm that the effect was still present in the Japanese stock market.
Wang et al. (1997) showed that the anomaly existed in the USA, but that it interacts with a weekly seasonal effect: the difference between the mean returns of the first-half of the month and the second-half of the month turns out not be significantly different from zero when Monday returns are excluded. In this regard, Rosenberg (2004) found conflicting results. Using a larger sample, this author concluded that stock returns in the last-half of the month are consistently lower than in the first-half of the month and that this finding could not be explained by returns on Mondays.
More recently, the research about the persistence of the anomaly has resurfaced. Marquering et al. (2006) found that the trend of this seasonal anomaly is substantially diminished, having started to decline earlier than the year when the effect was first described by Ariel (1987). Giovanis (2009) confirmed this assertion in a study on 55 stock market exchange indices of 51 countries. Finally, Siegel (2014) analyzed a large sample of US data to conclude that the effect firstly detected by Ariel (1987) is severely attenuated today. In fact, over the entire period under study (1885-2012), the mean return in the first half of the month was almost seven times the gain that took place during the second half. However, the returns of both halves of the month in the 1995-2012 sub-period were almost the same.
2.5 Turn-of-the-month effect
Lakonishok and Smidt (1988) appear to have been the first to detect a turn-of-the-month effect in stock returns, with the turn of the month beginning on the last trading day of the month and ending on the third trading day of the following month. Using the Dow Jones index, they found that only those four days accounted for all the positive return of the index in the 1897-1986 period. Wilson and Jones (1993) examined four US indices in the 1973-1991 period concluding that the effect was present in only two of those indices.
The international evidence suggests that the turn-of-the-month effect is not a US-only phenomenon. For example, Cadsby and Ratner (1992) analyzed 10 countries and found a significant turn-of-the-month effect in Canada, the UK, Australia, Switzerland and Germany. Agrawal and Tandon (1994), who studied stock market return patterns in 18 countries, found the presence of the turn-of-the-month effect in 11 of these countries in the 1970s but in only seven in the decade of the 1980s. Kunkel et al. (2003) studied major stock market indices of 19 countries for the 1988-2000 period and concluded that the effect was still thriving in 15 of those countries.
More recently, McConnell and Xu (2008) extended Lakonishok and Smidt’s (1988) study to include data up to 2005 for the Dow Jones index finding that the anomaly still existed in 31 of the 35 countries under scrutiny. Zwergel (2010) also found the anomaly in four wellknown indices (DAX, Nikkei 225, FTSE 100, S&P 500) and documented that an out-ofsample trading strategy based on the effect could be profitable in the corresponding future markets. Khaled and Keef (2012) examined the effect in 50 international stock indices during the 1994–2006 period finding significant evidence of it even after controlling for certain factors. Sharma and Narayan (2014) investigated the turn-of-the-month anomaly on 560 firms listed on the NYSE to conclude that the effects were different for different firms dependent on the sectoral location of firms and on firm sizes. Finally, Urquhart and McGroarty (2014) analyzed US data from 1900-2013 and showed that the anomaly existed under all market conditions during that period, although it was more intense during bear markets and market crashes.
2.6 Pre-holiday effect
Lakonishok and Smidt (1988), Ariel (1990) and Kim and Park (1994) introduced the preholiday effect in the scientific literature. Lakonishok and Smidt (1988) compared pre-holidays to regular days using the Dow Jones index. They found the average return for pre-holidays was 23 times as large as the regular day rate of return. Also, Ariel (1990) documented that the average pre-holiday return in the USA over the 1963-1982 period was nine to 14 times higher than the mean return on the remaining days. Kim and Park (1994) used the NYSE, the AMEX Composite Index and the NASDAQ to show that the pre-holiday returns were 9.0, 27.0 and 10.9 times as large as other days for those three markets, respectively. Moreover, they found that the effect was also observed in the markets of the UK and Japan. All these studies indicate that this pre-holiday effect is not a manifestation of other seasonal anomaly such as the day-of-the-week effect or the January effect.
There is also a substantial amount of international evidence. For example, Cadsby and Ratner (1992) found a significant pre-holiday effect in Canada, Japan, Hong Kong and Australia. However, they did not find any significant effect in several European markets. Mills and Coutts (1995) confirmed the existence of the anomaly in the UK for the 1986-1992 period.
More recently, Chong et al. (2005) considered data up to 2003 for the USA, the UK and Hong Kong stock markets. The authors showed that the effect had declined for all the three markets, but only significantly in the US. Keef and Roush (2005) re-examined the US market in the 1930-1999 period and concluded that there was a strong pre-holiday effect up to 1987, and that the anomaly significantly diminished after that date. Finally, these results were corroborated by Dzhabarov and Ziemba (2017) who concluded that in the 1993-2009 period the seasonal effect was only marginally positive in the USA.
As mentioned earlier, Bouges et al. (2009) is the only study we know of on the existence of seasonal anomalies in the ADR market. They used six years of data to investigate the presence of the day-of-the-week effect, the January effect, the turn-of-the-month effect and the pre-holiday effect in their sample. From all these anomalies, they only found evidence that the turn-of-the-month effect was present in the market for ADRs.
3. Data and methodology
We use four ADRs (S&P ADR, BNY Mellon ADR Index, BNY Mellon Developed Markets 100 ADR Index and BNY Mellon Emerging Markets 50 ADR Index) to study the presence of seasonal anomalies in this market. To make the analysis comparable to the US market, we also conduct an analysis on the S&P 500 index and on the NYSE ARCA International Index. A brief discussion of the indices is as follows:
-
S&P ADR Index: The S&P ADR index is based on the non-US stocks comprising the S&P Global 1200. The S&P Global 1200 is made up by the S&P 500 for the US and five non-US indices: S&P Europe 350, S&P/TOPIX 150 (Japan), S&P/TSX 60 (Canada), S&P Asia Pacific 100 and S&P Latin America 40. As not all foreign firms offer ADR programs, the S&P ADR index is comprised of those firms from the S&P Global 1200 that offer either Level II ADRs, Level III ADRs, global shares or ordinary shares in the case of Canadian equities[1]. The S&P ADR index is marketcap weighted with all pricing and valuation taken from the US exchange with the primary listing.
-
BNY Mellon ADR Index: The BNY Mellon ADR Index tracks all ADR traded on the NYSE, NYSE MKT and NASDAQ. As of December 19, 2017, this index had 322 constituents with a mean total market capitalization of US$23,371m.
-
BNY Mellon Developed Markets 100 ADR Index: The BNY Mellon Developed Markets 100 ADR Index tracks approximately 100 ADRs which underlying securities trade on developed markets. As of December 19, 2017, the index comprised 85 constituents from Europe, Japan and Hong Kong with a mean total market capitalization of US$56,865m.
-
BNY Mellon Emerging Markets 50 ADR Index: The BNY Mellon Emerging Markets 50 ADR Index tracks roughly 50 emerging market-based ADRs. As of December 19, 2017, it included 50 constituents with a mean total market capitalization of US $42,922m. The securities traded on China, Brazil and Taiwan markets accounted for about three-quarters of the capitalization captured by the index.
-
S&P 500 index: The S&P 500 Index comprises 500 companies selected by the S&P index Committee. Market size, industry representation and liquidity are the main factors guiding the selection of companies. The companies tend to be broadly traded and relatively stable. The index is designed to reflect the structure of the US economy.
-
NYSE ARCA International Index: The NYSE ARCA International Index measures the price performance of 50 leading blue-chips foreign stocks which actively trade in the US either directly in the form of common stock or in the form of ADRs on the NYSE, NYSE MKT and NASDAQ. The index started in 1996 (it was then called AMEX International Market). Constituent shares include mainly the leading companies in the European Union, Australia and Japan that were selected because of their capitalization and trading activity.
All the indices are market capitalization-weighted and are calculated on a continuous basis throughout the US trading session.
The indices were obtained from Datastream on a daily close-to-close basis for the period from April 5, 1999, to March 3, 2017. Returns for each index were computed as:
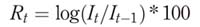
where Rt stands for the log return of the index on date t; and It and It-1 are closing values on day t and t-1 for that same index.
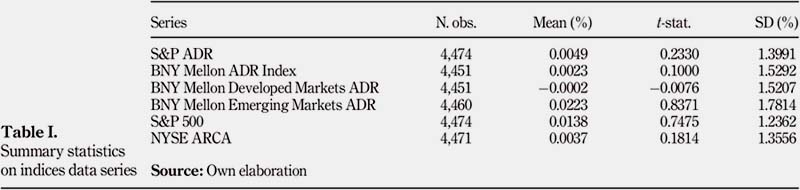
Summary statistics on the index’s returns are presented in Table I. All the mean returns are insignificant at the conventional levels, with a narrow range of 0.0002 per cent (BNY Mellon Developed Markets ADR Index) to 0.0223 per cent (BNY Mellon Emerging Markets ADR Index). The BNY Mellon Emerging Markets ADR Index presents the highest average return and the highest standard deviation of all the indices of the sample. There is no pattern in the asymmetry of the return distributions.
We follow the standard methodology of using dummy variables for the time period of interest to capture the excess return (Wilson and Jones, 1993; Mehdian and Perry, 2001; Galai et al., 2008; Darrat et al., 2011). Daily returns on the subject index for the period of the sample are regressed on a series of dummy variables that stand for the excess average daily return during the time period they represent. The regressions were computed following the standard ordinary least squares methodology with Newey and West (1987) heteroskedasticity and autocorrelation adjusted standard deviations.
For example, the month-of-the-year effect posits that the returns in some months of the year will be significantly higher than in any other month. Thus, monthly dummy variables (D2t – D12t) were created and the anomaly was tested using the following equation:

where Rt equals the log return of the index on date t; D2t , ...,D12tequals 1 if the trading day falls in the months of February, March, ..., December, respectively, and 0 otherwise; et is the error term. In this model the estimates of (a1 – a11) capture the excess average daily return during the months of February-December, and the constant (a0) represents the excess average daily return during January.
4. Empirical results
4.1 Regression results
Table II shows the model estimates for monthly seasonality. The evidence suggests that the January effect did not exist neither on the market for ADRs nor on the stock market indices chosen as benchmark. In fact, the constant which captures the average daily return in the first month of the year is negative in all cases, although it is not significant at the conventional levels. The absence of the January effect in ADRs confirms the evidence presented by Bouges et al. (2009) and lends support to those authors that argue that the effect has disappeared (Marquering et al., 2006). The coefficients on the months of February, March, June, August and October are positive and insignificant at the 10 per cent level for all the series. There are only two statistically significant monthly effects, although they do not occur in all data series under analysis. First, there appears to be an April effect characterized by a higher mean daily return of 21 basis points (bp) in the S&P ADR index (significant at the 5 per cent level) and in the two stock market indices. This anomaly is similar to that found by Gultekin and Gultekin (1983) in the UK market and which the authors attributed to the fact that the deadline for companies to announce their annual reports is in March in many countries (tax-loss selling hypothesis). Second, December also appears to be a month with higher mean daily returns (of about 18 bp) in the S&P ADR index although in this case the coefficient is only significant at the 10 per cent level. Again, a similar effect was observed in the NYSE ARCA. The higher return in December has been found in the literature to be especially significant among large winner firms and is also usually considered to be a taxrelated phenomenon (Singal, 2003; Darrat et al., 2011).
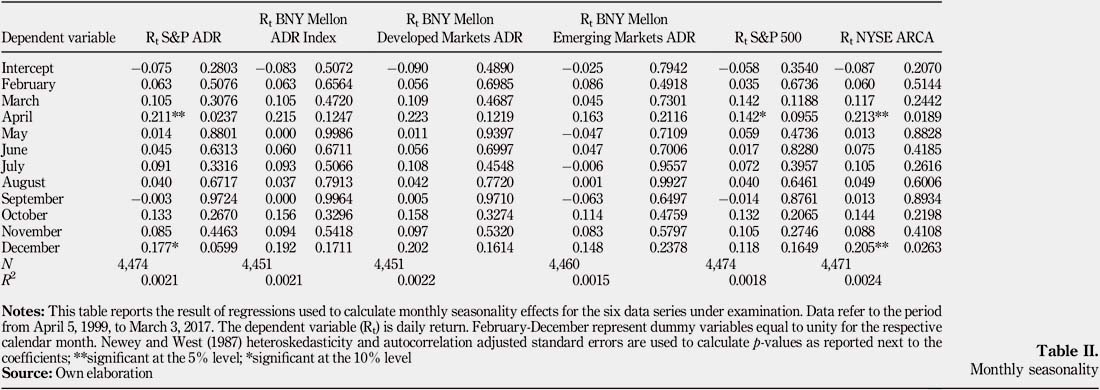
Table III and IV display the results regarding quarterly and half-year effects, respectively. We find that none of the coefficients is statistically significant at the conventional levels which indicates that the returns in a given quarter or semester are not statistically distinguishable from those observed at any other quarter or semester.
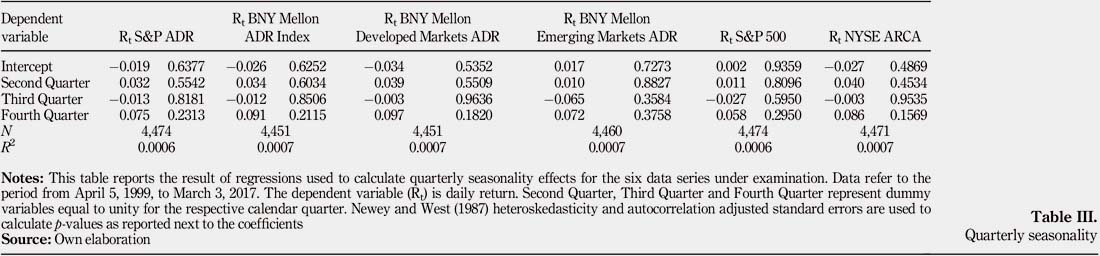
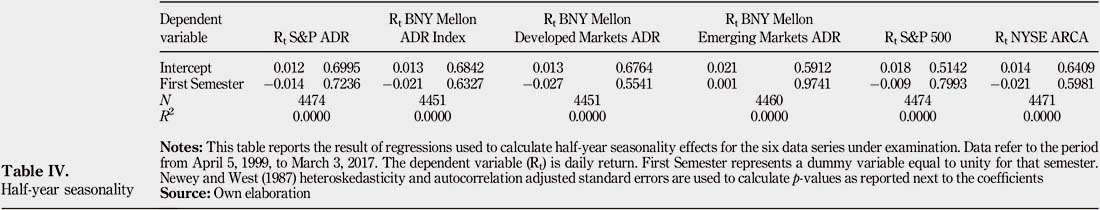
Table V shows the regression results for the Halloween effect. The coefficient that captures the anomaly is positive for all the series which indicates that the mean daily returns tended to be higher (between 4 and 8 bp) during the winter months (NovemberApril) as predicted by the Halloween effect. However, this difference is not statistically significant at the conventional levels. This goes in accordance with previous studies such as Dichtl and Drobetz (2014) who defend that the anomaly is no longer significant.
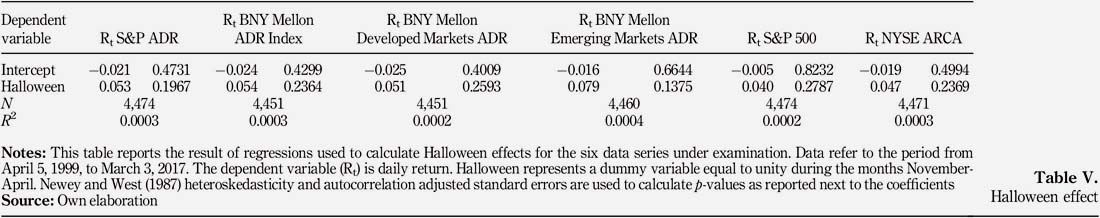
Table VI contains the results for the day-of-the-week effect. The intercept shows the average daily return that was earned on Mondays. This coefficient is the only one that is negative for all series under examination, suggesting that Monday returns tended to be the lowest of any day of the week. However, the difference is only statistically significant at the 10 per cent level in the ADR that covers the evolution of emerging markets, that is, the BNY Mellon Emerging Markets ADR index. Bouges et al. (2009), in their analysis of the S&P 500 ADR, found a similar result, that is, a negative but insignificant coefficient. This difference in the weekly behavior of the ADR indices highlights the need to study the performance of indicators that represent markets from different geographies and with different institutional features.
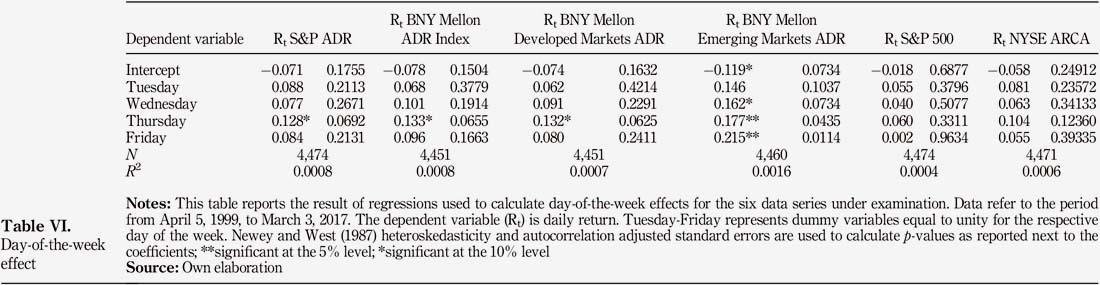
The coefficient that represents returns on Tuesdays is positive for all series but insignificant at the conventional levels. In the case of Wednesdays and Fridays, profitability tends to be higher in all indexes but, again, the effect is only statistically significant for the BNY Mellon Emerging Markets ADR. Returns on Thursdays were significantly higher at the 10 per cent level in all ADR indices under examination. The anomaly has a magnitude of 12 bp to 18 bp in the daily mean returns and is again more significant in ADRs whose underlying assets are traded in emerging markets.
Collectively, this evidence suggests that there were mildly significant day-of-the-week effects for ADRs in general, and for the BNY Mellon Emerging Markets ADR index, during the time period under test.
Table VII displays the results for the half-of-the-month effect. The constant shows the average daily return that was earned during the second semester of each year. Thus, the negative value observed in this constant in all data series implies that, contrary to what one usually finds in the literature about this topic, average daily returns tended to be higher in the second half of each month. However, the difference is not statistically significant at the 10 per cent level. This evidence gives credence to authors such as Siegel (2014), who claims that the half-month effect is no longer significant.
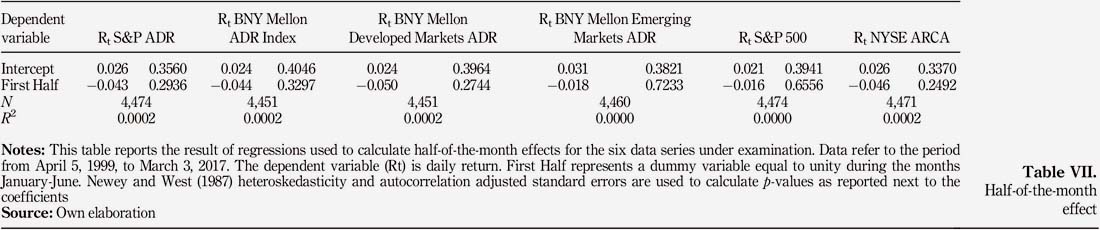
Table VIII contains the regression results for the turn-of-the-month effect. The variable TOTM is the dummy variable for the turn-of-the-month trading days covering the last and the first three trading days of the month. The constant is the average daily return earned on trading days other than the last and the first three days of the month. The constant is negative in all cases except for the S&P500 stock index. In any case, the coefficient is not statistically significant at the level of 10 per cent for any of the six indices under examination which implies that the returns earned on non-turn-of-the-month trading days were insignificantly different from zero. However, TOTM is positive and statistically significant at the 10 per cent level for four of the indices (S&P ADR, BNY Mellon Index ADR, BNY Mellon Emerging Markets ADR and NYSE ARCA). The effect has a magnitude of about 10 bp in the mean daily returns of the BNY Mellon Index ADR and NYSE ARCA indices, being only statistically significant at the 10 per cent level. The S&P ADR index presents an effect of 11.5 bp (statistically significant at the 5 per cent level), which is about half of that detected by Bouges et al. (2009). The turn-of-the-month effect is more pronounced in the BNY Mellon Emerging Markets index, with a magnitude of about 20 bp in the mean daily returns, being statistically significant at the 1 per cent level.
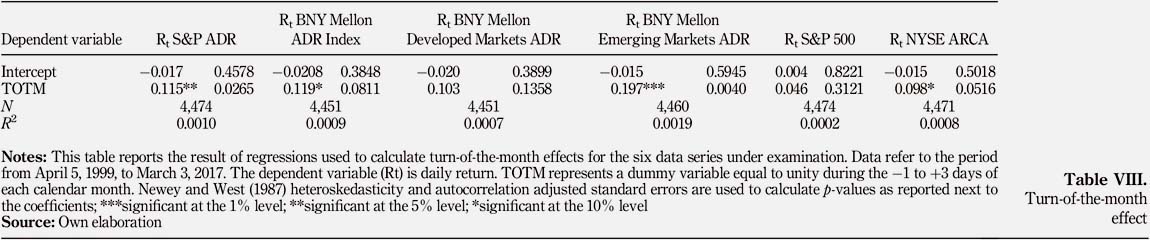
Overall, these results provide evidence of a turn-of-the-month effect in most ADR indices. The implication is that investors could have earned higher returns by trading at the turn-ofthe month in ADRs, which runs counter to the efficient market hypothesis.
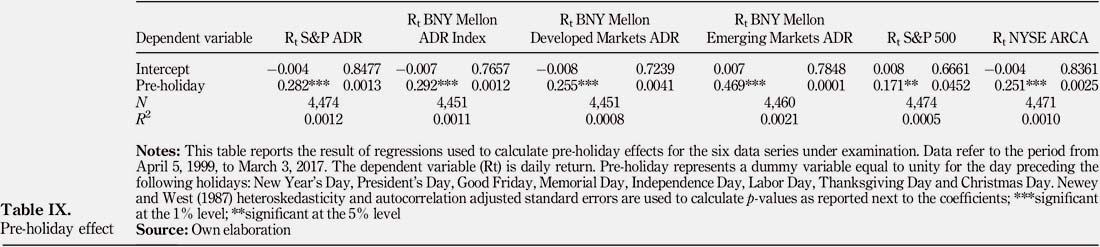
Table IX shows the results for the pre-holiday effect. The variable "Pre-holiday" is a dummy variable that captures the daily returns earned on each index in the trading sessions immediately preceding eight US holidays (New Year’s Day, President’s Day, Good Friday, Memorial Day, Independence Day, Labour Day, Thanksgiving Day and Christmas Day). The constant term is the average daily return observed on non-pre-holiday trading days. For all the series under examination the intercept is statistically insignificant at the conventional levels. However, the coefficient of the pre-holiday variable is positive and statistically significant at the 1 per cent level for all indices except the S&P 500 stock index (only significant at the 5 per cent level). Except for the S&P 500 stock index, the pre-holiday effect represents an impact of at least 25 bp on average daily returns. Once again, the anomaly is especially pronounced in the case of the BNY Mellon Emerging Markets ADR index representing an average excess return around 47 bp. This evidence clearly contradicts the results presented by Bouges et al. (2009) and suggests that an investor could have exploited this pattern in prices trading ADRs in the days immediately preceding holidays.
Having found that the ADR markets exhibit a strong pre-holiday effect, it is of interest to test whether there are significant differences between the holidays considered in the sample. Thus, we ran a regression in which each of the holidays is represented by a different dummy variable. Results of the estimates of this regression are shown in Table X.
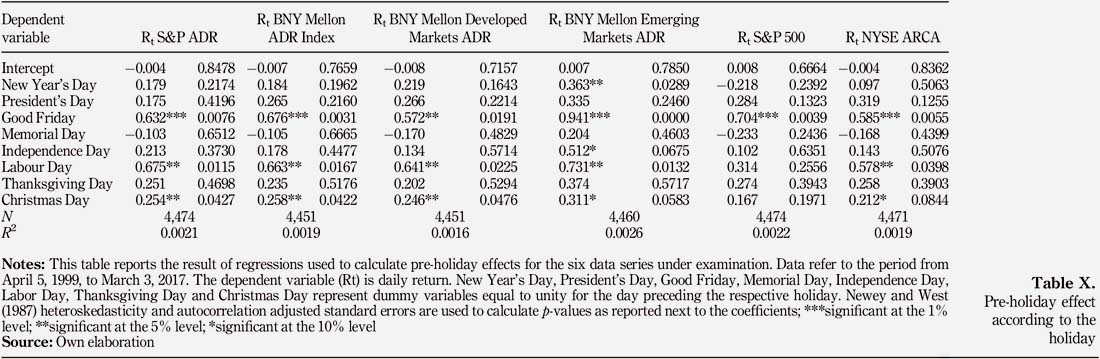
Results clearly indicate that not every holiday has the same impact on average daily returns. It is worth noting that most days preceding holidays have a positive effect on returns. The exception lies in the days that precede the Memorial Day which have a negative impact on the markets, though not statistically significant at the conventional levels. Of the eight holidays under consideration, there are three that stand out when it comes to the effect under study. These holidays are the Good Friday, the Labour Day and the Christmas Day. In the case of the trading days immediately preceding the Good Friday, the positive effect on average returns was observed in all indices and, except for BNY Mellon Developed Markets ADR, is statistically significance at the 1 per cent level. The size of the effect on that day was very expressive, being at least 57 bp and reaching a maximum of 94 bp in the case of the BNY Mellon Emerging Markets ADR. Returns on the days that preceded the Labour Day were also positive and statistically significant at the level of 5 per cent for all data series, except for the S&P 500 stock index. The average daily return in the five indices where the coefficients were significant ranged between 58 bp and 73 bp. In the case of the Christmas Eve, the returns obtained were lower but still significant at the level of at least 10 per cent for five indices of the sample (the S&P 500 stock index was the exception again). In this case, the average return on that day ranged from 21 bp to 31 bp in the five indices with statistically significant results.
An index by index analysis reveals that the pre-holiday effects on the BNY Mellon Emerging Markets ADR index were the strongest on every holiday under examination. In fact, in the case of the days leading up to New Year’s Day and Independence Day, this index was the only one that had statistically significant positive average returns.
In general, one can conclude that the pre-holiday anomaly was very significant in the market for ADRs. However, the effect was concentrated in the days immediately preceding the Good Friday, the Labour Day and the Christmas Day. These results suggest that an investor could have achieved higher returns if he had traded on the days immediately prior to a holiday in general, and especially so before one of those three holidays.
4.2 Risk as an explanation of seasonal anomalies
The existence of higher returns during the turn-of-the-month period and on the days that immediately precede holidays seem to be our main findings. A statistically significant and higher return was observed in these periods for most of the return series under analysis. This evidence seems to confirm the existence of these anomalies, as described in the literature.
But are these true anomalies? Or is it the case that these higher returns may solely represent a compensation for the additional risk that investors are bearing during those periods?
To analyze this question we computed the mean return and the risk (measured by the standard deviation) in the periods of interest. Table XI contains the values for return and risk during the turn-of-the-month period and on the remaining days. It is interesting to note that while returns differ considerably, the standard deviation in the two periods does not seem to vary so much.
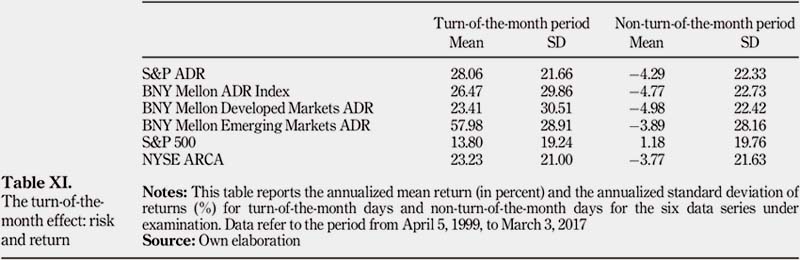
In the cases of the S&P ADR and NYSE ARCA, the higher return observed in the turn-ofthe-month does not appear to be a compensation for risk as the standard deviation was found to be lower in that period. Also, in the case of BNY Mellon Emerging Markets ADR, it seems unlikely that the difference in risk would justify the difference in returns: investors would have to require an additional risk of more than 60 per cent to compensate them for an increase in standard deviation of only 0.75 per cent. Among the cases where return differences were found to be significant, only in the case of the BNY Mellon ADR Index the risk during the turn-of-the-month period was substantially higher.
Table XII illustrates the mean return and risk in the pre-holiday days and in the remaining days.
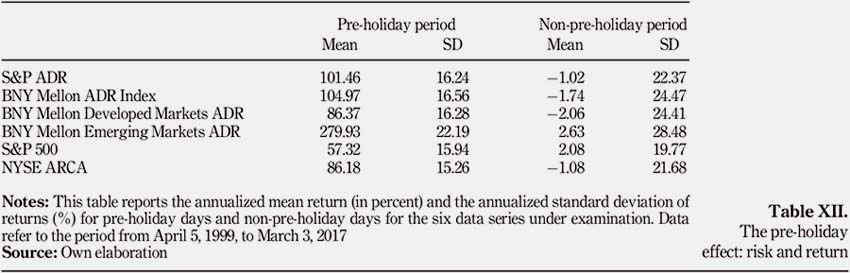
The higher returns observed in the pre-holiday days did not seem to have been a compensation for a higher risk in this period. The risk in the days that immediately preceded holidays was substantially lower than in the remaining trading sessions for all the return series under scrutiny. This suggests that the pre-holiday effect is a real anomaly.
5. Conclusions
While a considerable body of empirical evidence documents the impact of seasonal patterns on stock returns, the literature regarding the potential seasonality in ADRs is almost nonexistent. This paper contributes to fill this gap as it provides evidence about the existence of eight seasonal patterns in the market for ADRs for the period from April 1999 to March 2017.
Our results reveal the existence of a robust pre-holiday effect. This pre-holiday effect was detected in all ADRs, it is highly significant and is concentrated on the trading sessions that took place immediately before the Good Friday, the Labour Day and the Christmas Day. Except for the S&P 500 stock index, the pre-holiday effect presents an impact ranging from 25 to 47 bp on average daily returns. This result does not seem to be explained by risk and is at odds with the evidence presented by Bouges et al. (2009) as these authors did not detect any significant pre-holiday effect.
We also document moderate signs of the turn-of-the-month effect in three of the four ADRs under examination. Investors in those ADRs could have earned an extra 11-20 bp in daily returns by trading in the four days surrounding the end of the month. Also the returns observed in some of the ADRs seem to have been significantly higher on Thursdays and in the months of April and December.
We found no convincing evidence of the Halloween effect and of the half-of-the month effect. Furthermore, no significant quarterly patterns and half-year patterns were detected.
It is also noteworthy that in general the detected anomalies tended to be stronger on emerging market-based ADRs. This finding lends support to the authors that argue that emerging markets, being characterized as having lower levels of liquid and a smaller proportion of institutional investment, tend to be less efficient than developed markets (Bekaert and Harvey, 2003). Conversely, our results are difficult to reconcile with the perspective of those scholars that defend that emerging markets are at least as efficient as developed markets (Griffin et al., 2010).
As our statistical tests were performed on an independent sample covering several developed market-based ADRs and emerging market-based ADRs over an extended period, we consider it unlikely that our findings were significantly affected by data mining.
The results reported in this paper provide important implications for both academics and investors. Given the scarcity of empirical studies in the context of ADR markets, this study will result in a better understanding of returns in these markets. Moreover, the existence of anomalies tends to negate the notion of market efficiency as investors can earn abnormal returns just by examining patterns and setting strategies accordingly. The presence of seasonality in ADRs should appeal to a wide range of market participants, such as portfolio managers and individual investors, in their search for the best time to buy and sell ADRs. However, given the historical trading costs that individual investors have been bearing (Barber and Odean, 2000) it may be difficult to exploit the detected anomalies. Nevertheless, an investor can implicitly benefit from these seasonal patterns by postponing or push forward buying (selling) when he has already decided to purchase (sell) an ADR.
Much remains to be studied regarding the seasonal predictability of ADRs. The pre-holiday anomaly has been attributed to the investor adjustment process carried out by short-sellers that close their risk positions in advance of holidays (Fabozzi et al., 1994) and to a "holiday euphoria" effect (Lahav et al., 2016). It would be good to investigate the causes of the pre-holiday anomaly found in our sample. Also, further evidence is needed to establish whether ex-post trading strategies can be constructed to exploit the patterns of seasonality described in this study. It would also be interesting to understand the role played by the US institutional practices and by this country’s cultural characteristics on the prevalence of seasonal anomalies in ADRs. The finding that seasonal anomalies can be a function of the statistical technique applied (Toit et al., 2018) suggests that it would be wise to replicate our study using models that allow for a time-varying variance. Finally, the possibility that the some of the anomalies may interact with each other should be addressed in future research.
Note
ADRs can be issued at four different levels. Level I ADRs are the most basic type of ADR. They do not involve capital raising, are not offered to the public at large, and are not listed on an exchange. These ADRs are traded in the over-the-counter market and are the least regulated by the Securities and Exchange Commission (SEC). Level II ADRs are those where existing shares are listed on a major US exchange. They have greater visibility and liquidity than Level I ADRs and are more regulated by the SEC. Level III ADRs are the highest profile form of ADR and involve a public offering and new capital raising on a US exchange. They have higher reporting requirements. Finally, level IV ADRs (also known as Rule 144A listings) are a hybrid of public offering and a private placement to qualified institutional buyers. They are exempt from SEC registration.
References
Agrawal, A. and Tandon, K. (1994), "Anomalies or illusions? Evidence from stock markets in eighteen countries", Journal of International Money and Finance, Vol. 13 No. 1, pp. 83-106. [ Links ]
Andrade, S.C., Chhaochharia, V. and Fuerst, M.E. (2013), "Sell in may and go away just won’t go away", Financial Analysts Journal, Vol. 69 No. 4, pp. 94-105.
Ariel, R.A. (1987), "A monthly effect in stock returns", Journal of Financial Economics, Vol. 18 No. 1, pp. 161-174. [ Links ]
Ariel, R.A. (1990), "High stock returns before holidays: existence and evidence on possible causes", Journal of Finance, Vol. 45 No. 5, pp. 1611-1626. [ Links ]
Barber, B.M. and Odean, T. (2000),"Trading is hazardous to your wealth: the common stock investment performance of individual investors", Journal of Finance, Vol. 55 No. 2, pp. 773-806. [ Links ]
Bekaert, G. and Harvey, C.R. (2003), "Emerging markets finance", Journal of Empirical Finance, Vol. 10 Nos 1/2, pp. 3-55.
[ Links ]
Bouges, J.C., Jain, R. and Puri, Y.R. (2009), "American depository receipts and calendar anomalies", Applied Financial Economics, Vol. 19 No. 1, pp. 17-25. [ Links ]
Bouman, S. and Jacobsen, B. (2002), "The halloween indicator, ‘sell in may and go away’: another puzzle", American Economic Review, Vol. 92 No. 5, pp. 1618-1635.
Cadsby, C.B. and Ratner, M. (1992), "Turn-of-month evaluations of liquid profits and stock", Journal of Banking and Finance, Vol. 16 No. 3, pp. 497-509. [ Links ]
Chang, E.C., Pinegar, J.M. and Ravichandran, R. (1993), "International evidence on the robustness of the day-of-the-week effect", Journal of Financial and Quantitative Analysis, Vol. 28 No. 4, pp. 497-514. [ Links ]
Chong, R., Hudson, R., Keasey, K. and Littler, K. (2005), "Pre-holiday effects: international evidence on the decline and reversal of a stock market anomaly", Journal of International Money and Finance, Vol. 24 No. 8, pp. 1226-1236. [ Links ]
Darrat, A.F., Li, B., Liu, B. and Su, J.J. (2011), "A fresh look at seasonal anomalies: an international perspective", International Journal of Business and Economics, Vol. 10, pp. 93-116. [ Links ]
Dichtl, H. and Drobetz, W. (2014), "Are stock markets really so inefficient? The case of the ‘halloween indicator.", Finance Research Letters, Vol. 11 No. 2, pp. 112-121.
Dicle, M.F. and Levendis, J.D. (2014), "The day-of-the-week effect revisited: international evidence", Journal of Economics and Finance, Vol. 38 No. 3, pp. 407-437. [ Links ]
Dubois, M. and Louvet, P. (1996), "The day-of-the-week effect: the international evidence", Journal of Banking and Finance, Vol. 20, pp. 1463-1484. [ Links ]
Dzhabarov, C. and Ziemba, W.T. (2017), "Do seasonal anomalies still work?", in Ziemba, W.T. (Ed.), Great Investment Ideas, World Scientific, pp. 125-145. [ Links ]
Dzhabarov, C., Ziegler, A. and Ziemba, W.T. (2018), "Sell in may and go away: the evidence in the international equity index futures markets", Quantitative Finance, Vol. 18 No. 2, pp. 171-181. [ Links ]
Easterday, K.E., Sen, P.K. and Stephan, J.A. (2009), "The persistence of the small firm/January effect: is it consistent with investors’ learning and arbitrage efforts?", Quarterly Review of Economics and Finance, Vol. 49 No. 3, pp. 1172-1193.
Fabozzi, F.J., Ma, C.K. and Briley, J.E. (1994), "Holiday trading in futures markets", Journal of Finance, Vol. 49 No. 1, pp. 307-324. [ Links ]
Fountas, S. and Segredakis, K. (2002), "Emerging stock markets return seasonalities: the January effect and the tax-loss selling hypothesis", Applied Financial Economics, Vol. 12 No. 4, pp. 291-299. [ Links ]
French, K.R. (1980), "Stock returns and the weekend effect", Journal of Financial Economics, Vol. 8 No. 1, pp. 55-69. [ Links ]
Galai, D., Kedar-Levy, H. and Schreiber, B. (2008), Seasonality in Outliers of Daily Stock Returns: A Tail That Wags the Dog? International Review of Financial Analysis, Vol. 17, pp. 748-792.
[ Links ]
Giovanis, E. (2009), "Calendar effects in fifty-five stock market indices", Global Journal of Finance and Management, Vol. 1, pp. 75-98.
[ Links ]
Griffin, J.M., Kelly, P.J. and Nardari, F. (2010), "Do market efficiency measures yield correct inferences? A comparison of developed and emerging markets", Review of Financial Studies, Vol. 23 No. 8, pp. 3225-3277. [ Links ]
Gultekin, M.N. and Gultekin, N.B. (1983), "Stock market seasonality: international evidence", Journal of Financial Economics, Vol. 12 No. 4, pp. 469-481. [ Links ]
Haggard, K.S. and Witte, H.D. (2010), "The halloween effect: trick or treat?", International Review of Financial Analysis, Vol. 19 No. 5, pp. 379-387. [ Links ]
Haugen, M. and Hirschey, M. (2006), "The January effects", Financial Analysts Journal, Vol. 62, pp. 78-88. [ Links ]
Haugen, R.A. and Jorion, P. (1996), "The January effect: still there after all these years", Financial Analysts Journal, Vol. 52 No. 1, pp. 27-31. [ Links ]
Jacobsen, B. and Visaltanachoti, N. (2009), "The halloween effect in US sectors", Financial Review, Vol. 44 No. 3, pp. 437-459. [ Links ]
Jacobsen, B. and Zhang, C.Y. (2014), "The halloween indicator, ‘sell in may and go away’: an even bigger puzzle", Working Paper, Social Sciences Research Network.
Jaffe, J. and Westerfield, R. (1985), "The week-end effect in common stock returns: the international evidence", Journal of Finance, Vol. 40 No. 2, pp. 433-454. [ Links ]
Jaffe, J. and Westerfield, R. (1989), "Is there a monthly effect in stock market returns? Evidence from foreign countries", Journal of Banking and Finance, Vol. 13, pp. 237-244. [ Links ]
Keef, S.P. and Roush, M.L. (2005), "Day-of-the-week effects in the pre-holiday returns of the standard and poor’s 500 stock index", Applied Financial Economics, Vol. 15, pp. 107-119.
Khaled, M.S. and Keef, S.P. (2012), "A note on the turn of the month and year effects in international stock returns", European Journal of Finance, Vol. 18 No. 6, pp. 597-602. [ Links ]
Kim, C. and Park, J. (1994), "Holiday effects and stock returns: further evidence", Journal of Financial and Quantitative Analysis, Vol. 29 No. 1, pp. 145-157. [ Links ]
Kohers, G., Kohers, N., Pandey, V. and Kohers, T. (2004), "The disappearing day-of-the-week effect in the world’s largest equity markets", Applied Economic Letters, Vol. 11 No. 3, pp. 167-171.
Kunkel, R.A., Compton, W.S. and Beyer, S. (2003), "The turn-of-the-month effect still lives: the international evidence", International Review of Financial Analysis, Vol. 137, pp. 1-15. [ Links ]
Lahav, E., Shavit, T. and Benzion, U. (2016), "Can’t wait to celebrate: holiday euphoria, impulsive behavior and time preference", Journal of Behavioral and Experimental Economics, Vol. 65, pp. 128-134.
Lakonishok, J. and Smidt, S. (1988), "Are seasonal anomalies real? A ninety-year perspective", Review of Financial Studies, Vol. 1 No. 4, pp. 403-425. [ Links ]
Lucey, B.M. and Zhao, S. (2008), "Halloween or January? Yet another puzzle", International Review of Financial Analysis, Vol. 17 No. 5, pp. 1055-1069. [ Links ]
McConnell, J.J. and Xu, W. (2008), "Equity returns at the turn of the month", Financial Analysts Journal, Vol. 64 No. 2, pp. 49-64. [ Links ]
Marquering, W., Nisser, J. and Valla, T. (2006), "Disappearing anomalies: a dynamic analysis of the persistence of anomalies", Applied Financial Economics, Vol. 16 No. 4, pp. 291-302. [ Links ]
Mehdian, S. and Perry, M.J. (2001), "Anomalies in US equity markets: a re-examination of the January effect", Applied Financial Economics, Vol. 12 No. 2, pp. 141-145. [ Links ]
Mills, T.C. and Coutts, J.A. (1995), "Calendar effects in the London stock exchange FT-SE indices", European Journal of Finance, Vol. 1 No. 1, pp. 79-93. [ Links ]
Newey, W.K. and West, K.D. (1987), "A simple, positive semi-definite, heteroskedasticity and autocorrelation consistent covariance matrix", Econometrica, Vol. 55 No. 3, pp. 703-709. [ Links ]
Rosenberg, M. (2004), "The monthly effect in stock returns and conditional heteroscedasticity", American Economist, Vol. 48 No. 2, pp. 67-73. [ Links ]
Rozeff, M.S. and Kinney, W.R. (1976), "Capital market seasonality: the case of stock returns", Journal of Financial Economics, Vol. 3 No. 4, pp. 379-402. [ Links ]
Sharma, S.S. and Narayan, P.H. (2014), "New evidence on turn-of-the-month effects", Journal of International Financial Markets, Institutions and Money, Vol. 29, pp. 92-108. [ Links ]
Siegel, J. (2014), Stocks for the Long Run, 5th ed., McGraw-Hill. [ Links ]
Singal, V. (2003), Beyond the Random Walk, Oxford University Press.
[ Links ]
Toit, E., Hall, J.H. and Pradhan, R.P. (2018), "The day-of-the-week effect: South African stock market indices", African Journal of Economic and Management Studies, Vol. 9, pp. 197-212. [ Links ]
Urquhart, A. and McGroarty, F. (2014), "Calendar effects, market conditions and the adaptive market hypothesis: evidence from long-run US data", International Review of Financial Analysis, Vol. 35, pp. 154-166. [ Links ]
Wang, K., Li, Y. and Erickson, J. (1997), "A new look at the monday effect", Journal of Finance, Vol. 52 No. 5, pp. 2171-2186.
[ Links ]
Wilson, J.W. and Jones, C.P. (1993), "Comparison of seasonal anomalies across major equity markets: a note", The Financial Review, Vol. 28 No. 1, pp. 107-115. [ Links ]
Zhang, J., Lai, Y. and Lin, J. (2017), "The day-of-the-week effects of stock markets in different countries", Finance Research Letters, Vol. 20, pp. 47-62. [ Links ]
Ziemba, W.T. (1991), "Japanese security market regularities: monthly, turn-of", The-Month and Year, Holiday and Golden Week Effects. Japan and the World Economy, Vol. 3, pp. 119-146. [ Links ]
Zwergel, B. (2010), "On the exploitability of the turn-of-the-month effect: an international perspective", Applied Financial Economics, Vol. 20, Vol. 20 No. 11, pp. 911-922.
Citation:
Lobão, J. (2019), "Seasonal anomalies in the market for American depository receipts", Journal of Economics, Finance and Administrative Science, Vol. 24 No. 48, pp. 241-265. https://doi.org/10.1108/JEFAS-09-2018-0088
Received: 10 September 2018
Revised: 3 December 2018
Accepted: 14 January 2019

