


Servicios Personalizados
Revista

Articulo
 Inglés (pdf)
 Articulo en XML
 Referencias del artículo
 Enviar articulo por email
Indicadores
-
 Citado por SciELO
Links relacionados
-
 Similares en
SciELO
Similares en
SciELO
Compartir

 Permalink
Journal of Economics, Finance and Administrative Science
versión impresa ISSN 2077-1886
Journal of Economics, Finance and Administrative Science vol.24 no.48 Lima jul./dic. 2019
http://dx.doi.org/https://doi.org/10.1108/JEFAS-12-2017-0126
ARTICLE
The impact of transaction costs in portfolio optimization. A comparative analysis between the cost of trading in Peru and the United States
Luc Chavalle 1,*
Luis Chavez-Bedoya2
1IESEG School of Management, Paris, France, and Universidad ESAN, Lima, Peru
2Universidad ESAN, Lima, Peru
Corresponding author: *luc.chavalle@ieseg.fr
Abstract
Purpose: This paper aims to analyze the impact of transaction costs in portfolio optimization in Peru. The study aims to compare the transaction costs structure applied in Peru with respect to the ones applied in the USA, and over a few dimensions.
Design/methodology/approach: The paper opted for an empirical study analyzing the cost of rebalancing portfolios over a set period and dimensions. Stocks have been carefully selected using Bloomberg terminals, and portfolio designed then rebalanced using VBA programming. Over a few dimensions as type and number of stocks, holding period and trading strategy, the behavior of these different transaction costs has been compared. The analysis has been done for four different portfolios.
Findings: The paper provides empirical insights about how a retail investor actively trading in Peru can pay up to 14 times more in transaction costs than trading the same portfolio in the USA. These comparatively high transaction costs prevent retail investors to trade in the Peruvian stock market while fueling illiquidity to this market.
Research limitations/implications: The paper deals with a limited amount of Peruvian stocks. Researchers are encouraged to test the proposition further, including other dimensions.
Practical implications: The paper includes implications for any retail investor that wants to invest in Peruvian stocks, giving an insight about how expensive it is to actively rebalance a portfolio in Peru.
Originality/value: This paper fulfils an identified need to study how much it costs to actively invest on the stock market in Peru.
Keyword: Transaction costs, Portfolio optimization, Portfolio turnover
1. Introduction
The Peruvian stock exchange, known as the Bolsa de Valores de Lima (BVL), currently lists 278 securities with a total market capitalization of about US$130bn[1]. It is regulated by the Superintendencia del Mercado de Valores and has a limited exchange self-regulatory organization. The BVL is currently facing serious liquidity and low transaction volume problems[2], and its average daily trading volume in 2016 was US$18.26m. On the other hand, the New York Stock Exchange (NYSE) is the biggest stock market in the world with a market capitalization of nearly US$20.6tn[3]. It is regulated by the Securities and Exchange Commission (SEC). The NYSE is characterized by its high liquidity and its large stock inflows and outflows that incur on a daily basis, around US$42bn are traded every day and has more than 2,700 listed firms. The Sustainable Stock Exchange Initiative considers the NYSE as one of the most advanced stock exchanges in the world. Because of its quality standards, the NYSE has been selected as a benchmark to compare transaction costs (TC) with the ones of the BVL.
We define TC as the cost of buying or selling securities to rebalance or build a particular portfolio. The TC structure in Peru is interesting in the sense that it charges investors a percentage of the stock value traded. However, there is also a minimum trading fee to pay that is high and finally makes the Peruvian stock market very expensive with respect to the ones of more developed markets. In the USA, there exist two types of TC. The first one charges investors per the number of shares they buy or sell, and it is called TC per share. The second structure charges investors per the number of trades they make, and it is called TC per trade. The comparison of the aforementioned TC structures with the one applied in Peru (TC per percentage) is used to determine which type of TC is the most appropriate and under which conditions this said type could happen.
To answer the previous research question, we analyze the behavior of the TC structures in Peru and the USA over three dimensions: the type and number of stocks, the holding period of the portfolio and the selected trading strategy. The paper concludes that TC per share is the cheapest when small monetary amounts are invested in the portfolio, but once a certain initial amount is reached, TC per trade becomes preferable. However, the TC structure applied in Peru represents the most expensive structure for any dimension. This analysis was carried on using current cost parameters found in both the BVL and the NYSE. To the best of our knowledge, there has not been any study analyzing the cost of trading in Peru and assessing the convenience of the TC structure applied on the BVL. Also, as a byproduct of our analysis, we corroborate some empirical regularities like that TC are higher for portfolios composed of small market capitalizations stocks, holding period helps dilute entry and exit costs and active trading strategies are subject to higher TC[4].
In conclusion, retail investors that decide to invest in the Peruvian stock market can only do so if they adopt a buy and hold investment strategy. In fact, they would be facing substantial TC by rebalancing their portfolio from month to month. This is more dramatic for small initial investment amounts. For example, if US$30K are invested in Peruvian stocks (under TC per percentage), the investor can lose up to 10 per cent in yearly return owing to TC. In comparison, trading the same stocks in the USA under the other TC structures incurs 1 per cent in yearly return. The main issue is that the minimum trading fee applied in Peru is very expensive compared with the stock inflows and outflows that are actually incurred. Therefore, portfolio rebalancing and active portfolio management strategies could be adopted in the BVL only if the minimum trading fee was at least the same as the one applied for TC per share in the USA. To make the Peruvian TC per percentage competitive, a dramatic reduction in the minimum cost per trade is needed: it has to go from $25 to $1 to make the current cost structure competitive for a retail investor with a relatively small initial investment amount. This reduction in fees will lure a bigger number of investors to the BVL, and it will increase its liquidity and volume negotiated.
This paper is divided into five different parts. Section 2 presents the methodology, the definitions of TC and the indicators used to assess portfolio performance. Section 3 contains the analysis and provides a deep understanding of the behavior TC under the different dimensions. Section 4 aims at making TC per percentage competitive to TC per share and TC per trade by changing its cost parameters. Finally, Section 5 concludes and provides recommendations from the perspective of an investor trading in the Peruvian stock market.
2. Methodology
This section defines the different trading strategies and the three types of TC used in this paper. It also shows how we measure the impact of TC in portfolio performance and how it is calculated.
2.1 Trading strategies
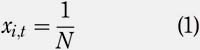
Three trading strategies are going to be studied in this paper. The objective for each strategy is to converge to specific portfolio weights at the end of every period. These target values represent the optimal allocation of a stock in the portfolio. The portfolio has to be rebalanced because the optimal weights are not achieved automatically owing to price fluctuations. Let i denote a particular stock of a portfolio P of N stocks, and xi,t be the weight of stock i at the beginning of period t. While including entry and exit costs, t oscillates from t = 0 to t = T, where 0 represents the initial period when the portfolio is built, and T represents the very last period when all stocks are sold and the portfolio liquidated. Therefore, t represents a specific period and varies from 0 to T "" 1, where T "" 1 is the number of periods.
The first trading strategy is the equally weighted (EW). This strategy sets the same weight allocation for every stock, at every period[5]. This means that the weight for one stock has to remain constant and equals to the following:
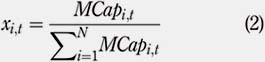
The second trading strategy is the market capitalization (MC). This strategy allocates a weight for each stock depending on its market capitalization within the portfolio[6]. Let MCapi,t denote the market capitalization of a particular stock i at time t. The weight of a stock i at period t can be expressed as follows:
The third trading strategy is the Markowitz strategy (MZ), which is inspired from Markowitz (1952) and Sharpe (1964). This strategy aims at having the most efficient portfolio allocation in terms of a risk""return relationship. Weights are computed by maximizing the Sharpe ratio. For each period, a covariance matrix and a mean vector based on the stock"™s previous returns have been computed. Let SRP,t denote the Sharpe ratio of a portfolio P at period t, RP,t the return of portfolio P at period t, Rf the risk-free rate and σP,t the portfolio standard deviation at period t. Weights xi,t for the N stocks of portfolio P are computed maximizing the following:
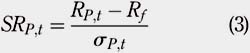
In this paper, we do not consider short sales, then the xi,t maximizing (3) will be forced to be greater than zero.
2.2 Unbalanced portfolio weights
Because of the change in stock prices at the end of every period, the weights of the stocks of the portfolio have to be rebalanced to be consistent with the trading strategies described in Section 2.1. Let Xui , t +1 denote the unbalanced weight of a stock i at the beginning of period t + 1, and ri;tþ1 denote the return of a particular stock i at period t + 1. For t ≥ 0 to t = T "" 1, the unbalanced weight of a stock i at the beginning of period t + 1 can be expressed as follows:
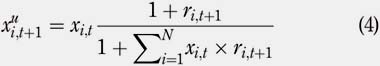
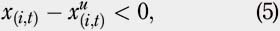
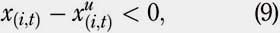
To describe the TC involved, it is assumed that Xui,t ≠ Xi,t for every t and i.
2.3 Transaction costs
The paper identifies three different types of TC: TC per share, TC per percentage and TC per trade. Under TC per share, investors are charged a fixed fee for each single stock they buy or sell. TC per percentage charges investors a percentage of the stock value traded. TC per trade charges investors a specific amount for each trade they make. Next we describe each of the aforementioned TC structures in detail. Let Pi,t denote the price of stock i at the beginning of period t, and Wi,t denote the value of stock i in the portfolio at the beginning of period t. Let TCs , TCp and TCe be TC per share, TC per percentage and TC per trade, respectively. For t = 0 to t = T "" 1, the TC per share, TCs , can be expressed as follows:if
then

else
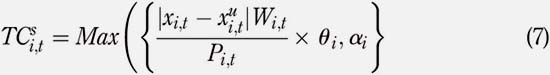
where θi is the per-share trading fee in dollar, ai the minimum trading cost in US$ and r i is the regulatory transaction fee charged by the SEC on stock sales only and when the trading occurs on the American stock market. The TC per share is a structure for TC commonly used in the USA. Fort = 0 to t = T "" 1, the TC per percentage, TCp , can be expressed as follows:

where b i represents the fixed percentage per stock value, g i the minimum trading cost in US$ and mi is the regulatory fee applied in Peru. The TC per percentage is the current Peruvian structure for TC. Finally, for t = 0 to t = T "" 1, the TC per trade, TCe , can be expressed as follows: If
then

else
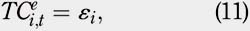
where εi represents the trading cost in US$ and pi is the regulatory transaction fee charged by the SEC on stock sales only. As in the case of the TC per share, the TC per trade is also an American structure for TC. The values of the coefficients θi , ai , r i , β i µi , and ε i used for the numerical experiments will be defined in Section 3.
2.4 Entry and exit costs
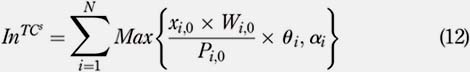
Two key periods of the experiments are the very first one and the very last one. The very first period, referred as period 0, is the period where the portfolio is fully built with the initial investment. It corresponds to a period of heavy stock purchases. This period is subject to a substantial amount of TC corresponding to large entry costs. Let Inj denote the entry costs associated with a particular type of TC j, either per share, per percentage or per trade. For t = 0 and for each type j of TC, entry costs, Inj , can be expressed as follows:

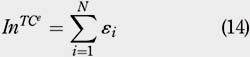
Similarly, the very last period, referred as period T, corresponds to the period of liquidation of the portfolio and corresponds to a period of heavy stock sales and, therefore, subject to significant TC. Let Outj denote the exit costs associated with a particular type of TC j. For t = T, exit costs, Outj , can be expressed as follows:


With these assumptions, experiments were made with and without taking into consideration the entry and exit costs described in this section.
2.5 Turnover
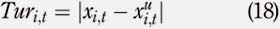
Another variable that is analyzed in the paper is the turnover. It consists in the change in weight of a stock i after rebalancing. For t 0 to t = T "" 1, the turnover Turi,t of a stock i at period t can be expressed as follows:
Therefore, the portfolio turnover at period t can be written as:
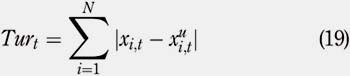
In this thesis, the average turnover over the holding period is generally reported. It corresponds to the average of the expressions given by equation (19) over all t.
2.6 Percentage loss
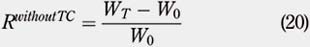
This loss corresponds to the difference between the portfolio return without taking into account TC and the portfolio return taking into account TC. Let WT denote the total value of the portfolio at the very last period, which corresponds to the liquidation period. Let W0 denote the value of the portfolio at the very first period, which corresponds to the initial investment. The total return of the portfolio without taking into account TC, Rwithout TC, can be expressed as follows:
Adding TC, either per share, per percentage or per trade, we obtain the following total portfolio return Rjwith TC:
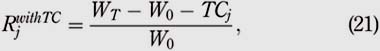
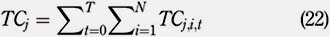
where TCj denotes a specific type of TC, either per share, per percentage or per trade and
where j includes both entry and exit costs. Therefore, the loss Lj associated with a specific type of TCj can be simply expressed by the following equation:

For the purpose of our study, the value of Lj has been annualized to observe how much is lost per year, and it will be used to assess portfolio performance.
3. Analysis
TC can have a different impact on portfolio performance depending on the composition of the portfolio, the holding period and the adopted trading strategy. Next we will analyze the interaction of these factors with the types of TC described in Section 2. The analysis is mainly conducted from the perspective of a retail investor trading in the Peruvian market. Nevertheless, US stocks and transaction fees are included to enhance the scope of our analysis.
3.1 Stock selection procedure
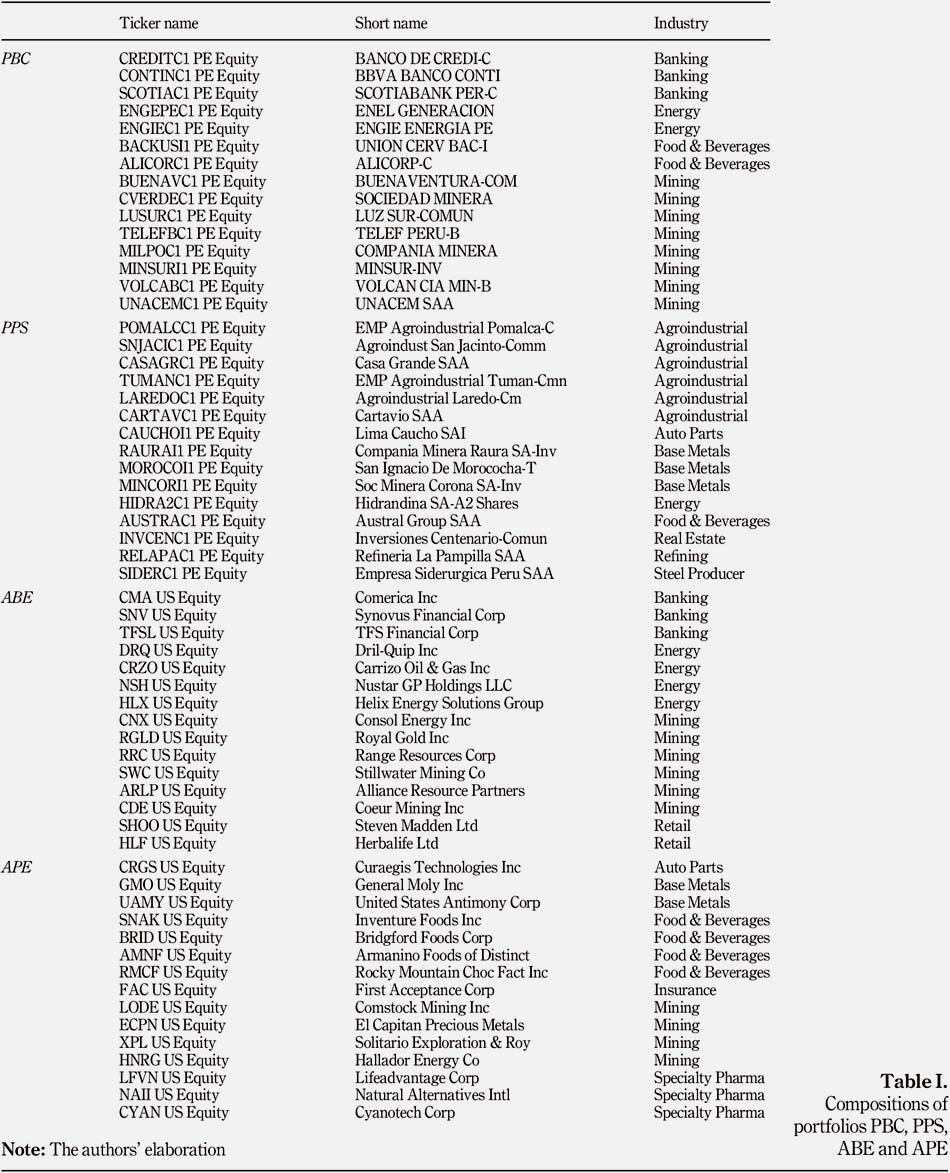
To analyze the impact of TC from the perspective of an investor trading on the Peruvian stock market, we have created four portfolios of 15 stocks each. Two of them are composed of Peruvian stocks only, whereas the two others consist of comparable American portfolios and contain only stocks listed on the NYSE.
The first portfolio is composed of 15 Peruvian stocks with the highest market capitalization on the BVL on the date of December 31, 2016. Let Peruvian Blue Chips (PBC) denote this first portfolio. The second portfolio includes 15 Peruvian stocks with the lowest market capitalization on the BVL on the date of December 31, 2016, and it will be denoted as Peruvian Pink Sheets (PPS). For our comparisons with the American market, two other portfolios were created by picking similar stocks in terms of market capitalization, price and industry, on the NYSE, and on the date of December 31, 2016. Therefore, the third portfolio consists of 15 US stocks comparable with the ones of the PBC portfolio, and it will be denoted as American Blue Equivalents (ABE). The fourth portfolio is composed of 15 US stocks equivalent to the PPS portfolio. Let American Pink Equivalents (APE) denote this forth portfolio. Table I offers an insight of the composition of each portfolio[7]. Besides, all stock prices in Peruvian Nuevo Sol (PEN) have been converted to US dollars (US$), and it has been assumed that we can trade any amount at the quoted prices.
3.2 Initial amount invested
To analyze the relationship between initial investment and TC, the experiment has been run with 13 different amounts of USD for each portfolio: $10,000, $20,000, $30,000, $60,000, $100,000, $200,000, $300,000, $600,000, $1,000,000, $2,000,000, $3,000,000, $6,000,000 and $10,000,000.
3.3 Holding period
Each portfolio has been analyzed for three different time frames. Our data for stock prices and market capitalizations have been extracted successively for nine, five and three years. All data have been extracted on a monthly basis. The nine-year period of analysis goes from January 31, 2008 to December 31, 2016. The five-year period of analysis goes from January 31, 2008 to December 31, 2012. The three-year period of analysis goes from January 31, 2008 to December 31, 2010. The beginning period of January 31, 2008, has been chosen to cover the Financial Crisis and its effects on stock prices. Indeed, the Dow""Jones fell over half from a high of 14,165 on October 9, 2007, to a low of 6,926 on March 5, 2009. We wanted to analyze if similar effects on stock prices were observable on the BVL and their possible impact on TC.
3.4 Parameters for TC
Each TC has parameters that determines how expensive it is. The TC per share has a trading fee in dollar θi that is applied for each single stock bought or sold on the stock market. The value of u i used is $0.01 per share and refers to the common trading fee used by American online brokerage firms such as Lightspeed Trading or Trade Station Securities[8]. In addition, those firms apply a minimum trading cost in dollars, ai , of $1 per trade. Finally, the SEC applies a regulatory fee r i on all stock sales values only. The value of r i used is 0.0000238[9].
Concerning the TC per percentage, the fixed percentage per stock value βi is determined by the broker making the transaction. The value of βi used is 0.55 per cent and refers to the average trading fee applied by stockbrokers in Peru. As for the TC per share, the TC per percentage faces a minimum trading cost in dollar yi. The value of yi used is $25 and corresponds to an average of Peruvian brokers. Besides, the TC per percentage faces a regulatory fee μi applied by the BVL and the value of μi used is 0.08295 per cent [10]. Last but not least, the TC per trade faces a trading cost « i of $7.97. This cost is an average of the trading cost used by American online brokerage firms such as E-Trade, Charles Schwab, TD Ameritrade or Tradeking[11]. As for TC per share, TC per trade faces a regulatory fee p i .
3.5 Influence of the portfolio composition
Each of the portfolios described in Section 3.1 has been analyzed over a period of five years and under an EW strategy given by equation (1). Under the perspective of an investor trading on the Peruvian market, the PBC portfolio has first been analyzed. This section aims at determining the impact of different initial amounts invested on the behavior of the different TC structures.
Figure 1 shows the yearly loss per initial amount invested for each type of TC for the PBC portfolio. First, we note that TCs per share are efficient for small initial amounts invested in the PBC portfolio. The yearly loss is always lower than 1 per cent for any amount invested equal or above $20,000. TC per share also tend to be the least volatile among all types of TC. Second, both TC per percentage and TC per trade become better than TC per share once a certain initial amount invested is reached. TCs per percentage have a yearly loss that becomes lower than the one for TC per share for any amount invested equal or above $1,000,000. In the same connection, TCs per trade are more efficient than TC per share for any amount invested equal or above $120,000. Third, if we compare both TC per percentage and TC per trade, TCs per trade are always a better choice because they face lower yearly losses for any initial amount invested.
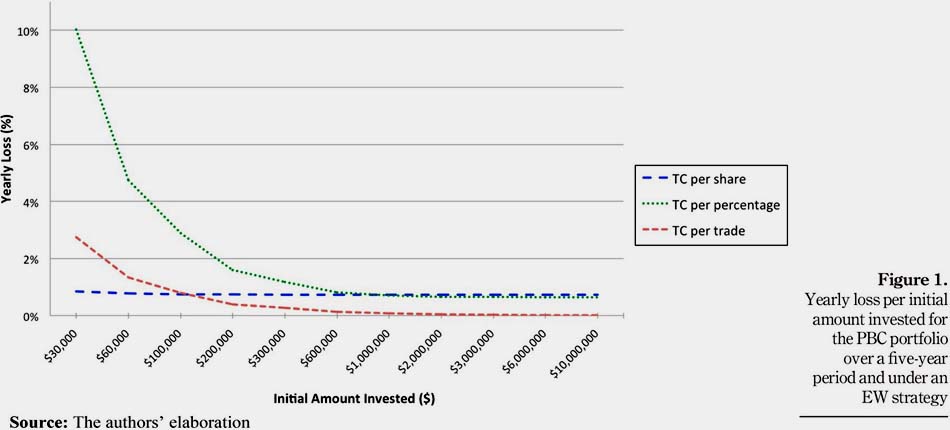
Table II presents the yearly loss per initial amount invested for each type of TC and portfolio. Keeping the same strategy and holding period, similar conclusions can be drawn for both the PPS portfolio and the APE portfolio. As a matter of fact, TCs per share remain the cheapest kind for small amounts invested for both the PPS and APE portfolios. However, once a specific level of initial amount invested is reached, TC per percentage and TC per trade are preferable. TC per trade is always better than TC per percentage. Results are a little bit different for the ABE portfolio. Indeed, TC per percentage never becomes preferable to TC per share. Also, TC per trade becomes better than TC per share only when a large initial investment is made: at least $2,000,000 has to be invested. The reason beyond this result is that the ABE portfolio includes stocks with higher prices and lower volatilities.
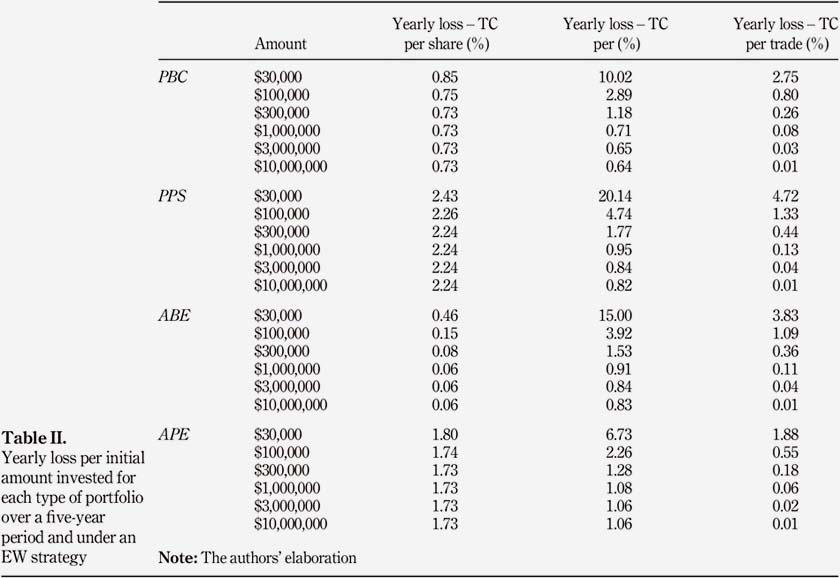
Besides, portfolios composed of stocks with large market capitalizations (PBC and ABE) tend to have less yearly loss than those with small market capitalizations (PPS and APE). This increase in yearly loss for both the PPS portfolio and the APE portfolio can be explained by lower stock prices and a higher volatility compared with the PBC and the ABE portfolios.
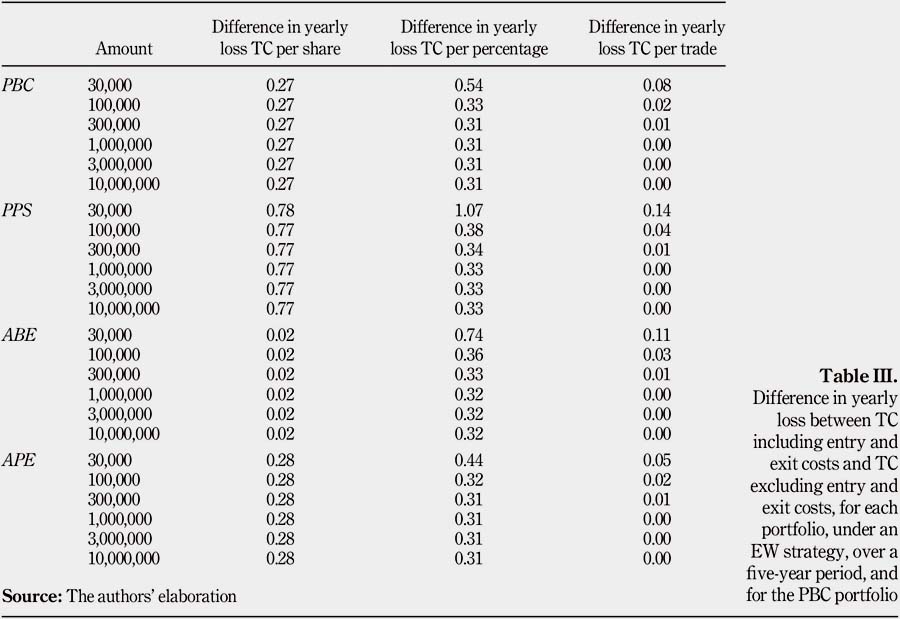
Entry and exit costs do not affect the portfolio returns that much. Table III presents the difference in yearly loss between TC including entry and exit costs and TC excluding entry and exit costs. The average loss without entry and exit costs is lower by 0.01 per cent to 0.8 per cent than when including entry and exit costs. The trends observed for the four portfolios are the same as when entry and exit costs are not taken into account.
3.6 Influence of the holding period
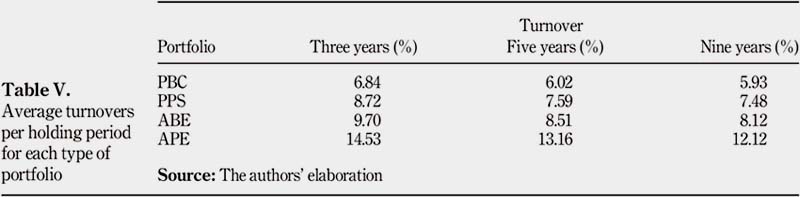
The PBC portfolio has been analyzed changing the holding period to three and nine years. Table IV Table depicts the yearly loss associated with each holding period for the PBC portfolio. For three and nine years, we obtain similar results to the PBC portfolio analyzed under a five-year period. First, TC per share remains the most efficient type of TC when dealing with small amounts. However, once a certain level is reached, TC per percentage (between $600,000 and $1,000,000) and TC per trade (between $100,000 and $200,000) both become more efficient. Once again, TC per trade is preferable to TC per percentage because the yearly loss for TC per trade is always lower. Therefore, the holding period does not influence the performance of the different types of TC for the PBC portfolio.
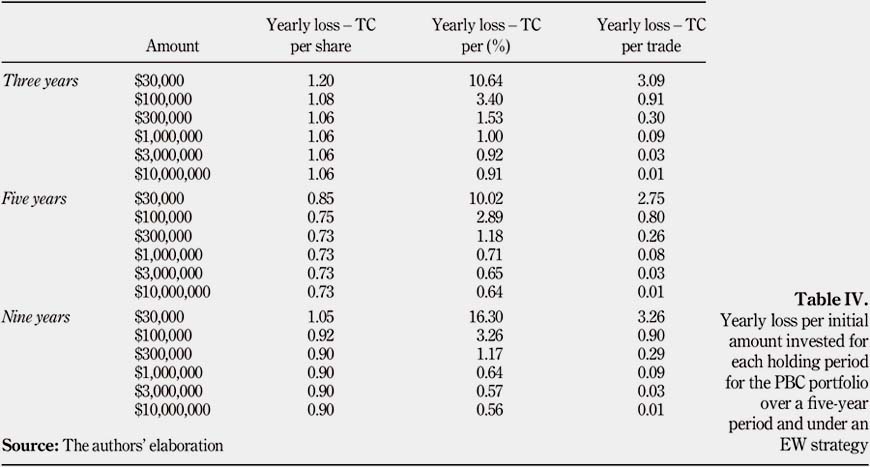
Also, the holding period helps dilute the large entry and exit costs: the larger the holding period, the more diluted these costs. Table V illustrates the decline of average turnovers over time. The influence of both the entry and exit costs on the portfolio performance decreases when the holding period increases. This could be explained by the fact that the ratio entry""exit cost to total TC decreases over time. Indeed, these entry and exit costs remain pretty much the same for these three time frames: the entry costs are in fact the same for the three years, and the exit costs vary just a little bit owing to price fluctuations at the very last period. On the other hand, the total TC increases when the holding period increases, simply because there are more periods and in time more transactions occur.
3.7 Influence of the trading strategy
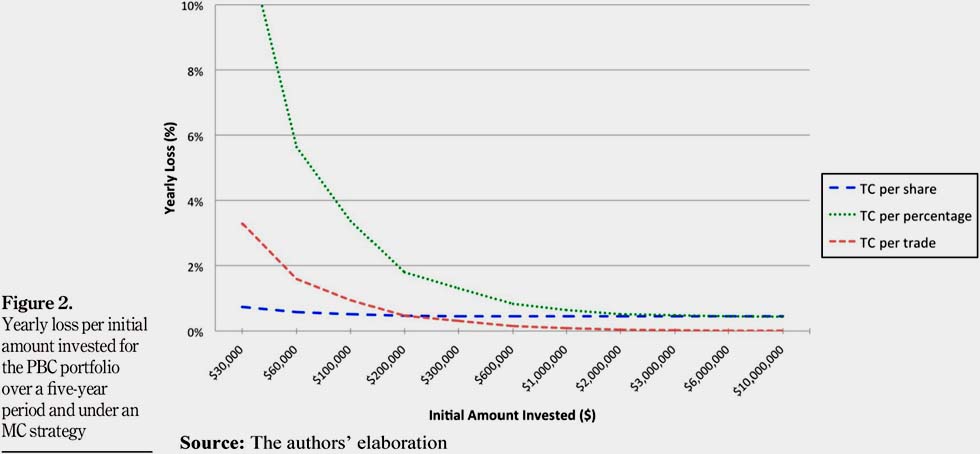
The three trading strategies of Section 2.1 have been analyzed. The PBC portfolio has been examined under an MC strategy[12] over a five-year period to compare results found with the EW strategy. Figure 2 plots the yearly loss per initial amount invested for each type of TC for the PBC portfolio under an MC strategy given by equation (2). The MC strategy faces the same dynamics as the EW strategy, in the case of the PBC portfolio. Indeed, TC per share is efficient for small amounts invested. Also, TC per trade and TC per percentage overcome TC per share once a certain minimum initial investment is reached ($10,000,000 and $300,000 respectively). Comparing Figure 1 and Figure 2, we observe that TC per percentage and TC per trade become less efficient under an MC strategy. Indeed, switching to one of those two kinds of TC is done for larger initial amounts invested than under an EW strategy. Finally, TCs per trade are always better than TC per percentage.
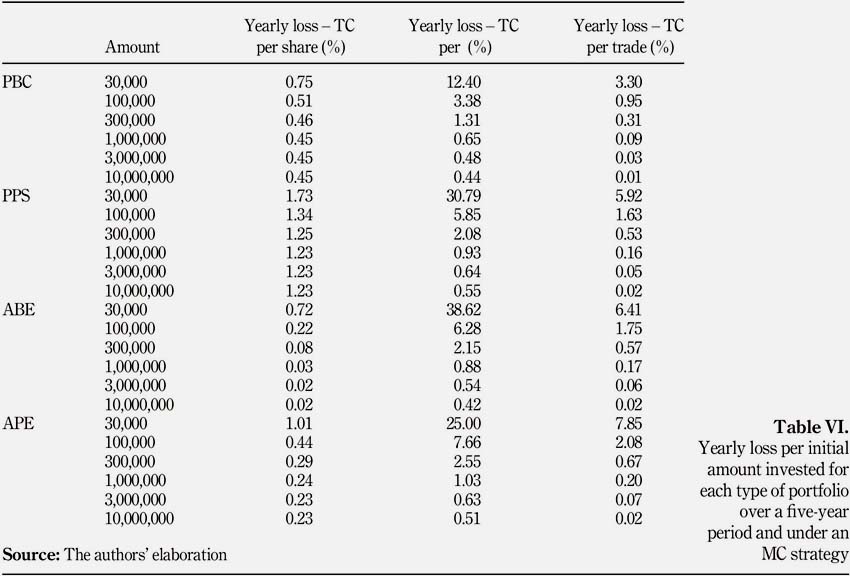
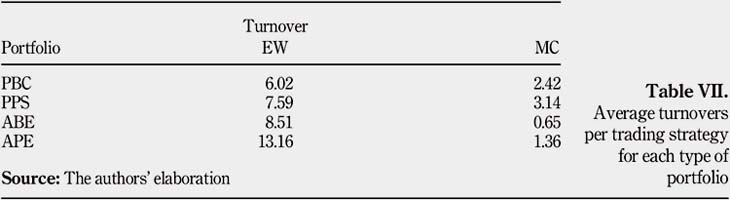
Concerning TC per share, those are less expensive under the MC strategy: the yearly loss associated is smaller than under an EW strategy and this is the case for all portfolios. Table VI presents the yearly loss per initial amount invested for all portfolios. These lower TCs incurred under the MC strategy can be explained by a decrease in turnover. Table VII shows that turnovers using an MC strategy are much smaller than when using an EW strategy, and for any type of portfolio. Concerning TCs per trade, those are slightly more expensive when using the MC strategy: the yearly loss associated is higher than under an EW strategy. This is the case for the PBC portfolio as well as the others. Finally, TC per percentage under an MC strategy becomes more attractive than an EW strategy when the initial amount invested gets bigger, i.e. $1,000,000. This observation is explained by the fact that bigger initial investments imply bigger trading costs when rebalancing the portfolio, which eventually neglect the high minimum trading cost of the TC per percentage.
The third strategy analyzed is the MZ strategy. Owing to a lack of data for Peruvian stocks, a new portfolio composed of 12 ABE stocks has been built to analyze the effects of this strategy on the different kinds of TC. Let New ABE denote this new portfolio created. Table AI presents the stock composition of this New ABE. To do so, the data from five years before the period of analysis were required to compute the mean vector and covariance matrix. For instance, the weights of the first period as on January 31, 2008, have been determined using estimates from the monthly data of the past five years, as between January 31, 2003 and December 31, 2007. Then, the weights of the second period have been calculated using "rolling windows", that is to say shifting the past data forward from one period, and so on and so forth for the following periods.
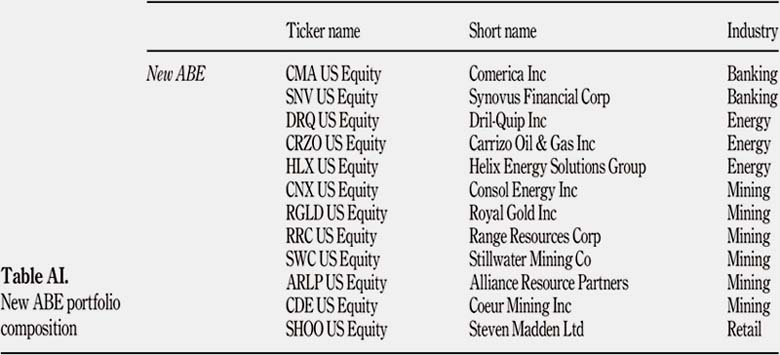
Table VIII shows the yearly loss per TC for each trading strategy. First, TC per share remains the most efficient type of TC for any initial amounts invested under $2,000,000. Once this level is reached, TC per trade becomes preferable. Second, TCs per percentage are inefficient when investing in the new ABE portfolio: the yearly loss associated with TC per percentage is always higher than TC per share and TC per trade.
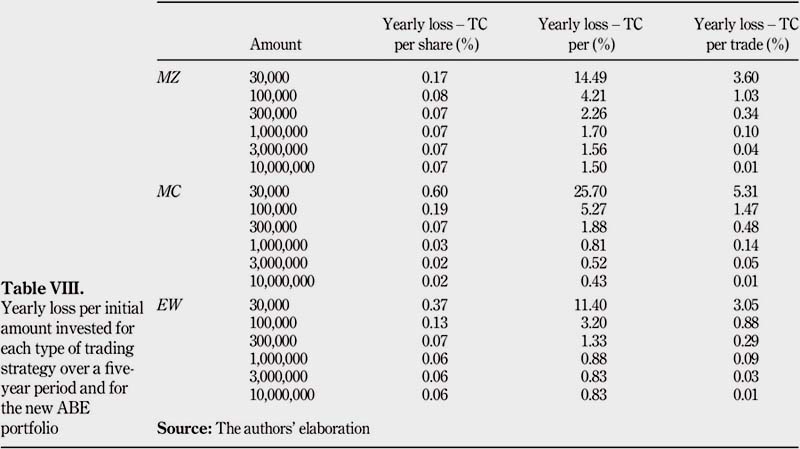
As an MZ strategy is characterized by active portfolio management decisions, the average monthly turnover reaches 17.47 per cent, which is much more than when investing under an EW or an MC strategy. Indeed, the average monthly turnover associated with an EW strategy is 8.75 per cent, and the average monthly turnover associated with an MC strategy is 0.69 per cent. The large turnovers associated with the MZ strategy are explained by the fact that maximizing the Sharpe ratio reallocates very different weights for the stocks from period to period. However, the reason why the MZ strategy is not the most expensive one might be because the rebalancing incurs stocks with large prices, which at the end results in lower TC.
TC per share under an MZ strategy is higher than under an EW strategy. Also, TCs per share under an EW strategy are higher than under an MC strategy. This is the case for any initial amount invested above $300,000. The reason beyond this result is that higher average turnovers are observed when active trading strategies are adopted, for any initial amount invested above $300,000. As a matter of fact, the MZ strategy faces the highest turnover and the highest TC.
The EW strategy faces the second highest turnover and the second highest TC. The MC strategy faces the third highest turnover and the third highest TC. Besides, the fixed component for TC per share and TC per percentage increases a lot the cost of trading. In this connection, higher TC are associated with higher average turnovers. Therefore, there is a positive correlation between TC per share and average turnover: for large amounts invested (i.e. $300,000 or higher), the higher the average turnover, the higher the TC per share. Moreover, TC per percentage under an MZ strategy is higher than under an EW strategy.
TC per percentage under an EW strategy is higher than under an MC strategy. This is the case for any initial amount invested above $1,000,000. This result is also owing to higher average turnovers the portfolio faces when investing under an MZ or an EW strategy than under an MC strategy, as well as large stock inflows and outflows. Finally, it is not possible to conclude on TC per trade: active portfolio management strategies do not seem to affect the performance of TC per trade
3.8 Influence of the number of stocks
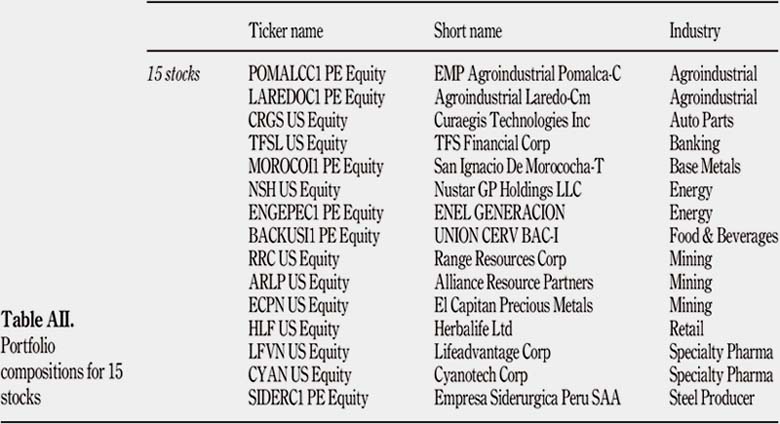
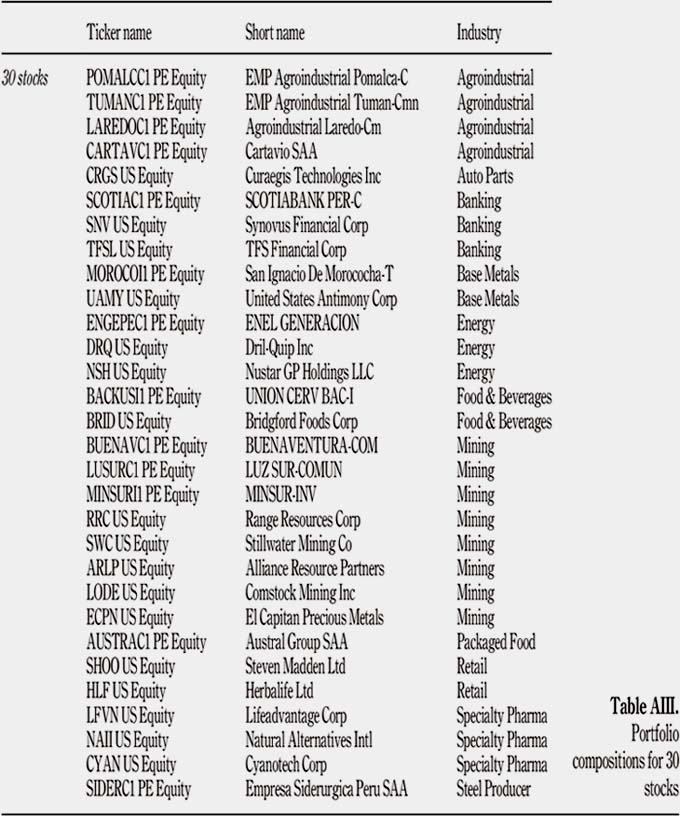
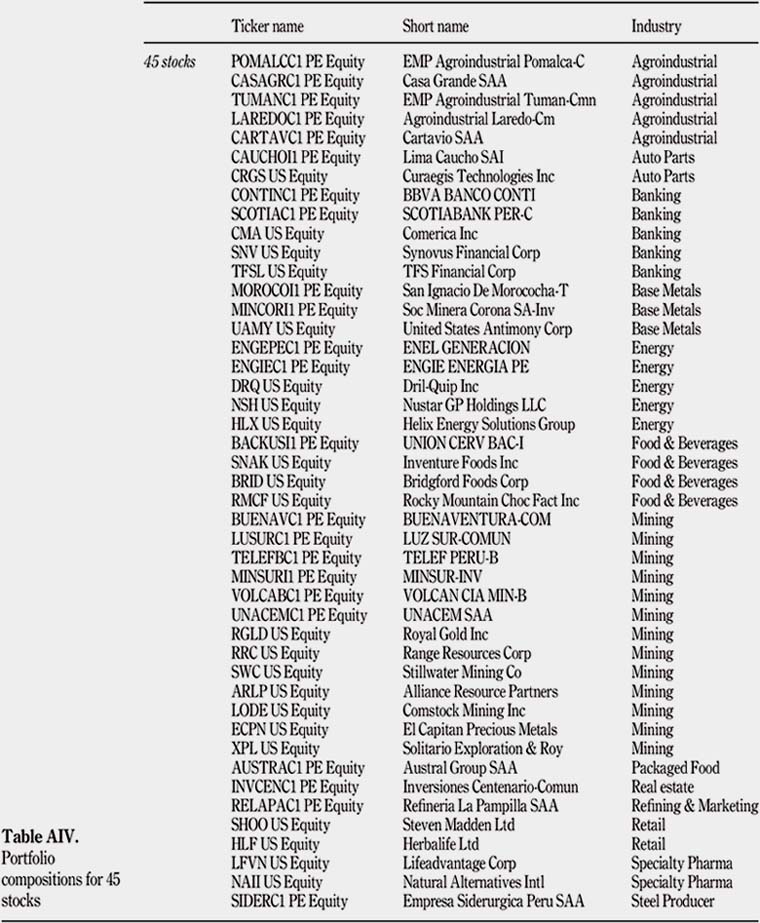
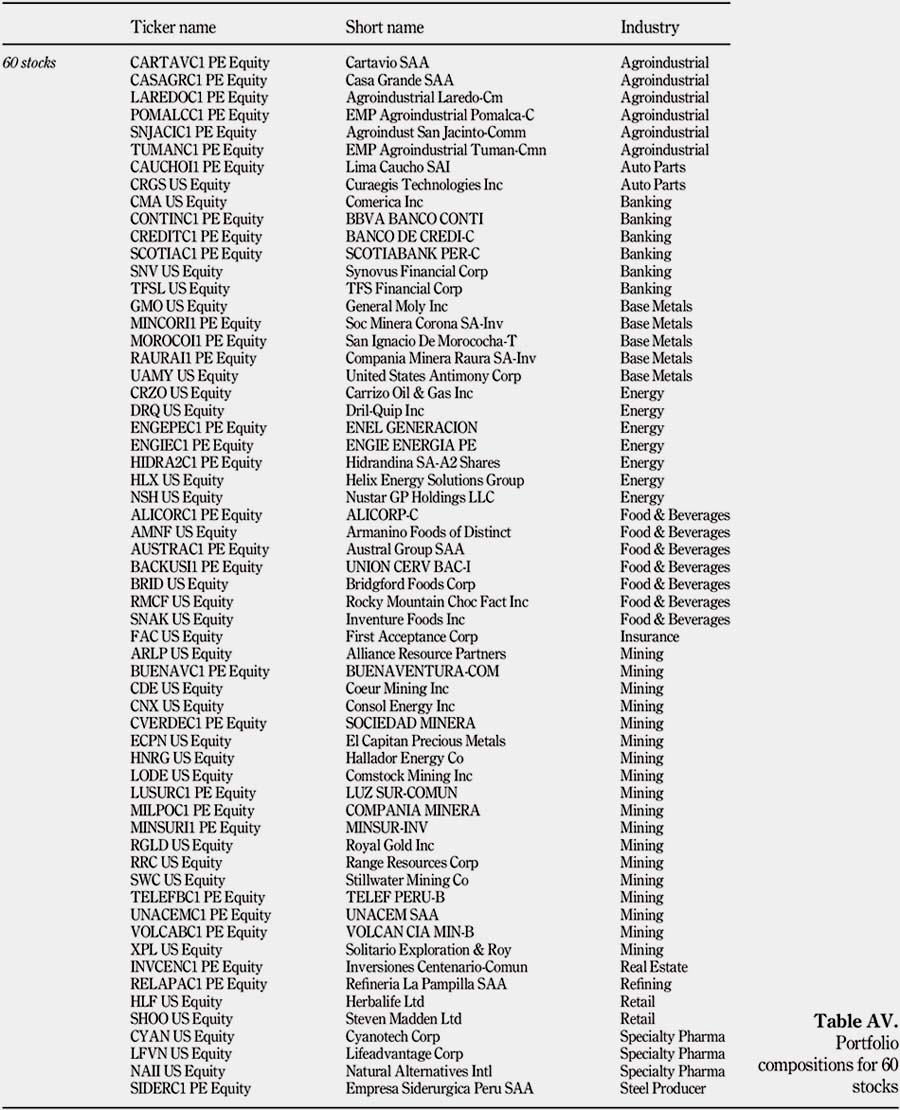
Four portfolios, each of them containing 60, 45, 30 and 15 stocks, have been created to assess the impact of the number of stocks on TC. These portfolios have been built selecting random stocks from our four previous portfolios. The portfolio of 60 stocks contains all stocks analyzed. The portfolio of 45 stocks contains 45 of the 60 stocks. The portfolio of 30 stocks contains 30 of the 60 stocks. The portfolio of 15 stocks contains 15 of the 60 stocks. Each portfolio has been analyzed under an EW strategy, over a five-year period. Table AII""AV present the composition of those three new portfolios. Table IX presents the average turnovers per number of stocks within the portfolio, and Table X shows the yearly loss per initial amount invested for those three portfolios.
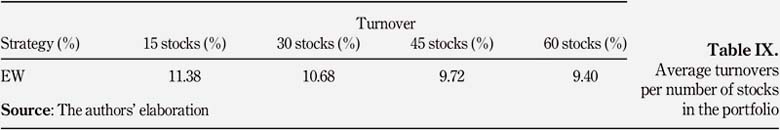
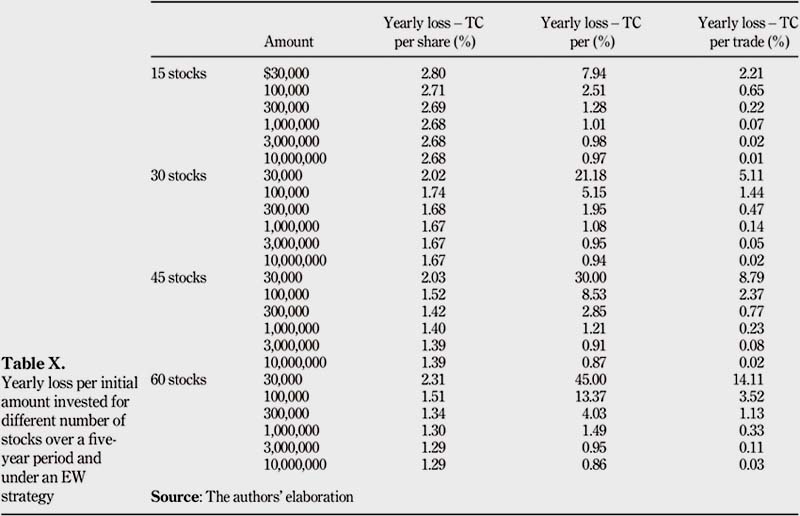
A few observations can be made depending on the number of stocks within the portfolio. First, TC per share decreases when the number of shares in the portfolio increases, for any initial amount invested above or equal to $100,000. This is owing to a decrease in rebalancing when the number of stocks increases. TCs per share remain the most attractive kind of TC for small amounts invested compared with the other types of TC. However, once a specific initial amount invested is reached, switching to either TC per percentage or TC per trade is preferable to TC per share. Second, TC per percentage also decreases when the number of shares in the portfolio increases, for any large initial amount greater than $6,000,000. Third, TC per trade increases when the number of shares in the portfolio increases. The previous results can be explained by the fact that having more stocks in a portfolio implies less average turnovers per stock under an EW strategy. Indeed, average turnovers tend to decrease when the number of stocks increases. There are actually less weight variations for each stock when the portfolio becomes bigger. Finally, TC per percentage never becomes better than TC per trade when the number of stocks in the portfolio increases. TC per trade is always cheaper than TC per percentage, for all three kinds of portfolios (i.e. 15, 30, 45 and 60 stocks), and is preferable to any other kind of TC for any minimum initial amount invested greater than $300,000.
4. Making the TC per percentage competitive
It has been concluded in Section 3 that TC per percentage is the most expensive TC structure. Its fixed component βi is actually very high: an investor trading on the BVL and using a broker has to pay a minimum trading cost of $25. In this section, we explain the last experiment we ran with the objective to make TC per percentage competitive and see how the parameters described in Section 3.4 should change in order for an investor to be able to actively trade on the BVL. The experiment has been run for the PBC portfolio, under an EW strategy, and over a five-year period.
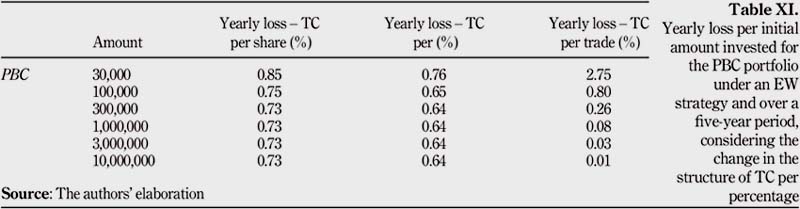
To make TC per percentage competitive, a minimum fixed TC βi of $1 has been imposed. Indeed, TC per share also suggests a minimum fixed TC ai of $1, and that is why the value of $1 for βi has been chosen. Figure 3 shows that the yearly loss associated with TC per percentage is always smaller than the one for TC per share. TC per percentage becomes the cheapest type of TC structure for small amounts invested.
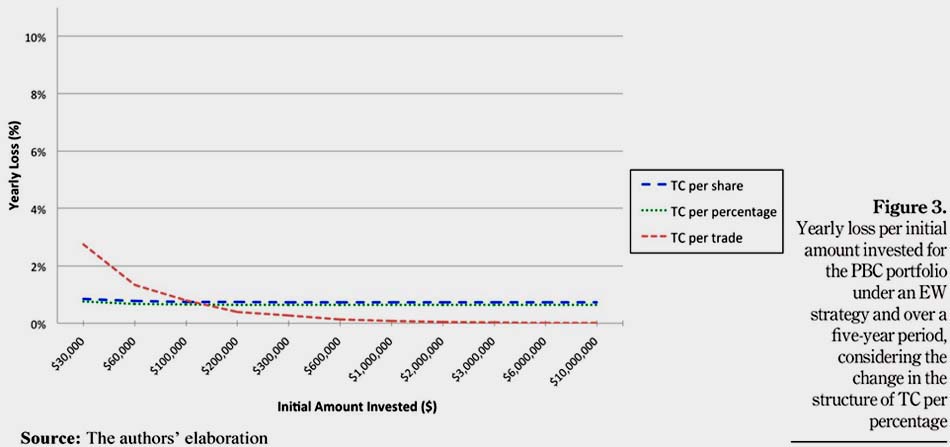
Besides, all yearly losses associated with TC per percentage are below 0.8 per cent, for any initial amount invested. This means that it becomes more attractive for an investor to actively trade on the BVL when β i is equal to $1 than when βi is equal to $25. Table XI presents the new yearly losses associated per type of TC for the PBC portfolio. Also, TC per percentage becomes constant and quickly reaches a limit when the initial amount invested increases. The yearly loss associated with TC per percentage tends to the value 0.64 per cent. Therefore, to successfully invest on the BVL, the β i coefficient has to be lowered. A β i coefficient equal to $25 represents too much TC especially for highly volatile stocks. With a lower β i, investing on the BVL becomes more competitive and close to trading on the NYSE with a TC per share structure for the same types of stock.
5. Conclusions and recommendations
The impact of different types of TC (per share, per percentage and per trade) has been analyzed while focusing on different dimensions: type and number of stocks in the portfolios, holding periods and trading strategies.
Using average parameters for the types of TC considered, trends have been observed and are independent from those dimensions. First, TC per share is the preferable type of TC when investing a relatively small initial amount. Second, once a specific level of initial amount is reached, the investor should switch to either TC per percentage or TC per trade, whichever becomes cheaper than TC per share. Third, TCs per trade are always better than TC per percentage for all dimensions considered.
Moreover, each dimension gives an insight on the cost of trading. First, the effect of the portfolio composition analyzed in Section 3.5 shows that investing in small market capitalization stocks is relatively more expensive than investing in large market capitalization stocks. Second, the effect of the holding period analyzed in Section 3.6 shows that entry and exit costs are diluted when an investor carries a portfolio for longer periods.
Third, the effect of the trading strategies analyzed in Section 3.7 shows that very active portfolio management strategies such as the MZ strategy tend to have larger TC.
Our observations suggest that the Peruvian TCs per percentage are currently very expensive and are efficient only if large initial amounts are invested in a portfolio. From the perspective of an investor trading on the Peruvian stock market, important losses will occur on the portfolio return owing to the TC per percentage structure. As a matter of fact, if an investor decides to invest in a PBC portfolio with $30,000, $100,000 or $1,000,000 in value, the cost of rebalancing will be of at least 3.6 times more than if a TC per trade structure had been adopted. In fact, the yearly losses for $30,000, $100,000 and $1,000,000 under TC per percentage are 10.02 per cent, 2.89 per cent and 0.71 per cent, respectively. On the other hand, the yearly losses for $30,000, $100,000 and $1,000,000 under TC per trade are 2.75 per cent, 0.80 per cent and 0.08 per cent, respectively.
A last experiment has been conducted to see if by changing its fixed component b i , the TC per percentage became more attractive for the Peruvian investor. By imposing a minimum fixed TC b i of $1, we show that the yearly loss associated with TC per percentage is now always smaller than the one for TC per share. The yearly loss associated with TC per percentage is also smaller than TC per trade for any initial amount invested lower than $200,000. Therefore, TC per percentage becomes preferable to TC per share, or TC per trade for a small initial amount invested. TC per percentage becomes a competitive structure and allows investors to adopt active portfolio management decisions while investing on the BVL. Finally, this modified TC policy can attract retail investors and make the BVL a less illiquid stock market.
References
Chalmers, J. and Kladec, G. (1998), "An empirical examination of the amortized spread", Journal of Financial Economics, Vol. 48 No. 2, pp. 159-188. [ Links ]
Cornuejols, G. and Tütüncü, R. (2007), Optimization Methods in Finance, Cambridge University Press. [ Links ]
DeMiguel, V., Garlappi, L. and Uppal, R. (2007), "Optimal versus naive diversification: how inefficient is the 1/N portfolio strategy?", Review of Financial Studies, Vol. 22 No. 5, pp. 1915-1953. [ Links ]
Davis, M. and Norman, A. (1990), "Portfolio selection with transaction costs", Mathematics of Operations Research, Vol. 15 No. 4, pp. 676-713. [ Links ]
Gaivoronski, A.A., Krylov, S. and Van der Wijst, N. (2005), "Optimal portfolio selection and dynamic benchmark tracking", European Journal of Operational Research, Vol. 163 No. 1, pp. 115-131. [ Links ]
Leland, H.E. (1999), Optimal Portfolio Implementation with Transaction Costs and Capital Gains Taxes. Working Paper, University of CA, Berkeley. [ Links ]
Markowitz, H. (1952), "Portfolio selection", The Journal of Finance, Vol. 7 No. 1, pp. 77-91. [ Links ]
Sharpe, W.F. (1964), "Capital asset prices: a theory of market equilibrium under conditions of risk", The Journal of Finance, Vol. 19 No. 3, pp. 425-442. [ Links ]
Further reading
Chavez-Bedoya, L. and Birge, J.R. (2014), "Index tracking and enhanced indexation using a parametric approach", Journal of Economics, Finance and Administrative Science, Vol. 19 No. 36, pp. 19-34.
NOTAS
1. Monthly report of the BVL, April 2017.
2. In 2016, MSCI was close to consider Peru as a frontier market instead of an emerging one.
3. Data taken from the NYSE Group Shares Outstanding and Market Capitalization of Companies Listed (March 2017): nyxdata.com
4. Relevant literature regarding optimal strategies in the presence of TC can be found in Davis and Norman (1990) and Leland (1999). The effects of TC in asset pricing are treated in Chalmers and Kladec (1998) and the references therein. Cornuejols and Tütüncü (2007) treat mean-variance portfolio optimization problems in the presence of transaction costs providing useful transformations to make the aforementioned problems solvable using traditional linear and quadratic programming techniques. Gaivoronski et al. (2005) and Chavez-Bedoya and Birge (2013) implement index tracking and "passive" strategies in the presence of TC.
5. The performance of this strategy was studied empirically by DeMiguel et al. (2007), concluding that is extremely robust and beats more sophisticated strategies in terms of the out-of-sample Sharpe ratio.
6. This trading strategy is inspired in the work of Sharpe (1964) because the capital Asset Pricing Model (CAPM) states that the optimal portfolio is a combination of the market portfolio and the risk-free rate. The market portfolio has weights proportional to the corresponding market capitalizations of the assets involved.
7. The data for each stock consist of the end-of-the-day last prices and current market capitalizations over a monthly period that started on January 31, 2008, and ended on December 31, 2016. The data have been extracted through Bloomberg.
8. Parameters taken at the date of March 1, 2017, on the websites lightspeed.com and tradestation.com
9. Value picked from the SEC website: www.sec.gov/news/pressrelease/
10. Value including retribucion BVL, fondo de garantÃa, retribuciones Cavali, and contribucion SMV.
11. Parameters taken at the date of March 1, 2017, on the websites etrade.com, schwab.com, tdameritrade.com and tradeking.com
12. All the data for market capitalizations for all stocks have been extracted through Bloomberg, within the same time frames as the extraction of the stocks"™ last prices described at footnote 4.
Citation
Chavalle, L. and Chavez-Bedoya, L. (2019), "The impact of transaction costs in portfolio optimization: A comparative analysis between the cost of trading in Peru and the United States", Journal of Economics, Finance and Administrative Science, Vol. 24 No. 48, pp. 288-311. https://doi.org/10.1108/JEFAS-12-2017-0126
Received: 30 December 2017
Revised: 18 April 2018
Accepted: 4 May 2018

