


 Inglés (pdf)
 Articulo en XML
 Referencias del artículo
 Enviar articulo por email
 Citado por SciELO
  Similares en
SciELO
Similares en
SciELO 
 Permalink
Introduction
The stock market is a volatile environment with dramatic moves that give investors positive or negative signs about stock market returns. Both inflation rates and interest rates are two key macroeconomic variables that have great impacts on the economy in general and on the stock market in particular. If an economy experiences high inflation rates, then the real value of money declines which implies less purchasing power, less profitability and a reduction in the real returns on investments. Most of the literature cites the work of Fama’s (1981) hypothesis that reports a negative association between inflation and stock prices. Moreover, an increase in interest rate results in higher expenses, less profitability, also, highinterest rate signals to the market participants that investing in bonds rewards higher return than investing in equities, hence stock prices decrease.
Although the literature includes a consensus about the influence that inflation rate and interest rates have on stock markets, there is an overlap between inflation rates and interest rates, in which there is not a consensus regarding the magnitude and significance of the impact of inflation rates and interest rates on stock prices. Hence, this paper aims at examining the effect of both inflation rates and interest rates on stock prices. The methodology involves a panel cointegration analysis to examine the cointegration between observed stock prices, inflation rates and real interest rates. These relationships are included in the stock duration model (Leibowitz et al., 1989). In addition, this paper examines the Granger causality between observed stock prices, changes in stock prices due to inflation rates and changes in stock prices due to real interest rates.
The paper is organized as follows. The first section presents a literature review about the empirical results of the relationship between inflation rates, interest rates, and stock prices. The second section discusses the stock duration model, the data and statistical testing and section methods. The third section reports the empirical findings. The fourth section concludes.
The association between inflation, interest rates and stock prices: a review of the literature
This section is divided into two parts. The first part highlights the literature that discusses the relationship between inflation rates and stock prices. The second part presents the literature that discusses the relationship between interest rates and stock prices.
The effect of inflation rate on stock returns
The effect of inflation on stock returns has been the subject of extensive research. Starting with the seminal work of Fisher (1930) who suggests that nominal stock returns are a hedge against inflation, therefore an increase in current and expected inflation should increase expected nominal dividend payments. Consistently, Gordon (1959) argues that the discount rate should be determined by the rate of return that investors expect to gain as dividend yield or capital yield on the stock. Therefore, an increase in inflation expectations and actual inflation rates should also increase the expected flow of future nominal dividend payments for stock and this leads to an upward revision of stock prices.
In contradiction with the classical economic theories, the recent empirical literature has not supported the hypothesis that nominal stock returns may serve as a hedge against inflation resulting in “Inflation-stock returns puzzle” (Nelson, 1976; Fama and Schwert, 1977). Most of the empirical literature reports a negative relationship between inflation rates and stock returns in the post-1953 era. Lintner (1975) and Donald (1975) report a negative relationship between inflation and real output and equity prices. The authors claim that as the inflation rate increases, companies try to raise external financing. Regardless of whether debt or equity financing is used as external funds, the company’s real cost of capital rises. This increase will reduce the optimal rate of real growth even if its profit margin is maintained and product demand continues to expand at the same rate.
Nevertheless, Modigliani and Cohn (1979) point out that the real effect of inflation is caused by money illusion. The stock market investors suffer from money illusion because they discount real cash flows using nominal discount rates which will cause behavioral problems that result in inflation-induced valuation errors. The Modigliani-Cohn hypothesis predicts that the stock market will become undervalued during periods of high inflation because this undervaluation should be eliminated once actual nominal cash flows are revealed.
Fama (1981) argues that the negative relationship between stock returns and inflation is derived from the negative relationship between inflation rates and macroeconomic real activity -known as stagflation phenomenon, in which stock returns and real activity are positively related. Consistent with rational expectations theory, stock prices and inflation rates depend upon anticipation of future real activity. Similar results of the negative effect of real variables on the inflation rate and in turn the negative effect of inflation rate on stock return were also reported by Geske and Roll (1983) and Davis and Kutan (2003).
Alexakis et al. (1996) argue that high inflation rates are affecting stock prices due to the volatility in inflation rates and these mainly exist in the emerging capital markets, while economies experiencing low inflation rates have stability in stock prices and these mainly exist in developed capital markets. Several studies agree with the argument that emerging capital markets are mostly affected negatively by the inflation rate. This conclusion isreported by Lokeswar Reddy (2012) in India, Adusei (2014) in Ghana, Uwubanmwen and Eghosa (2015) in Nigeria, Silva (2016) in Sri Lanka and Jepkemei (2017) in Kenya.
The effect of the interest rate on the stock returns
The literature includes many studies that conclude a negative relationship between the interest rate and stock returns (Modigliani, 1971; Mishkin, 1977). A decrease in interest rate leads to higher capital flows to the stock market and expected higher rates of return while an increase in interest rate encourages more savings in banks and that reduces the flow of capital to the stock markets. Pearce and Roley (1985) and Hafer (1986) document that equity prices react negatively to changes in the discount rate. Furthermore, Mukherjee and Naka (1995) and Al Mukit (2013) find that the long run interest rates have a negative impact on the stock market. However, Lee (1997), finds that the relationship between interest rates and stock returns change from significantly negative in an earlier period to about zero and even positive in more recent time intervals. Over time, stock returns are becoming increasingly insensitive to risk-free rates. Nevertheless, Alam and Uddin (2009) examine the relationship between interest rates and stock prices in 15 developed and developing countries and they report that there is a negative association between the two variables. Generally, the literature on inflationrates-stock returns relationship symbolizes an inflation rate-stock returns puzzle, while the literature on interest rates-stock returns relationship asserts a negative relationship.
This section is divided into three parts. The first part presents the equity stock duration model. The second part includes the variables and data. The third part outlays the structure of statistical tests.
Equity stock duration mode
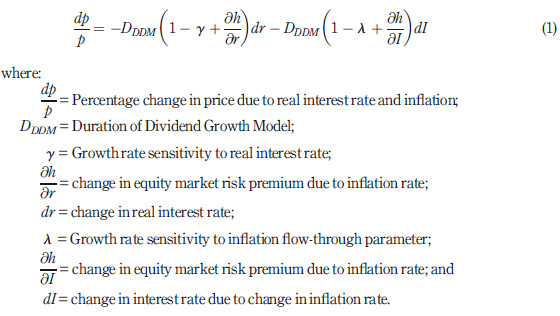
The stock duration model is used to examine the trend and significance of the impact of changes in inflation rates and real interest rates on stock prices (Leibowitz et al., 1989). The term “duration” is defined as a measure of the time-weighted receipt of principal and interestcash flows. This term dates to Hicks (1939) and Macaulay (1938) who demonstrate that duration represents the elasticity of the value of the capital asset concerning to changes in the discount factor. Leibowitz et al. (1989)differentiated between equity stock duration and interest rate sensitivity using the Dividend Discount Model (DDM). The equity stock duration is derived from the valuation technique that is based on DDM. The equity stock duration model takes the form that follows:
Data
The dependent variable is the stock price. The data used are the quarterly stock prices of the non-financial firms listed in DJIA30 and NASDAQ100 over the period 1999-2016. The data is obtained from Reuters finance center©. The independent variables are divided into three categories. The first category includes the main factors in the stock duration model which are the change in stock price due to inflation rates and due to real interest rates. Quarterly data is used for US inflation rate and the interest rate on T-bills. The second category includes dummy variables to capture the effect of a firm’s size based on market capitalization. The third category includes dummy variables that capture the persistence of estimated coefficient in the main factors. The regression estimation equation takes the form that follows:
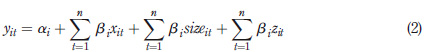
where:
yit = Stock prices (quarterly);
xit = Two main variables which include the change in stock price due to inflation and due to real interest rate
sizeit = Dummy binary variables. Size is classified into small, medium and large capitalization; and
zit = dummy binary variables. These variables include two subcategories. The first subcategory includes high and low levels of inflation rates. The second subcategory includes high and low levels of real interest rates.
Statistical tests
Unit root test. Levin et al.’s (2002) t-test aims at examining the stationarity of the residual of the relationship between the dependent and independent variables.
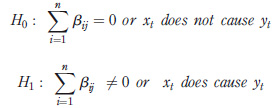
Linearity versus nonlinearity test. This test is addressed and examined using Regression Equation Specification Error Test, or RESET (Ramsey, 1969; Thursby and Schmidt, 1977; Thursby, 1979; Sapra, 2005) in which test involves the two hypotheses that follow:
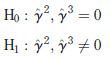
The null hypothesis refers to linearity and the alternative refers to nonlinearity.
Panel Johansen cointegration test. Johansen cointegration test is applied to examine the existence of long run equilibrium between stock prices, the changes in stock prices due to inflation and the changes in stock prices due to real interest rates (Johansen and Juselius, 1990; Johansen, 1988, 1995).
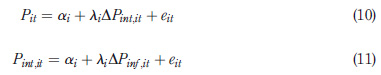
Cointegration regression. As far as the results of Johansen cointegration test reveal existence of cointegration between the used variables, then the following long-run regression equation is estimated:

Granger causality. Granger causality test is carried out to examine the direction of the relationship between the used variables. The Granger causality aggregate formulation takes the form that follows (Granger, 1969; Engle and Granger, 1987):
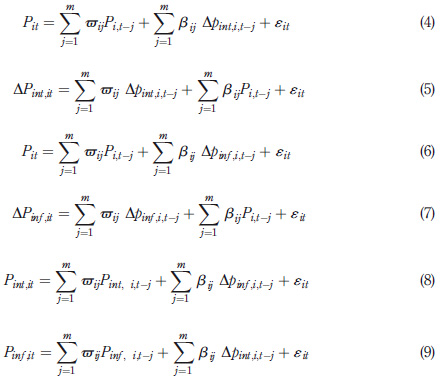
The Granger causality test runs under the hypotheses that follow:
Vector error correction model
The cointegration between variables implies the existence of an adjustment process which is referred to as “error correction model” (ECM) that prevents the errors in the long-run relationship from becoming larger and drifting apart from the equilibrium. The speed of adjustment toward equilibrium is determined by the ECM.
Empirical findings
Unit root test results
Table 1 reports the result of Levin, Lin and Chu unit root test noting that the residual of the relationship between the dependent and independent variable is stationary which implies the validity of applying the unit root test.
Table 1. Unit root test result| Method | Statistic | Probability |
|---|---|---|
| Levin, Lin and Chu t* | -51.738 | 0.00** |
| Notes: *Exogenous variables: Individual effects. Automatic selection of maximum lags. Automatic lag length selection based on MHQC: 0 to 10. Newey-West automatic bandwidth selection and Bartlett kernel. Total number of observations: 6102. Cross-sections included 114; **Significant at 1% | ||
| Source: The authors | ||
Linearity versus nonlinearity test result
The results of the RESET test reported in Table 2 show that the assumption of a linear model fits the data.
Table 2
.| Hypothesis testing using the F distribution | |
|---|---|
| Data input | |
| J | 2 |
| T | 6599 |
| K | 69 |
| SSE-restricted | 2760366061.41 |
| SSE-unrestricted | 2760269876.33 |
| Alpha (Prob) | 0.05 |
| Computed values | |
| df-numerator | 2 |
| df-denomerator | 6530 |
| F | 0.1138 |
| Right critical values | 2.99710703 |
| Decision | Fail to Reject Ho |
| p-value | 0.89246 |
| Source: The authors |
Johansen cointegration test results
The results of Johansen cointegration test reported in Table 3 show that both Trace and Maximum Eigenvalues confirm the existence of a long-run equilibrium between stock prices, changes in stock prices due to inflation and changes in stock prices due to interest rate.
Table 3
.| Unrestricted cointegration rank test (Trace) | Unrestricted cointegration rank test (Max-Eigen) | |||||||||||
| Hypothesized no. of CE(s) | Eigenvalue | Statistic | value at 5% | Prob.** | Eigenvalue | Statistic | value at 5% | Prob.** | ||||
| None* | 0.19899 | 3749.64 | 29.79 | 1.00 | 0.19899 | 1463.09 | 21.13 | 1.00 | ||||
| At most 1* | 0.166108 | 2286.55 | 15.49 | 1.00 | 0.166108 | 1197.81 | 14.26 | 1.00 | ||||
| At most 2* | 0.152201 | 1088.75 | 3.84 | 0.00 | 0.152201 | 1088.75 | 3.84 | 0.00 | ||||
| Notes: *Denotes rejection of the null hypothesis at the 0.05 level; **MacKinnon et al. (1999) p-values. The number of observations = 6813. The lags interval (in first differences) is 1 to 4 | ||||||||||||
| Source: The authors | ||||||||||||
Cointegration regression results
The existence of cointegration implies a valid estimation of long-run coefficients of the independent variables. The results reported in Table 4 belong to the three groups of regressors. The first group includes the main two components of stock duration model which are the changes in stock prices due to inflation rates and real interest rates. The second group includes dummy regressors that measure the persistent effects of inflation rates on stock prices. The third group includes dummy regressors that measure the persistent effects of real interest rates on stock prices. The estimates of these dummy regressors can adequately serve as stress testing.
The results in Table 4 show that the coefficient of change in stock prices due to inflation is negative and statistically significant which conforms to Fama (1981), Mahmood et al. (2014), Muriuki (2014) and Bai (2014) but contrary to Al Oshaibat and Majali (2016). Furthermore, Limpanithiwat and Rungsombudpornkul (2010) and Amata et al. (2016) report a positive relationship between inflation and stock volatility in the short and long runs. On the other hand, the coefficient of changes in stock prices due to the real interest rate is positive and statistically significant. The positive trend of real interest rates indicates that investors move stock prices according to changes in real interest rates. That is, increases in real interest rates drive investors to increase stock prices to stay in the stock market. Furthermore, the positive coefficient of changes in stock prices due to interest rates is emphasized by the significance of the dummy variable for high-interest rates only. This result is similar to the one of Nissim and Penman (2003) who report a positive coefficient between stock returns and nominal interest rates as far as the current study reports a negative relationship between stock prices and inflation. Nevertheless, Amata et al. (2016) report a positive relationship between stock volatility and nominal interest rates in the short run.
Table 4
.| Variable | Coefficient | |
|---|---|---|
| Constant | 31.5484 (58.6160) *** | |
| D in stock price due to the inflation rate (Pinf) | -0.0358 (-2.1738) ** | |
| D in stock price due to the real interest rate (Pint) | 0.0147 (2.3516)** | |
| Small size (Dummy) | -19.3907 (-36.9088)*** | |
| Large size (Dummy) | 9.7176 (14.3226)*** | |
| Dummy for medium level of the inflation rates (MEDinf) | -0.5165 (-0.9234) | |
| Dummy for high levels of the inflation rates (HIGHinf) | 5.0746 (6.7192) *** | |
| Low levels of the real interest rates (LOWint) | 0.5353 (0.9122) | |
| High levels of the real interest rates (HIGHint) | 1.1488 (1.7447) * | |
| Adjusted R-squared | 0.2407 | |
| S.E. of regression | 19.7073 | |
| F-statistic | 260.1996*** | |
| Mean-dependent var | 30.4758 | |
| S.D.-dependent var | 22.6159 | |
| Akaike info criterion | 8.8012 | |
| Schwarz criterion | 8.8106 | |
| Hannan-Quinn criterion | 8.8045 | |
| Durbin-Watson stat | 0.3056 | |
| Notes: The dependent variable is the observed stock price. The estimation method is Fully Modified Least Squares (FMOLS). Outliers are detected and removed. The multicollinearity is examined. All variables are associated with VIF < 5. The long-run covariance estimate; Bartlett Kernel, Andrews bandwidth = 11.00. The coefficients estimates are adjusted using White heteroskedasticity-consistent standard errors and covariance. ***Significant at 1%; **significant at 5%; *significant at 10% | ||
| Source: The authors | ||
Granger causality test results
The results reported in Table 5 show two significant Granger causality relationships. First, the changes in stock prices due to real interest rates Granger cause changes in observed stock prices. Second, changes in stock prices due to inflation rates Granger cause changes in stock prices due to real interest rates. The second result conforms to Taylor (1993) rule which determines the adjustment of interest rates according to changes in expected inflation rates to stabilize the economy in the short term with maintaining long-term growth. It is worth noting that the insignificant causality is documented in other countries such as Kenya (Williams, 2014) and Malaysia (Siang et al., 2017).
Table 5
.| Models | Null hypothesis | F-statisti |
|---|---|---|
| 1 | Changes in stock prices due to inflation do not Granger cause stock prices | 0.15959 |
| Stock prices do not Granger cause changes in stock prices due to inflation | 0.44217 | |
| 2 | Changes in stock prices due to real interest rates do not Granger cause stock prices | 4.58087*** |
| Stock prices do not Granger cause changes in stock price due to real interest rates | 0.50038 | |
| 3 | Changes in stock prices due to real interest rates do not Granger cause changes in stock prices due to inflation rates | 1.34018 |
| Changes in stock prices due to inflation rates do not Granger cause Changes in stock prices due to real interest rates | 43.4298*** | |
| Note: ***Significant at 1% | ||
| Source: The authors | ||
Vector error correction model regression results
The vector error correction model (VECM) regression equations represent the significant equations reported in Granger causality test results that are reported in Table 5:
Equations (10) and (11) are used for estimating the ECM term which is used in turn in the four following VECM models. The estimations of the four VECM models are reported in Table 6:
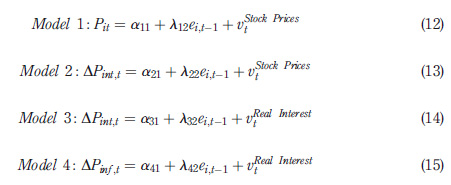
The results of the VECM that are reported in Table 6 show that Model 1 exhibits significant speed of adjustment to long-run equilibrium between observed stock prices and real interest rates. In addition, Model (3) exhibits significant speed of adjustment to long-run equilibrium between changes in stock prices due to real interest rates.
Conclusion and recommendations
This paper examines the effect of the inflation rate and the interest rate on stock prices using quarterly data on non-financial firms listed in DJIA30 and NASDAQ100 for the period 1999- 2016. The estimation procedure utilizes the derivation of Stock Duration Model. Standard statistical analytical methods are used such as Johansen cointegration test, Cointegration regression, Granger causality, and VECM. The empirical findings reveal significant association, in terms of cointegration and causality, between stock prices, changes in stock prices due to inflation rates and changes in stock prices due to real interest rates. Accordingly, long-run coefficients are estimated for the determinants of stock prices. The coefficient of changes in stock prices due to inflation rates is negative and significant which conforms to the results reported in the related literature. On the other hand, the coefficient of changes in stock prices due to interest rates is positive and significant which is opposite to the literature. Hence, increases in real interest rate, for instance, drive investors to increase stock prices to stay in the stock market.
The results of Granger causality test show that changes in real interest rates cause changes in stock prices. Furthermore, changes in expected inflation rates Granger cause changes in interest rates. The results of the VECM reveal the significant speed of adjustment to long-run equilibrium between observed stock prices that respond to changes in real interest rates significantly. In addition, significant speed of adjustment to long-run equilibrium between changes in stock prices due to real interest rates responds to changes in inflation rates significantly.
Table 6
.| Variable | Model 1: stock price equation | Model 2: equation for change in price due to real interest rate | Model 3: equation for change in price due to real interest rate | Model 4: equation for change in price due to inflation rate | ||
|---|---|---|---|---|---|---|
| Constant | 30.4754 (123.5047)*** | -0.30267 (-0.7786) | -0.30267 (-2.8054)*** | 0.566831 (2.477663)** | ||
| RESID01_W | 0.999783 (43.131) *** | -0.029374 (-0.804) | 1.000266 (41.036)*** | |||
| Adjusted R-squared | 0.2213 | -0.000054 | ||||
| S.E. of regression | 19.95819 | 31.4395 | 8.72601 | 18.50404 | ||
| Sum squared residual | 2605074 | 6464412 | 497976.9 | 2239292 | ||
| Log likelihood | -28866.09 | -31838.94 | -23453.68 | -28371.18 | ||
| F-statistic | 1860.294*** | 0.647125 | 78366.43*** | 0.005669 | ||
| Mean-dependent var | 30.4754 | -0.30267 | -0.30267 | 0.566831 | ||
| S.D.-dependent var | 22.61759 | 31.43865 | 31.43865 | 18.50263 | ||
| Akaike information criterion | 8.825462 | 9.734313 | 7.170799 | 8.674161 | ||
| Schwarz criterion | 8.827536 | 9.736388 | 7.172874 | 8.676235 | ||
| Hannan-Quinn criterion | 8.826179 | 9.73503 | 7.171517 | 8.674878 | ||
| Durbin-Watson stat | 0.235759 | 1.854314 | 1.978312 | 1.980405 | ||
| Notes: **Significant at 5%; ***significant at 1% | ||||||
| Source: The authors | ||||||
Policy recommendations
The authors would recommend that stability in stock market activity requires stability in real interest rates which in turn requires as much robust control on inflation rates as possible. The results show robust cointegration between financial investments in the stock market and monetary policy. This cointegration is one virtue of Stock Duration Model.

