


 Inglés (pdf)
 Articulo en XML
 Referencias del artículo
 Enviar articulo por email
 Citado por SciELO
  Similares en
SciELO
Similares en
SciELO 
 Permalink
Introduction and literature review
According to Lusardi and Mitchelli (2007), the importance of financial literacy has developed widely, with the escalating complication of financial products and the growing significance of financial selection, made by households. During recent years, the advent of innovative financial products and instruments has encouraged individual investors to participate actively in financial markets (Calvet, Gonzalez-Eiras, & Sodini, 2004). However, these financial products are substantially complex instruments, which require the investors to be financially literate for optimal investment selection and emerging investment avenues. By following this phenomenon, financial literacy has attained the huge attention of researchers globally. The recent research of Lusardi and Mitchell (2014, highlighted the appropriate improvement methods that have been carried out around the world and concentrated particularly on access to financial understanding and financial literacy. Clark, Lusardi, and Mitchell (2017) defined financial literacy as “the public understanding and information that covers financial services, administration of the financial investments, and various perspectives that appear to be most crucial for the cognizance of household investors, so there would be no asymmetrical information problems associated to the various financial terms - i.e. the interest rates risks, inflation”.
Kristina Zucchi (2018) argued that not only developing countries have financial literacy problems, but the investors, from highly developed financial markets, have also faced financial losses due to ineffective planning, and the inability to identify market uncertainties and risk associated with it. The depiction of these flaws can be highlighted during the financial crises of 2008 (Klapper, Lusardi, & Panos, 2013)
The actual importance of the financial literacy raised during the financial crises of 2008 (Klapper et al., 2013). On one side, the global financial crisis 2008, well known as the subprime mortgage crisis, was the main cause to bring the need for financial understanding in front of market players. The other reason was the two key issues that contributed to the financial literacy’s importance (Agnew, Szykman, Utkus, & Young, 2007). Firstly, the wide range of financial products, which were mostly complex and not comparable, raised the necessity of understanding financial problems (Mandell & Klein, 2009). On the other hand, previous change in social security, all around the world, necessitated individuals to actively participate in their financial management (Aren & Aydemir, 2014).
One of the crucial assumptions, observed in financial crisis, was irrationality (Friedman & Kraus, 2011) among the financial behaviour of investors due to lack of financial knowledge, which has been highlighted particularly in the field of behavioral finance. In traditional financial theories, it is assumed that financial markets and its participants are rational in decision-making (Ackert, 2014), such as modern portfolio theory by Markowitz (1999), capital asset pricing model by Sharpe (1977), and two factor or three-factor model by Fama and French (1993). In contrast, Barberis and Thaler (2003) argued that behavioral finance is a relatively modern financial subject, seeks to summarize the combination of behaviour and cognitive factors that influences irrational financial decisions. It is also based on the exceptional idea that the majority or at least a significant minority of investors are influenced by their behavioral biases, which leads to less rational or fully irrational decision-making. These biases are empirically acknowledged under cognitive psychological theories; one of them is ‘Prospect Theory’ proposed by Kahneman and Tversky (1979) that shows the patterns of decision making and portfolio selection in risk prevailing situations.
Many types of research on financial literacy have been exercised globally, on behalf of different countries, to scrutinize financial literacy. The Global financial survey conducted by World Bank Financial Governance Consumer Protection in Financial Services Program ("Report on the Key Findings of the Survey prepared for the World Bank", 2010) studied the improvement levels of consumer protection and financial literacy, thereby, supporting investor confidence in the financial areas.
President's Advisory Council on Financial Literacy (PACFL) clarified financial education as the ability of an individual to devour learning and financial skills to oversee financial assets competently for monetary welfare. PACFL also clarified financial skills as a capacity to make utilization of investor's intelligence and aptitudes to successfully oversee and productively manage monetary assets over a lifetime to accomplish budgetary welfare (Schwab et al., 2008).
The study of Awais, Laber, Rasheed, and Khursheed (2016) stated that some of the households lacked the most common observable information while taking crucial financial decisions for their wellbeing. However, Reich and Berman (2015) raised various questions about the extent of the effectiveness and influence of financial learning on financial literacy. Thus, Sayinzoga, Bulte, and Lensink (2016) highlighted the contradiction that exists between the efficiency of financial education in enlightening financial literacy and its ultimate influence on investor’s short-term and long-term behavior. Moreover, Sundarasen, Rahman, Othman, and Danaraj (2016) expressed that financial literacy accelerates the efficiency of cash flow management, credit risk management, saving, and investment with higher extent.
To discover the measures of financial literacy, Remund (2010) inspected the majority of the measures of financial literacy and recognized the absence of typical measures, for clarifying and estimating financial education, and demonstrated financial literacy as a degree to which one has the capacity to comprehend common and crucial financial ideas. Whereas, Fernandes, Lynch Jr, and Netemeyer (2014) measured the relationship between financial literacy and financial education in association with financial behaviors by using meta-analysis.
Volpe, Chen, and Pavlicko (1996) measured investment knowledge by forming 10 multiple choice questions (Ergün, 2018). Hilgert, Hogarth, and Beverly (2003) evaluated the level of financial literacy by using twenty-eight true/false financial skills questions with investment, spending, saving, cash inflow, and outflow and other macro factors as variables. Furthermore, Clark et al. (2017) empirically evaluated financial knowledge from 3 questions on Portfolio Diversification, Real and nominal interest rates, and the time value of money.
In Pakistan, the project named Access to Finance Survey 2008, conducted by Fin-Mark Trust in support with the State Bank of Pakistan was the initial step towards financial literacy measuring financial knowledge and patterns of household investment. This study concluded that only 14 percent of the experimental population formally participated in the stock markets, while the other 40 percent were not part of any formal or informal financial activities. It also concluded that a higher level of education, as well as a higher level of income, is the biggest source of enhancement in accessing broad financial education.
In some cases, understanding behavioral finance, in an ostensible sense, directly highlights the relationship between financial education and different characteristics of financial behavior (Ates, Coskun, Sahin, & Demircan, 2016). A survey, conducted on Turkish monetary clients on their acquiring behavior, suggested that financial clients with a higher degree of financial education are rather more anticipated to use their credit cards in a sufficient and educated way (Sevim, Temizel, & Sayılır, 2012).
Previous studies, such as modern portfolio theory, have shown that investors are risk-averse, which means that among two investment alternatives, the investor will choose the one with lower risk (Calvo-Silvosa, Antelo, & Soares, 2017). To choose optimal investment portfolio, which occupies the efficient parts of the risk-return spectrum, another term introduced in modern portfolio theory known as “Efficient Frontier”, also named as “Markowitz Bullet” (Lee & Yoo, 2017). One financial economist, Fama (1970) mentioned, in his article, the need for efficient market theory named “Efficient Capital Markets”.
As shown by Ritter (2003), behavioral factors are dependent on attitudes just as human judgment procedures have been dependent on several cognitive illusions and biases. Those illusions are distributed in two categories: biases produced from heuristic judgment procedure and illusions, embedded in the implementation of mental structures, categorized in the prospect theory (Bakar & Yi, 2016). The most significant cognitive bias is heuristics. Heuristics are characterized as the rule of thumb, which resolves the basic decision-making problems, particularly in complicated and problematic conditions (Ritter (2003), by decreasing the unpredictability of evaluating probabilities and anticipating values of simpler judgments (Reason, 1990). Daniel Kahneman and Amos Tversky (1974) are the ones, who initially focused on heuristics and recognized three heuristics to be specific Representativeness, Availability bias and Anchoring (Tversky & Kahneman, 1974). Waweru et al. (2008), likewise, list two elements named Gambler’s fallacy and Overconfidence into heuristic theory (Waweru et al. (2008).
Modern finance perspective indicated that investors do not always act irrationally, and they contribute their funds by examining the risk and reward and face a lot of psychological and sentiment biases (Kahneman & Tversky, 2013). Kahneman and Tversky (1979 defined prospect theory as a substitute to standard models, which gives a superior image of practical behavior. Prospect theory depicted few perspectives influencing decision-making behavior including regret aversion, loss aversion, and mental accounting (Waweru et al., 2008). Regret aversion is a feeling happens after individuals commit errors (Fogel & Berry, 2006). Loss aversion states the distinctive level of perceptual biases that individuals face from comparative size profits and losses (Barberis & Thaler, 2003). Whereas, mental accounting is defined as "the procedure by which individuals consider and assess their Financial events" (Barberis & Huang, 2001).
De Bondt and Thaler (1985) expressed, about financial market factors, that they can be influenced by individual investor’s conduct in the method of behavioral finance. Waweru et al. (2008) recognized the components of the market that affect an individual’s decision making, which are price fluctuation, available market information, prior patterns of stocks, consumer inclination, over-response to value changes, and essentials of principal stocks. Barber and Odean (2013) underscored that investment holders are affected by occasions in the securities exchange that attract them.
Whereas, the herding effect, observed in the stock market, is recognized as the propensity of investor’s practices to track other’s activities (Tan, Chiang, Mason, & Nelling, 2008). In the viewpoint of behavioral finance, herding bias influences some enthusiastic biases, including similarity, congruity and intellectual clash, the home bias, and chitchat (Kallinterakis, Munir, & Radovic-Markovic, 2010). Waweru et al. (2008) concluded that purchasing and offering choices of investors are fundamentally affected by other’s selection, and herding behavior encourages investors to have a feeling of regret avoidance for their choices.
By the review of the above studies, it has cleared that without financial literacy it is impossible to make decisions about complicated investment avenues and it’s extremely difficult to mitigate the behavioral biases faced by investors. However, in order to find the true relationship between financial literacy and behavioral biases of individual investors, this paper aims to contribute towards the importance of financial literacy and depicts the empirical evidence on this relationship in the context of Lahore. So precisely, this research paper is focused on measuring basic financial literacy, identifying the possible behavioral biases, and determining the relationship between financial literacy and behavioral biases of individual investors at Lahore.
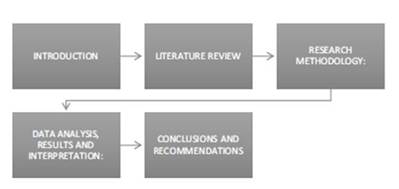
This paper is structured in different sections as shown in Figure 1. Section 2 describes the data collection. Section 3 discusses the empirical strategy. Section 4 shows the analysis and results. Finally, Section 5 provides conclusions and recommendations.
Data
This research is entirely based on primary data that was collected by using a descriptive survey technique. Primary data was taken, because it provides accurate as well as real time data that has not been used previously. For data collection, structured questionnaires were prepared and provided to groups of institutions located in Lahore. These questionnaires were filled by individual investors, who have invested in shares, bonds, etc.
The structured questionnaire consisted of three parts: The first part was intended to collect some basic demographical information about investors and their preferred investment avenue. This part included gender, age, area of specialization, sources of financial information, average income level, preferred investment avenue, and frequency of information. The second part of the questionnaire was proposed to obtain the level of financial literacy, among the individual investors. This part was developed by using 20-items on the financial knowledge scale; produced by Knoll and Houts (2012) and 10-items on the financial sophistication scale of Lusardi and Mitchell (2014). To measure the financial literacy of individual investors at Lahore, different items were selected from both scales in a modified manner as shown in Table 1.
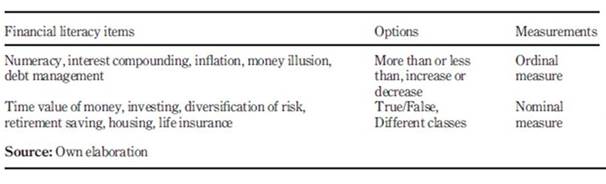
This part consisted of multiple statements and different financial concepts were summarised in the following way: numeracy, interest compounding, inflation, time value of money, money illusion, investing, diversification of risk, debt management, retirement saving, housing, life insurance, and annuity. Finally, the third part included 29 statements, which were intended to measure the level of behavioral biases. All these statements were measured by using the five-point Likert scale.
These questionnaires were entered into SPSS by coding each question’s answer with a numeric value and considered each question as a variable and then all biased questionnaires were removed due to their missing values and illogical ratings.
According to statistics obtained from the Central Depository Company (CDC) of Pakistan, the number of retail investor’s sub-accounts is 245,975 as of June 2018, whereas the total investors from Lahore represent 40 percent of overall individual investors. The sample size was obtained by using the following formula:
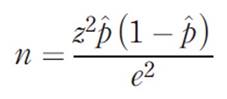
Where the level of confidence was 95 percent, sampling proportion (p) was observed as 50 percent, and the margin of error was equal to 5.6 percent. The calculation revealed the approximate sample size of 300 observations.
Thus, a sample of 300 was obtained from the individual investors at Lahore and it was suitable enough to ensure the significance of the relationship between financial literacy and behavioral factors of individual investors. During the research, the area of data collection was confined to the capital market of Lahore, as it was not possible to gather data from the entire population of Pakistan, due to some associated barriers such as lack of time, extensive cost, and massive exertion in data collection.
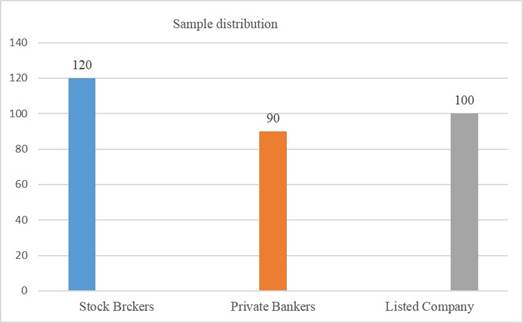
Furthermore, our study implemented a Multi-Stage sampling technique. At the first stage, the capital market was bifurcated into different groups of institutions which act as market players, such as corporations, institutions, investment banks, and public accounting firms, and randomly selected three groups of institutions i.e. private banks, brokerage firms and listed companies and each group was individually called as strata, as shown in Figure 2. In the second stage of sampling, investors were randomly selected from each group of institutions. The questionnaires were equally allocated among these groups and it was assured that the individuals have done recently some real-time investment in Pakistan Stock Exchange.
Empirical strategy
In this research, behavioral biases are taken as the dependent variable, which included Representativeness, Overconfidence, Anchoring, Gambler’s fallacy, Availability Bias, Loss Aversion, Regret Aversion, Mental Accounting, and Herding Bias. The questions related to these biases contains 29 statements, measured using the ordinal 5-Point Likert Scale (Strongly disagree to Strongly Agree).
To conform to the structure of our research, financial literacy is taken as the independent variable. This variable was first measured by using 21 statements of financial literacy and each correct response was given with 1 score. By summing up, the new variable was generated and named as the financial literacy score. The average score obtained was 12.30. The score obtained above 12 was considered as investors with high financial literacy, whereas the score below 12 was considered as investors with a low literacy rate.
To reduce the hidden effect of confounding variables, demographics are used as a control variable in the regression model. These variables include gender, age group, educational level, area of specialization, source of financial information, average income, preferred investment avenue, and frequency of information. Each variable is used as a categorical variable. Furthermore, the ordinal regression model is used to check the relationship between financial literacy and behavioral biases of individual investors, this regression is repeated for every bias. The regression model is shown as follows:
y (Behavioral Bias) = b0 + b1(Fliteracy_Score) + b2(Gender) + b3(Age group) + b4(Edu) + b5(Specialization) + b6(Income) + b7(Info_Source) + b8(Pref_Investment) + b9(Freq_Info) + ei
The dependent variable y is formed by coding the values of behavioral biases with numeric values. Similarly, demographic variables are recoded as follows: gender variable has a value of 1 if male and 0 otherwise, age group has a value of 1 if below age of 35 and 0 otherwise, educational background has a value of 1 if graduate or postgraduate and 0 otherwise, area of specialization has a value of 1 if business related and 0 otherwise, average income has a value of 1 if below Rs 60000 and 0 otherwise, Info source has a value of 1 if from parents or friends and 0 otherwise, preferred investment has a value of 1 if it is shares or bonds and 0 otherwise, and frequency of information has a value of 1 if less than month and 0 otherwise.
Different statistical methods are used to verify the reliability of data such as descriptive statistics, factor analysis, and reliability test using Cronbach’s Alpha as the most preferred reliability instrument. The linear regression model is also used in the analysis to detect Multicollinearity with help of collinearity statistics that show tolerance level and Variance Inflating Factor (VIF). This process used ANOVA tests to ensure that the model fits on our sample appropriately with the significant value of F-test. T-value and P-value are used to check the significance level of Beta-Coefficients at the Confidence Interval of 95%.
Hypothesis statements were formed for each of the dependent variables. The hypothesis testing was based on main and sub-hypothesis. However, the main hypothesis of the research is: The increases in the level of financial literacy reduces the likelihood of occurrence of behavioral biases affecting individual investor’s decision making.
Data analysis and results
According to the data collected, most respondents were males that represent 77.77 percent of the total sample. The age variable was valued by four age brackets: below 25 years, 25-35 years, 35-50 years and above 50 years. The result shows that 112 respondents were below 25 years old, 107 respondents were between 25 to 35 years old, moreover, 88 of the respondents belonged to age between 35 to 50 years old, whereas only 3 respondents belonged to age above 50 years old. The outcomes showed that 69 respondents belonged to postgraduate, 127 respondents belonged to the university, whereas 101 from college, 1 from secondary, and 2 from primary education. However, 98 respondents earned below Rs 30,000, 126 of them earned between Rs 30000 to Rs 60000, 58 of them earned between Rs 60000 to Rs 100000 whilst the remaining 18 earned above Rs 100000.
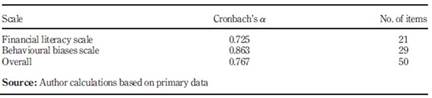
The scales of financial literacy and different factors of behavioural biases are tested using Cronbach’s alpha to ensure that variables are reliable for further use. According to Cronbach’s alpha, the financial literacy score is reliable at 0.725 whereas, behavioral biases are reliable at 0.863. However, the overall outcome is shown in Table 2. This result describes higher internal consistency among variables.
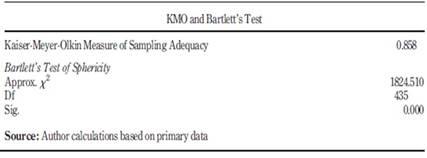
Factor analysis is used to explain the variance or covariance among the observed variables, and to identify the set of variables also called dimensions. In our research, Exploratory Factor Analysis is used to identify the factors based on variables of financial literacy and behavioral biases (2nd and 3rd part of the questionnaire). To make the factor analysis reliable for the data, Kaiser-Meyer Olkin (KMO) and Bartlett's Test of Sphericity are used to check the sample precision. The result of this experiment is shown in Table 3.
Another technique was used to describe the total variance explained, which must be greater than 50 percent (Ali, Zairi, & Mahat, 2006). However, in our case, it was 61.50 percent, which has shown the factors to be retained until the last factor.
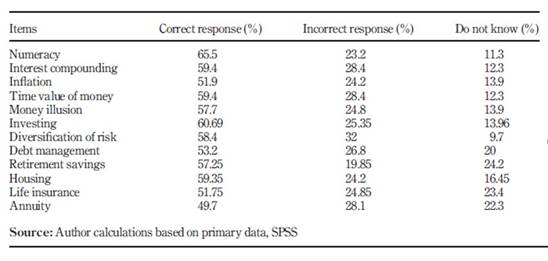
As specified earlier, financial literacy is measured by financial knowledge scale containing 21 statements, which was developed by modifying 20-items on the financial literacy scale presented by Knoll and Houts (2012) and 10-items on the financial sophistication scale of Lusardi and Mitchell (2014). According to the data, more than 50 percent of respondents answered correctly, more than 25 percent answered incorrectly, whereas more than 20 percent didn’t know about the financial literacy items. In financial literacy items, numeracy is responded correctly at the highest rate of 65.5 percent, whereas an annuity is answered correctly at the lowest rate of 49.7 percent within all items. The response rate is shown in Table 4.
Another analysis is conducted to check the relation between financial literacy and demographic variables. In this analysis, financial literacy is bifurcated into two parts i.e. high financial literacy and low financial literacy. High financial literacy represents a literacy score of 12 and higher, whereas low financial literacy represents a literacy score of 11 and lower. The T-value of each relationship is significant at 2 or higher as a rule of thumb. In our case, only two demographics have a significant relationship with financial literacy.
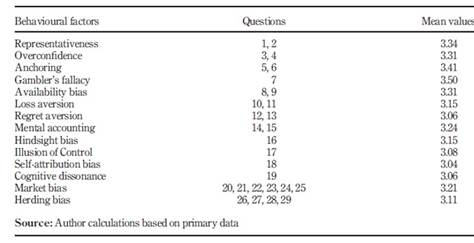
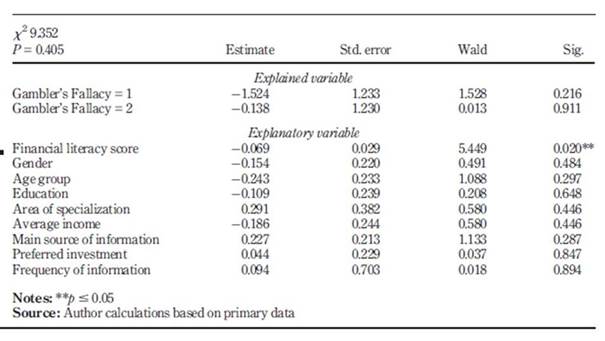
Analysis of behavioural biases is the second crucial part of research because it oscillates amongst individual investors at an extensive level. To measure the bias level of the individual investor, factors with an average of more than 3 are presumed to have biasness in their investment decisions. However, this study indicated that with an increase in financial literacy, the likelihood of biasness in investment decisions reduces. The highest level of biasness is detected in gambler’s fallacy with an average of 3.50, whereas the lowest level of biasness is shown by self-attribution bias with an average of 3.04. The mean values of behavioural biases are shown in Table 5. All factors have more than 3 levels of biasness, this depicts that individuals face a high level of behavioral biases while participating in investment avenues.
As control variables have a crucial role in our regression analysis, it is mandatory to figure out the sole impact of demographic variables on behavioral factors. According to results, gender significant relationship between representativeness, overconfidence, and illusion of control, age group is significant with loss aversion and market factors bias, education level is significant with representativeness, market factor and cognitive dissonance, average income is significant with regret aversion, market factors, and overconfidence, whereas source of financial information have significant relation with majority of behavioral biases i.e. overconfidence, availability bias, loss aversion, regret aversion, mental accounting, market factors.
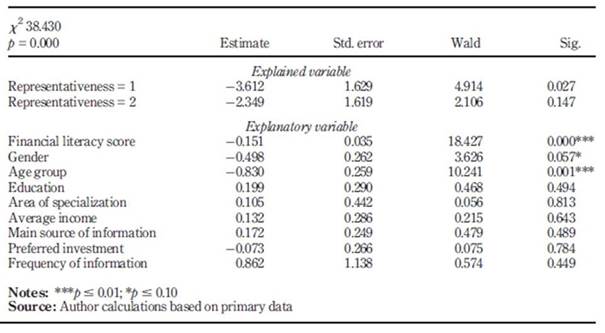
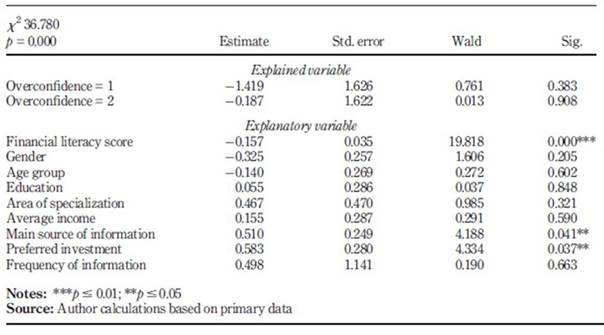
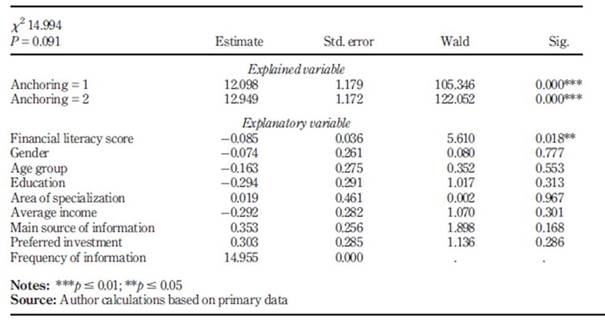
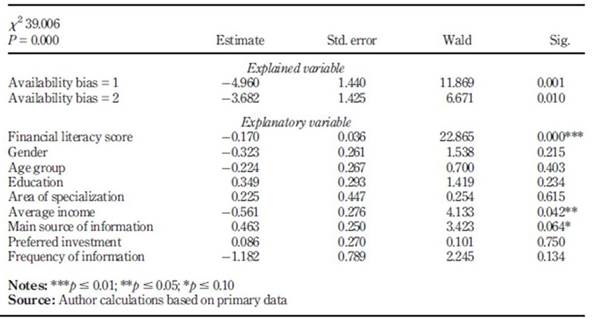
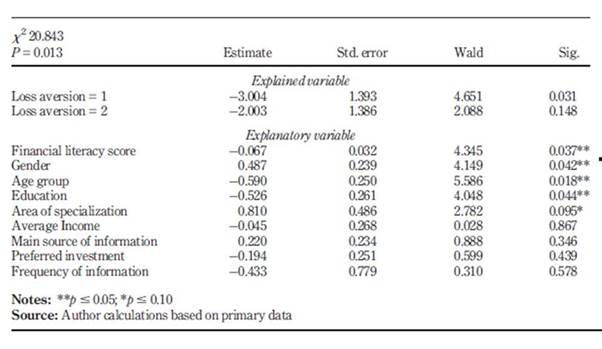
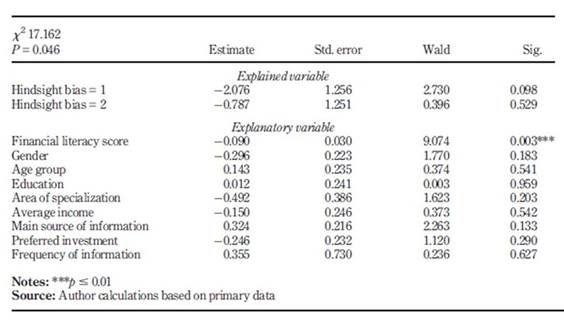
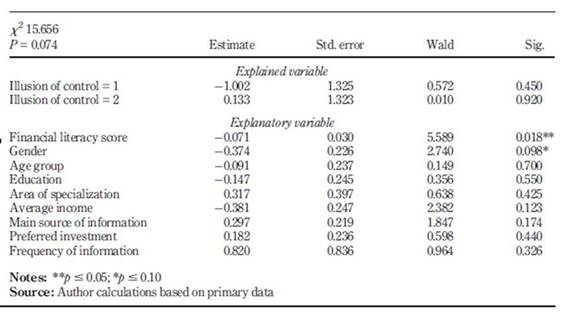
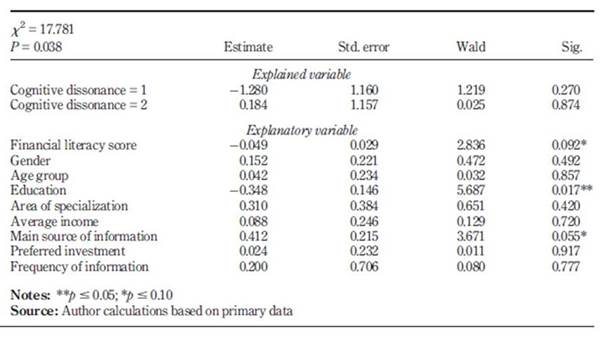
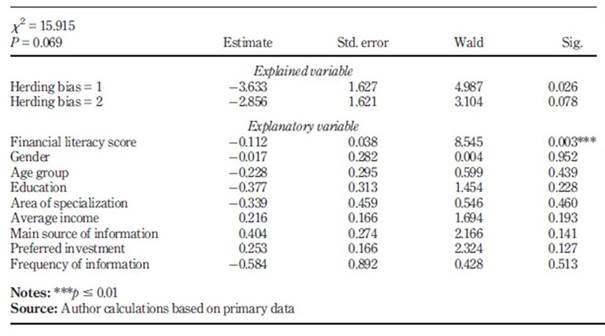
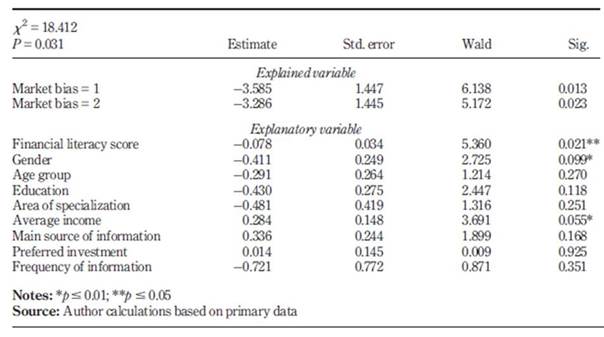
This is the most central part of our research, in which ordinal regression analysis is conducted for each one of the behavioral biases. The analysis and its results entirely comply with the research hypothesis that has been articulated in Research Methodology. Table 6 7, 8, 9, 10, 11, 12, 13, 14, 15 and Table 16 show the results of ordinal regression model.
Analysis initiates with the ANOVA tests to ensure that the model fits on our sample appropriately by applying a linear regression model. The ANOVA table is used to ensure the value of the F-test significance. Multicollinearity is detected with the help of collinearity statistics that show tolerance level and Variance Inflating Factor (VIF). Durbin-Watson test is used for autocorrelation, which is always between 0 and 4. Breusch-Pagan-Godfrey test is used for heteroskedasticity that is in our case significant at 1% for all biases. T-value and P-value are used to check the significance level of Beta-Coefficients at the Confidence Interval of 95%.
The analysis of data by using the Ordinal Regression model showed diverse outcomes. In that part of the analysis, we dropped some behavioral biases due to insignificant results which included self-attribution bias, regret aversion, and mental accounting. The remaining variables were taken in analysing the relationship between financial literacy and behavioral biases. The regression analysis showed that there’s a negative association between financial literacy and behavioral biases and 10 out of 14 behavioral factors including representativeness, overconfidence, availability bias, loss aversion bias, hindsight bias, the illusion of control, cognitive dissonance, herd behavior bias, and market bias had a significant relationship with financial literacy. However, the R-Square of the regression is slightly lower which means that various other factors have a significant impact on behavioural biases of the individual investor.
Conclusion
The fundamental objective of the research was to identify the extent of the relationship between individual investor’s level of financial literacy and the level of behavioural biases in Pakistan. The research findings were initiated with demographic variables, which concluded that male respondents have more financial literacy than female respondents and most of them have age below 25. Based on education, most of them belonged to university graduates, had business related specialization, and had an average income between thirty thousand and sixty thousand. Most of the respondents use periodicals or the internet as their main source of information and preferred shares as their investments. Based on basic financial literacy concepts, our findings concluded that most of the respondents had high financial literacy. On the other hand, most of the respondents had a high level of biasness in decision making.
According to the obtained results, it is concluded that there is a strong negative relationship between financial literacy and behavioral biases of individual investors. This means that with an increase in the level of financial literacy, the likelihood of investors facing behavioral biases reduces. However, Abreu and Mendes (2010) concluded that there is a low level of financial literacy of female investors than male investors. In contrast, Sezer and Demir (2015) claimed that there is no association between gender and behavioral factors. It is observed that individual investors have a high level of cognitive biases specified in this research. Among these cognitive biases, representativeness, anchoring, and gambler’s fallacy biases are highly influencing investor’s decision making (Chen, Kim, Nofsinger, & Rui, 2004). It is observed that anchoring bias leads investors to assign his thoughts to current experience, and make their investment decisions upon attained experiences, despite its rationality. So precisely, investors believe that through initial information he will outperform the market. However, gambler’s fallacy bias provokes investors to prefer betting to speculate over the investments (Pompian, 2011).
Based on the above facts, it is recommended that the Capital Markets Authority of Pakistan i.e. Securities and Exchange Commission of Pakistan, should spread the wide-ranging financial learning and Government funded training program that incentivizes the individual investors. It is subsequently suggested that research on a similar topic should be repeated at numerous areas, various institutions, and different age groups of Pakistan, to ensure the reliability in the association between financial literacy and behavioral biases of individual investors in numerous areas of Pakistan.
However, various behavioural factors were not adopted in this research like framing, over-optimism, and confirmation, etc. So, it is recommended for future studies to apply these factors and to explore more behavioural biases among different areas of Pakistan. Whereas in the field of financial literacy, we applied basic financial concepts that helped measure financial literacy, so it is recommended that for more accuracy, advance financial concepts must be used among various areas of Pakistan.

