


 Inglés (pdf)
 Articulo en XML
 Referencias del artículo
 Enviar articulo por email
 Citado por SciELO
  Similares en
SciELO
Similares en
SciELO 
 Permalink
Introduction
The private banking market is one of the most important sectors in developed and developing economies, and now is returning for interest to policy-makers, because banks are institutions that inject money in the economy and help to boost it when there are problems in some markets, especially in productive sectors. Also, Goddard and Wilson (2009) mentions that most households and businesses engage in transactions with banks, for deposits, loans, and other financial services, and banks perform a vital economic function in channelling funds from savers to investors, and in the monetary policy transmission mechanism.
In this sense, banking competition helps to foster higher economic growth (Buchs and Mathisen, 2005). It enhances the efficiency as it compels managers to cut down on costs in order to remain profitable (Claessens and Laeven, 2004). Also, banking competition facilitates banks to satisfy the needs of the public at a reduced social cost and enhances the efficiency of the production and quality of financial services and products. For this, Claessens and Laeven (2004) argued that a reduction in the level of competition in the banking sector will make provision of financial services costly leading to less financing which impedes economic growth.
According to this, Bikker et al. (2012), Yildirim and Philippatos (2007), and De Bandt and Davis (2000) analyse not only the competition in the banking industry but also the banking competition by size group and conclude that large and small banks (not medium banks) operate in monopolistic competition in many countries. However, other authors like Berger and Black (2011), De Haan and Poghosyan (2012), and Uchida, Udell, and Watanabe (2008) argue that banks by size group have different characteristics to lend on different firms size, this situation depends on the type of credit and the type of firm that borrow.
The main purpose of this study is to assess the competition and analyses if there are differences between sizes (regarding competition) in the private banking sector using a non-structural approach developed by Panzar and Rosse, we compare four estimation techniques to obtain the competition degree for each group of banks segmented by size and we also test if the market is in long-run equilibrium. Camino-Mogro and Armijos-Bravo (2018) assess the banking competition in Ecuador controlling by size; however, it is notorious in Ecuador that private banks compete not only in the entire market but also in sizes, that is, small banks have their credit segment, different from large and medium banks. In this sense, we compared banks by size using a reduced price and revenue equation, to get robust evidence intra-banking competition.
This paper contributes to the actual literature of competition degree in two ways. First, different to traditional papers, we assess the degree of competition in the Ecuadorian private banking sector using the bank size classification and take advantage of this issue since competition by size could be different because there is a banking specialization in terms of size, levels of liquidity, risk and other indicators that are different from one group to another. Second, we show the robustness of our results using a scaled and unscaled equation using many controls and similar to Apergis, Fafaliou, and Polemis (2016), we use the panel corrected standard error and feasible generalized least square to contrast the value of H-statistic obtained by Pooled Ordinary Least Square, Fixed Effects and Random Effects.
Another important issue is that Ecuador is a dollarized emerging economy and the unique in South America with some financial system characteristics such as it is not allowed that a foreign bank has more than 50% participation on a national bank, there is a tax applied on the exit of local currency to foreign locations which decreases the participation of foreign firms in the financial system; it is not allowed that the Central Bank acts as a lender of last resort; there is a liquidity fund constituted from contributions of financial institutions, and banks also have the obligation to set up a guarantee trust equivalent to 100% of its assets. All these applied regulations generate an important interest in studying the level of private banking competition in Ecuador, to be able to know whether, in addition to contributing with a healthy financial system, they helped or not to improve the competition.
Using annual data on the private banking sector in Ecuador for the period 2000-2015, we find that bank size decreases competition, in particular, large banks operate in a monopolistic environment, while medium and small banks operate in a monopolistic competition but tend to be perfect competition. Our results show that the degree of competition is different by bank size, in this line, we propose the analysis of banking competition by the disaggregation of group size when there are huge differences in bank characteristics across size, due, for example, to the different types of loans offered by each bank (specialization).
The paper is structured as follows: Section 2 gives an overview of the Ecuadorian private banking sector. Section 3 provides a literature review about banking competition, banking concentration, and bank size. In section 4 we present our data and the empirical method used. We provide our empirically results in Section 5. Finally, Section 6 concludes.
2 Overview of the Ecuadorian private banking sector
Ecuador is a dollarized country since 2000, and after this monetary process, some regulations were applied to the financial system with concerning banking supervision, competition, public-available risk rating, microfinance risk and control of market liquidity risk to prevent other banking crisis. However, those regulations adopted since 2000 have not improved the competition degree because this policies were done only to strengthened the financial system, one prove of this is that the 4 major banks concentrate around the 60% of deposits and loans (Uzcátegui-Sánchez, Camino-Mogro, and Morán-Cruz, 2018; Salgado, 2010).
The Ecuadorian financial system is composed by public and private institutions authorized and regulated by Superintendence of Banks (SB) (The SB is the institution at the country level that regulates both public and private banking institutions). In this financial system the subsectors, public banks, private banks, financial companies, savings and credit cooperatives and mutualists (Superintendencia de Bancos del Ecuador, 2016), operate under different conditions. Public and private banks are the most important subsectors and there are marked difference between them.
Salgado (2010) mentions that the private banking sector operates around 75% of total deposits and loans of the financial system, different for the public banks that operates around 13% of those accounts. Due to these differences, in this research we analyse only private banking sector since the dollarization system was adopted 2000 to 2015.
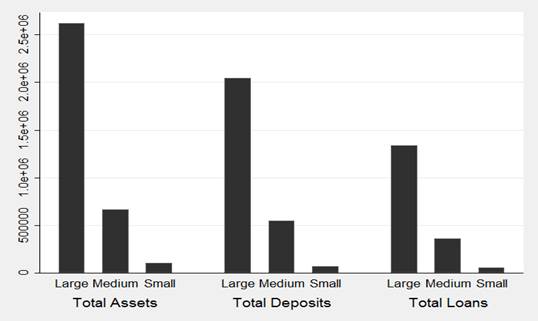
Additionally, in Ecuador the SB classifies the banks size by their total assets using the percentiles methodology according to the data of the participation of the total asset, resulting in: Large (>36%), Medium (12% < 36%) and Small (< 12%). In this vein, Bain (1951) argues that few and large firms (high concentration) are easier to commit anticompetitive behaviour (collusion). Large banks have a big difference in assets, deposits, loans and revenues compare to medium and small banks, also the market shares is little fragmented; regarding deposits, large banks have around 65% of market share, medium banks around 32% and small banks around 3%. In Figure 1 we show the differences in means between bank size in total assets, deposits and loans; where it is seen that large banks have around 4 more times the total assets, loans and deposits than medium banks and around 24 more times than small banks.
Another difference between sizes, particularly in 2015, is that large banks are mostly servicing corporate commercial loans (around 40%) and small and mediums (SMEs) loans (around 16%); small banks attend in major microcredits (around 55%) that are loans with a higher level of risk than corporate, entrepreneurship and SMEs loans. This difference is due to liquidity, solvency, positioning, and risk.
3 Literature review
In most countries there is a bank classification by size, some countries use the criteria of the number of employees, financial revenues, total assets, fixed assets, and others. In Ecuador, the SB classifies banks size by total assets, where there are some differences across size groups being one of the most important the loans target.
In this line, large, medium, and small banks could compete in different ways; Berger and Black (2011) found that large banks do not have advantages over small banks in lending to relatively large firms. However, other study examined the differences in earnings between banks of different size and concentration in the banking sector in the U.S., the research concludes that large banks located in concentrated markets tend to have higher volatility in earnings during the financial crisis (De Haan and Poghosyan, 2012). In Japan, an empirical study suggests that large banks usually borrow to large firms as well as that large banks do not necessarily have a comparative advantage in extending transaction-based lending. The study also showed that small banks tend to have stronger relationships with their borrowers compared to large banks (Uchida, Udell, and Watanabe, 2008).
According to Berger et al. (2005), large banks are less willing to lend to firms on which they have limited information, they also found that small banks have higher ability to allocate capital to risky borrowers; small banks are better in collecting and acting on ‘soft’ information. Stever (2007) argues that small banks are riskier because of their limited ability to diversify. His data refers to the U.S. bank holding companies between 1986-2003, also reports that small banks have fewer opportunities to diversify, which forces them to probably pick borrowers whose assets have relatively low credit risk to make loans that are backed by more collateral. This lower diversification, in turn, may result in higher earnings volatility.
The diversity in the market share in which the banks compete generates an average effect when studying the concentration. Castellanos(2010), in order to reduce this impact, uses a division by size when analysing the power of the banking sector in Guatemala. One of the techniques used in the new industrial organization to evaluate competition in the banking sector is the Panzar and Rosse (P-R) model (1978) which is a non-structural approach and formal measure to evaluate the degree of competition.
Some seminal researches about the competition in the banking sector, like Shaffer (1985), Nathan and Neave (1989), Perrakis (1991), and Molyneux et al. (1994), used the P-R model showing various interpretations of H-statistics. In particular, the H-statistic is not positive if the firm is a profit-maximizing monopolist or an oligopoly with short-term conjectural variations (Panzar and Rosse, 1987).
Durán et al. (2009) investigated the competitiveness of the set of intermediaries that constitute the Costa Rican financial system and the temporal behavior of its structure. Applying the Panzar-Rosse and Shaffer approaches, some conclusions are inferred regarding the type of industrial organization of the financial system. The results obtained reveal that within the Costa Rican financial system, large banks and small banks operate under perfect competition conditions.
Bikker et al. (2012), Nathan and Neave (1989), Claessens and Laeven (2004), De Bandt and Davis (2000) are some of the authors of numerous studies that have been generated with the application of this model to measure the degree of competition in the banking sector, where banks are treated as producers of intermediation services through inputs of factors such as labour, capital, and financial capital.
There is a recent and growing literature that analyses the banking competition using the P-R model, the results vary according to the country analysed, the period of time, and the circumstances such as post and pre-crisis periods or changes in government; for example of recent literature see: Sabir and Qayyum (2018), Nguyen, Stewart, and Matousek (2018), Bikker and Spierdijk (2017), Apergis, Fafaliou, and Polemis (2016), Shaffer and Spierdijk (2015), Barbosa, De Paula Rocha, and Salazar (2015), Anginer, Demirguc-Kunt, and Zhu (2014), Moch (2013); these studies also differ in the magnitude of the H-statistic, since in most of the cases the result is an H-statistic between 0 and 1, suggesting a monopolistic competition; nevertheless, the results in many cases depends on using a revenue equation or price equation . .
In Ecuador, there are few evidences that analyse the competition degree of the banking system using a non-structural approach of the new industrial organization. Camino-Mogro and Armijos-Bravo (2018) assesses empirically the competitive conditions in the private banking sector in Ecuador from 2000 to 2015 and found that that private banks in Ecuador operate under monopolistic competition, in addition, the competition increase during the 2007-2015 period; this study, do not differentiate the bank size and only use a price equation. Another study that analyses bank competition but in other contexts is Vera-Gilces, Ordeñana-Rodríguez, Camino-Mogro, and Cornejo-Marcos (2020). They use the P-R (H-statistic) in order to test if this measure is a determinant of banking profitability in Ecuador.
Finally, evidence distinct the banking competition by size group, some of this are Bikker et al. (2012), Yildirim and Philippatos (2007), and De Bandt and Davis (2000), all of those research conclude that large and small banks (not medium banks) operate in monopolistic competition in many countries. However, this study divided the size group in three (including medium banks) and contributes to the literature given evidence of banking competition by size in concordance with the idea of non-single market product. In addition, we use five different methods to estimate the competition degree by bank size, different from previous studies that only use the classical methods like Pooled Ordinary Least Square, Fixed Effects and Random Effects, we also prefer the non-typical methods to use the competition degree (H-statistic).
3.1 The theoretical model of Panzar-Rosse (P-R)
We follow the derivation of the P-R model used by Camino-Mogro and Armijos-Bravo (2018), and Buchs and Mathisen(2005). To assess competition, they consider the bank maximization problem, where bank i has total revenue (R) and total costs (C). Both are functions that depend on the level of production (y) and on the exogenous variables (z, x) where z affects revenues and x costs, but also on variables that affect both cost and revenues functions such as the number of firms (n); and a vector of input prices (p) that affects the cost function.
Ri = Ri(yi,n, zi) (1)
Ci = Ci(yi, pi, xi) (2)
Banks maximize their profits in the point where marginal revenue R i ′ y i ,n, z i equals marginal costs, C 𝑖 ′ y i , p i , x i which can be seen in the following equation:
R i ’(y i , n, z i ) - C i ’ (y i , p i , x i ) = 0 (3)
The production (y) of the bank i depends on a set of exogenous variables (z) that affect revenue, a vector of input prices (p) and exogenous variables (x) that affect the cost function. Therefore, the equilibrium production is written as equation (4). To obtain the reduced form of the revenue equation which is the product of equilibrium production and price level, we replace (4) in (1) and assuming that n is endogenous in the model, we get equation (5).
Y i * = Y i * (y i , p i , x i ) (4)
Ri * = R i * (z i , p i ) (5)
As mentioned before, P-R model provides the H-statistic which is a competition measure. This statistic is the sum of elasticities of firm total revenue with respect to the changes in input prices as shown in equation (6):
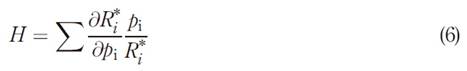
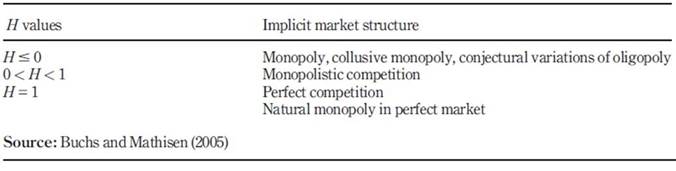
Where (𝜕 p i ) represents changes in input prices and 𝜕 𝑅 𝑖 ∗ represents equilibrium revenues earned by the bank i. H-statistic lies between less infinity and one. Thus, it can take zero or negative values when the market structure is a monopoly, collusive oligopoly or a conjectural variation of oligopoly; this scenario may occur when an increase in input prices (p) increases the marginal cost-reducing the level of equilibrium production, total revenues and profits. When the H-statistics lies between zero and the unity, banks compete under monopolistic competition, in this scenario total revenues increase less than proportional changes in input prices (p), this result is considered as the most plausible as mentioned by Bikker & Haaf (2002) Finally, the H-statistic can be one if any increase in input prices (p) increases marginal and average costs in the same proportion without changing the equilibrium product of banks. Under this situation, banks that are inefficient (cannot solve the problem of changes in input prices) will be forced out of the market. Table 1 shows the different values that H-statistic can take.
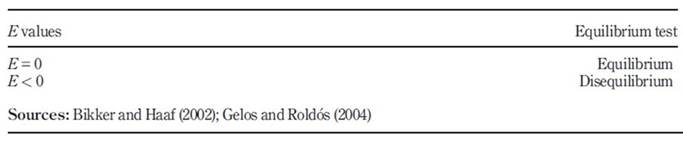
The P-R model and its H-statistic rely upon the assumption that the market must be in the long-run equilibrium. To test whether the market under analysis is in equilibrium we follow Shaffer (1985) and Nathan & Neave (1989) who suggest regressing the same equation of the P-R model but using the return on assets (ROA) as the dependent variable instead. From this regression, the E statistic (a test where E = 0) is derived and it is the sum of elasticities of the rate of return concerning input prices (Fu, 2009). If E<0 then there is an unbalance in the long-run and if E = 0 the market is in long run equilibrium. Table 2 shows the different values E-statistic can take.
Even we follow the model proposed by Buchs and Mathisen (2005) our research differs from that and other previous studies as we focus on the relationship between bank size and competition level. For this, we apply the model to each bank size group instead of on the whole sample of banks; thus, we reduce the problem mentioned by Bikker et al. (2012) that only unscaled revenue equations provide a valid measure of banking competition. In this sense, estimating a single equation for all banks without controlling for size differences may not be a good alternative as we are assuming that there are no different characteristics according to bank size, which for sure is not the case.
4 Methods
4. 1 Materials
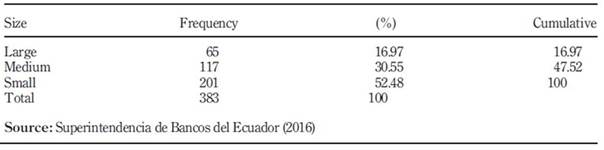
In this study, we use the financial balance dataset of banks reported in SB from 2000 to 2015 (annually). An unbalanced panel data was built with 383 observations distributed according to the banks’ size. As we mentioned in section 1, we chose to split the sample into three groups according to size, instead of a whole sample with size dummies, because of the different characteristics that each type of bank (small, medium, large) have in the Ecuadorian context. Also, using three size subsamples allow us to work with the unscaled revenue equation as suggested by Bikker et al. (2012). The information regarding the three subsamples is shown in Table 3.
This size division results in banks that have no observations during the whole period or parts of it mainly because some banks closed their operations. However, we have decided to include them in the analysis because in some cases these banks belong to the “large and medium-size” group.
To build the data set only private banks, not public ones, were considered since business management differs from one to another. Private banks have revenues from other services such as credit cards, demand deposits, and interbank transactions that public banks do not have. Public banks only have revenues related to financial intermediation (interest earned).
4.2 Definition of variables
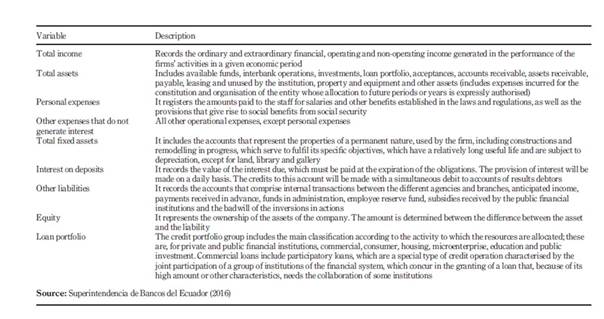
Table 4 shows the definition of each variable included in the analysis. The description of each variable was made based on what is established by the “Superintendency of Banks of Ecuador” on its catalogue of accounts of the national financial system .
4.3 Methods
In this study, we used a reduced form equation where the dependent variable is the ratio of total revenues and total assets of each private bank. We chose to use this ratio because private banks in Ecuador not only have income from lending (interest earned) but also from charges for the use of some services such as interbank transfers, withdrawal of deposits, management of current accounts, issuance of credit card statements, among others. Other articles in the literature use the same approach regarding the choice of the dependent variable such as (Bikker, Shaffer, and Spierdijk, 2012; Stavarek and Řepková, 2014).
We follow Nathan and Neave (1989), Claessens and Laeven (2004), and Yildirim and Philippatos (2007) with the model to measure private banking competition by size in Ecuador setting the following equation expressed in logarithms:
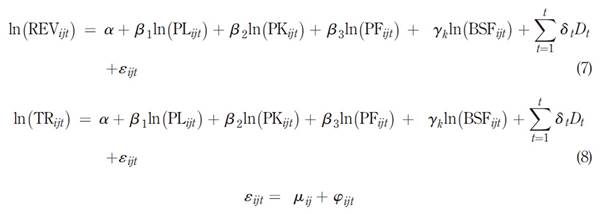
Where i represents each private bank, j is the bank size and t is every year. The dependent variable REV is the ratio between total income and total assets to have a price equation (output price), nevertheless, we use a measure of revenue to check the robustness of our model, in this line we include total revenues (TR) expressed as the sum of gross interest revenues and other operating non-interest revenues to have a revenue equation (Apergis, Fafaliou, and Polemis, 2016). The independent variables are three input factors: labour, capital, and deposits where PL, PK, and PF correspond to the three price inputs if all banks use these three productive factors. Thus, PL is the ratio between personal expenses and total assets as an approximation of the wage rate, PK is the ratio between the other expenses that do not generate interests and total fixed assets that include machinery, equipment, land, among others as a proxy of physical capital (Molyneux, Lloyd-Williams, and Thornton, 1994), PF is the ratio between interest expense on deposits and other liabilities, as a proxy for the average funding rate; these variables are used in line with the theoretical model proposed by Panzar and Rosse (1987). In addition, we have added a vector of specific factors BSF to be able to control for differences in risk and operational capacity, within this BSF vector we find the following variables: Liquidity (Liq) is the capacity to pay the obligations in the short run, is an approximation of solvency; Leverage (Lev) is the ratio of equity to total assets as a proxy for the leverage, reflecting differences in the risk preferences across banking institutions (Bikker, Shaffer, and Spierdijk, 2012). Credit risk (Risk) is the ratio of net loans to total assets as an approximation of the credit risk, fixed assets (FA) as a capacity indicator, additionally for scaled revenue and price equations we use the total assets (TA) and for unscaled equations we do not use TA in order to check the robustness of our model. Finally, to control possible macroeconomic changes within each year, a year dummy (D) has been created.
The model assumes a one-way error component as observed in equation 1, which denotes the unobservable effect of specific banks and also a random term that is not observed by the bank or the analyst. In agreement with the calculation of the H-statistic and the P-R model, the H statistic will be equal to the sum of the income elasticities with respect to the three price inputs:
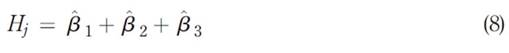
Once the value of H is obtained, the hypothesis tests are carried out to determine if the value is consistent with the theory. To test the validity of the P-R model, in the sense that the market is in equilibrium, in the long run, we estimate an equation where the dependent variable is the return on assets (ROA):
Because ROA can take negative values, this dependent variable is computed as: ln (1 + ROA) (Utrero-Gonzalez, 2004). It is assumed that in long-run equilibrium, the elasticity of profitability to changes in factor prices should be zero, i.e. change in input prices should not affect the profitability of financial intermediaries (Castellanos, 2010). The long-run balance of the private banking market is calculated as follows:

To assess long run equilibrium, we perform a test where E = 0. The equilibrium test in the long-run is calculated using the F Wald coefficient constraint test that tests whether E = 0 or not.
Our panel data set is an unbalanced panel with N > T, and similar to time series with a cross-section (TSCS) they are exposed to have some characteristics that could difficult the econometric estimation with a traditional method such as Ordinary Least Square (OLS) due to heteroskedasticity, temporal autocorrelation or contemporary correlation between panels, and unit root problems. Besides, Beck and Katz (1995) argue that the OLS estimations are not optimal in the presence of not spherical errors. The statistical tests used to allow us to know whether these problems are present in our sample and then choose the best econometric estimation technique for the model (these are available upon request). As we have detected some problems like autocorrelation and heteroskedasticity in our sample, we use two alternative methods: Feasible Generalized Least Square (FGLS) and Panel Correction Standard Errors (PCSE).
The FGLS method proposed by Parks (1967) and Kmenta (1986) allows the estimation of TSCS models in which the error term have grouped heteroskedasticity, contemporary correlation, and autocorrelation, but this method is not valid in situations when N > T because this method needs a relative large T with respect to N, in this line this method is limited to TSCS research.
On the other hand, Beck & Katz (1995) proposed the PCSE method and demonstrate the superiority concerning the FGLS method in panel data with N > T, they found that the estimations on FGLS had problems with the sub estimation of the errors, with minimum efficiency improvements about OLS method. They also found the superiority of the PCSE method with respect to the FGLS method in different conditions of heteroskedasticity and contemporary correlation.
The PCSE method could correct the first-order autocorrelation with a previous transformation proposed by Prais and Winsten (1954). Our data set is composed of banks with different characteristics in risk, loans, catchments, and size, it is assumable the existence of different autoregressive coefficient for each panel. However, Beck and Katz (1995) recommend to calculating a similar autoregressive coefficient for all panels, because the interest parameters β do not change for each cross-unit.
5 Results
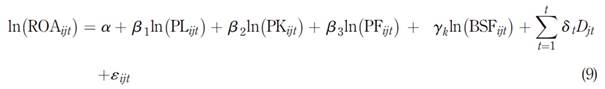
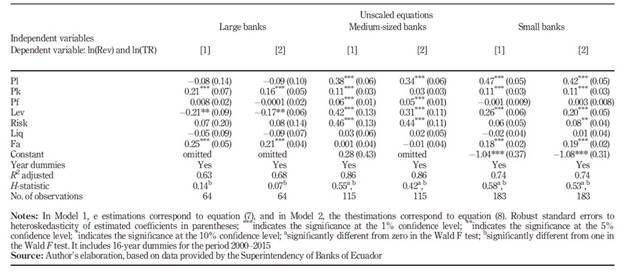
We estimate equation (7) by Pooled Ordinary Least Square (POLS), Fixed Effects (FE), Random Effects (RE), Feasible Generalized Least Square (FGLS) and Panel Correction Standard Errors (PCSE), the last two methods are used to correct possible problems with autocorrelation and heteroskedasticity in the Ordinary Least Square estimations. Table 5 shows the econometric results of the competition degree during 2000-2015 using an unscaled equation. We show the estimations from 5 different econometric methods, nevertheless, we only discuss those from PCSE estimation due to the methodological implications discussed in section 2.
We found that the H-statistic for large banks was estimated at 0.14, this result is statistically significantly different from one in F Wald test, the null hypothesis H = 1 was rejected, which suggests that large banks operate in a monopolism environment. Second, the H-statistic for medium banks is 0.55; this result is statistically significantly different from zero, and also from one, the null hypothesis H = 0 was rejected as well as the hypothesis H = 1, showing that medium banks operate in a monopolistic competition. For small banks the H-statistic is 0.58, also the hypothesis H = 0 and H = 1 were rejected, which means that small banks operate in a monopolistic competition similar to medium banks.
According to the input prices, all the methodologies reported in Table 5 have the same results in Pl, Pf, and Pk in terms of sign and significance, being the estimation of the H-statistic robust to any of the methods applied. In this sense, for medium banks the input prices are positive and significant, additionally, the Pl (labour input) has the major contribution to revenue (0.38), meaning that these banks are intensive in labour. For large banks we found that only the Pk input factor is positive and significant, meaning that are intensive in physical capital and not in labour or funding rate. For small banks, the prices of labour and capital are statistically significant and positive, implying that these two variables contribute to increasing revenue, the price of funds that is negative and not significant at standard levels is very close to zero and shows that the cost of the capital (money loans) does not have a significant influence on revenue.
Another important result from Table 5 is the coefficient of capacity indicator (fa), it is positive and significant for large and small banks, while for medium this variable is not significant. This result could imply that it seems to be a difference in capacity (fixed assets) between banks that belong to the same group. On the other hand, the leverage (lev) is significant for all bank size groups but only negative for large banks, suggesting that debt is not the way to increase investments and revenue, but for medium and small banks debt is positive related to revenue, and more debt which is invested improve revenue. Finally, risk and liquidity (liq) have the same effect on large and small banks, those variables are positive (risk) and negative (liq) but not significant suggesting that these variables do not influence significantly on output prices and revenue. However, for medium banks, the risk is positive and significant meaning that more loans to total assets increase output prices and revenues.
Based on the discussion on Bikker et al. (2012) and Apergis et al. (2016), who mention that only unscaled equations provide a valid measure of banking competition using the P-R model, it results necessary to check the robustness of our findings by estimating scale equations to see whether the results change. To implement this, we include in the equation (7) the variable total assets (Ta).
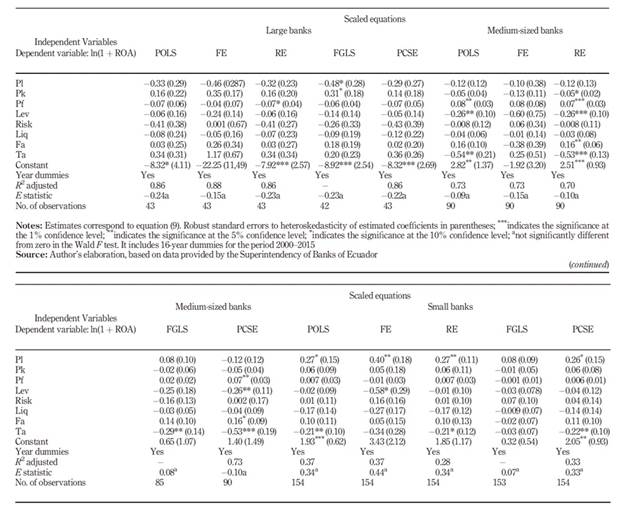
Table 6 contains the estimation results when we account for the scale effect. Similar to the unscaled results, we only discuss those from PCSE estimation due to the methodological implications discussed in section 2. In this line, we found that the input prices (Pl, Pk and Pf) have the same sign and significance obtained in the unscaled results, additionally, the H-statistic for large banks is 0.13 and it is statistically significantly different from one in F Wald test, the null hypothesis H = 1 was rejected, which suggests that large banks operate in a monopolism environment as in unscaled equation results. Also, the H-statistic for medium banks is 0.57; this result is statistically significantly different from zero, and also from one, the null hypothesis H = 0 was rejected as well as the hypothesis H = 1, showing that medium banks operate in a monopolistic competition. For small banks, the H-statistic is 0.67, also the hypothesis H = 0 and H = 1 were rejected, which means that small banks operate in a monopolistic competition similar to medium banks. These results are in line with those obtained in Apergis et al. (2016) and Sun (2011) which mentions that the estimated results in scaled and unscaled revenue equation are quite similar and the competition degree does not change from one to other.
As we know, the P-R model is only valid if the market is in long-run equilibrium. This long-run equilibrium is usually tested with a model in which the dependent variable is ROA and the independent variables are the same as in the competitive model. The test for the long-run equilibrium is shown in Tables 7 and 8 for unscaled and scaled revenue equation and was estimated with the Wald coefficient restriction test using the equations 9 and 10.
The null hypothesis for long-run equilibrium in large, medium, and small banks ( E j = β 1 + β 2 + β 3 = 0) was not rejected for all bank sizes, the five methodologies and for unscaled and scaled revenue equation. The null hypothesis of the coefficients being equal to zero cannot be rejected confirming that large, medium, and small banks were in equilibrium during the period 2000-2015. The argument behind the equilibrium test is that in the long-run equilibrium the forces of market equalize ROA among homogeneous banks and changes in input prices do not affect the returns on assets (Shaffer, 1985)
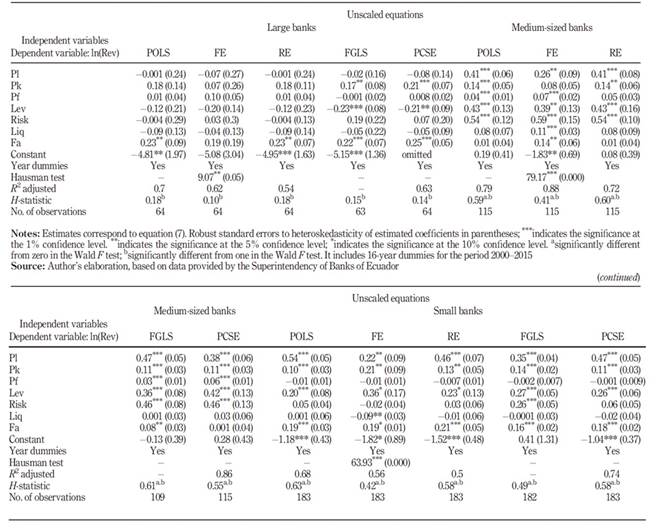
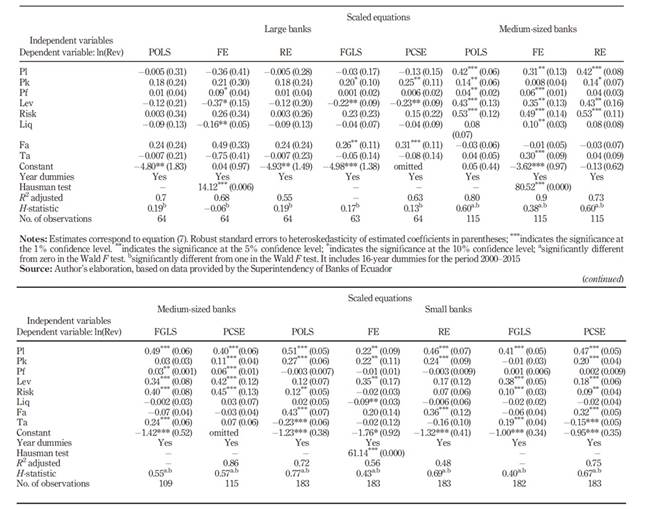
Table 7 Equilibrium test, private banking sector aggregate results in Ecuador by size for 2000-2015.
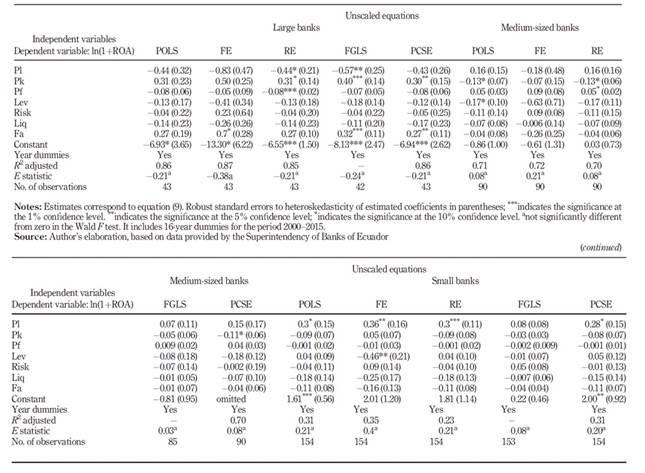
Table 8 Equilibrium test, private banking sector aggregate results in Ecuador by size for 2000-2015.
5.1 Robustness check
To assess the robustness of our specification in equation (7) and once decided that PCSE is the method that we use to obtain the competition degree, Table 9 shows the results of PCSE estimations using price equation (7) in the model 1 and estimations using revenue equation (8) in the model 2 for unscaled equations.
Our results obtained in the model 2 confirm our evidence in the model 1, particularly we get that the H-statistic is close to 0 for large banks and do not reject the null hypothesis of monopoly, but reject the null hypothesis of perfect competition. We also find that medium and small banks are in monopolistic competition because the H-statistic rejects the null hypothesis of monopoly and perfect competition. In terms of the input prices, our results confirm the sign and significance in all bank sizes. Finally, we do not find differences in the estimation of the H-statistic comparing price and revenue equations on unscaled methodology.
6. Conclusion and discussion
The main contribution of this study is to provide evidence on the different competitive environments that private banks, classified by size, operate in Ecuador. We decided to split the data into three size groups: large, medium and small banks, because these groups operate in different loans segments and based on a sample of firms of widely different sizes within a single market may be intrinsically unsuitable to apply the P-R test as mentioned by Bikker et al. (2012) In addition, we use official national data provided by the regulatory institution SB and finally this is the first attempt that analyses competition by size in the Ecuadorian private banking sector.
This paper has not found evidence of a non-competitive market structure for small and medium banks, according to this, these groups compete in the banking sector as in monopolistic competition. However, for large banks, we found evidence supporting a monopolism market.
Our conclusions suggest that medium and small groups of banks are more competitive than large banks; this evidence is in concordance with Bikker et al.(2012) where they separate large and small banks and compare the H-statistic of this two groups and found that in some cases large banks operate on monopolism market, also they argue that the coexistence of banks of different sizes within the same market is strong evidence of either disequilibrium or locally constant average cost and since constant average cost and disequilibrium undermine the reliability of the P-R test, a sample of firms of widely differing sizes within a single market may be intrinsically unsuitable for the application of the P-R test.
However, Yildirim and Philippatos (2007) argue that large banks in Argentina, Brazil, Chile, Peru, and Uruguay operate in a relatively more competitive environment compared to small banks; although in Ecuador they not found differences in the degree of competition between large and small banks. A possible interpretation is that large banks can exercise some market power due to their strong competitive position in local retail markets and enjoy a certain degree of spatial differentiation accompanied by it.
Finally, and similar to Sabir and Qayyum (2018), we found robust evidence that shows that unscaled and scaled revenue equations or price equations conduct to the same results of competition degree, these results are in accordance with Apergis et al. (2016) but not with Bikker et al. (2012) who mentions that only an unscaled revenue equation yields a valid measure for competitive conduct. Our results did not reveal any significant differences in the magnitude of the relevant estimations between the scaled and the unscaled modelling approaches. Finally, we found that PCSE methodology fits better than POLS, FE, RE, and FGLS methods; also, the results between the five methodologies did not change when we compare unscaled price and revenue equations.
These results are different compared to other countries that used the same methodology such as Bikker et al. (2012), Yildirim and Philippatos (2007), De Bandt and Davis (2000); it could be because they classified the banks in two sizes, only large and smalls and also include the public banking sector. Finally, we found that large, medium and small banks were in long-run equilibrium meaning that the P-R model is correctly adjusted in the estimation and giving evidence of bank stability in each size group.
Given the results obtained, one of the important targets for policymakers is large banks as this study shows that they are operating in a monopolism market. Since 2001 the group of large banks has been confirmed by the same four banks until the end of the research period (2015). Behaviour that may make one think that there could be collusion among the firms to reinforce market power, only to prevent, restrict or distort competition, against the economic efficiency or the welfare of consumers (Superintendencia de Control del Poder de Mercado de Ecuador, 2011).
The durability of market power has gained significant relevance in antitrust legislation. In many cases, dominant companies have erected entry barriers to exclude new rivals, in which the average cartel has been found to last more than eight years and others have survived for at least 40 years. This evidence shows that anti-competitive behaviour can often be sustained over long periods of time and overcome the incentive of companies to cheat on cartels and the incentive to expand and compete out of monopoly profits (Baker, 2017). In this sense, there is scope for future research on designing and implementing policies with the aim of guaranteeing competitive behaviour in the private banking system.

