


 English (pdf)
 Article in xml format
 Article references
 Send this article by e-mail
 Cited by SciELO
  Similars in
SciELO
Similars in
SciELO 
 Permalink
Introduction
The dynamic relationship between exchange rates and stock market index prices is of great interest to many academics and researchers since they play a crucial role in the economy. Nevertheless, the literature in this area seems to be inadequate and the interactions between currencies and stock markets are still not clear. Previous results are somewhat mixed as to whether stock indexes lead exchange rates or vice versa and whether feedback effects (bi-causality) even exist among these financial variables. Several studies conclude that exchange rates should lead stock market index prices. Alternative studies reveal that changes in stock market index prices may influence movements in exchange rates via portfolio adjustments. This paper contributes to the literature in three ways: first, we investigate simultaneously the causality and the dynamic links between exchange rates and stock market indices.
Second, given that the existing literature on the co-movements between stock index and currency markets of BRICS countries (combining Brazil, Russia, India, China, and South-Africa) are comparatively limited, we attempt to identify in this paper the short- and long-term effect of US dollar on major stock market indices of BRICS nations.
Third, differently to previous studies which used either, panel-fixed effects or random-effects model, this paper advances the existing literature by applying a new methodology combining the panel GMM model and the Panel Auto-Regressive Distributed Lag (ARDL) method to investigate the existence of a causal short/long-run relationships and dynamic dependence among all stock market returns and exchanges rates changes of BRICS countries. More precisely, we consider an intermediate estimator, which we call the pooled mean group (PMG) estimator because it involves both pooling and averaging. This estimator allows the intercepts, short-run coefficients, and error variances to differ freely across groups but constrains the long-run coefficients to be the same.
The main objective of this paper is to analyze the impact exchange rates changes on stock market returns by using a data set consisting of the exchange rate between USD and BRICS currencies namely Real (BRL), Ruble (RUB), Rupee (INR), Yuan Renminbi (CNY), Rand (ZAR) and the daily closing prices of the stock market indices of BRICS countries namely IBOVESPA, MICEX, ENSEX, SHCOMP and JALSH representing Brazil, Russia, India, China, South-Africa respectively from January 1, 2008, to February 23, 2018. Using the dynamic panel Generalized Method of Moments (GMM) model and the ARDL method, results show that exchange rate changes have a significant effect on the past and the current volatility of the BRICS stock market indices returns. Besides, ARDL estimations reveal that exchange rate movements have a significant effect on short- and long-term stocks market indices of all BRICS countries. Our findings have implications for policymakers as well as market participants who try to manage the exchange rate will have a different dose of intervention if they know that the effects of currency depreciation are different than appreciation. These results have important implications that investors should take into account in frequency-varying exchange rates and stock returns and regulators should consider developing sound policy measures to prevent financial risk.
The remainder of this paper is as follows. Section 2 advances the literature review relating to the motivations and the importance of our study. Section 3 presents the data description and descriptive statistics. Methodology and research design are advanced in Section 4. Section 5 discusses the empirical results. Section 6 concludes and discusses the policy implications of the paper.
Literature review
The effect of changes in exchange rates on stock market index returns, and the interactions between stock markets and money markets, has become an interesting topic of research. According to the literature, several researchers have paid more attention to the cause-and-effect relationship between the changes in exchange rates and the fluctuation of stock market index returns. In fact, measuring the interconnectedness of exchange rates and stock markets is increasingly recognized as being of paramount importance in terms of practical implications for a financial investment since it involves portfolio management, asset allocation, and risk management. The existing literature on dynamic links between exchange rates and stock returns is extensive and most studies have mixed results. Some research studies find positive links between exchange rates and stock returns (Bahmani, Oskooee, and Saha, 2016; Caporale et al., 2015; Ülkü and Demirci, 2012). Although some find negative relationships (Caporale et al., 2015; Chkili and Nguyen, 2014; Wong, 2017), other studies show insignificant links between the two variables (Alagidede, Panagiotidis, and Zhang, 2011).
The current literature on the dynamic relationship between exchange rate movements and the fluctuation of stock market returns is relatively limited and has most often been focused on financial markets in developed and emerging markets but less often in BRICS countries. In this way, Ma and Kao (1990) examine the reactions of stock market indices to exchange rate movements for six major industrialized countries (United Kingdom, Canada, France, West Germany, Italy, and Japan) from January 1973 to December 1983 and show that stock prices are affected by the change in exchange rates. Based on six industrial countries (the United States, the United Kingdom, Japan, German, France, and Canada), Kanas (2000) examines the volatility spillover effect between the exchange rate and the stock price and shows that the majority of cases, there was a significant volatility spillover effect from the stock market to the exchange market. Abdalla and Murinde (1997) investigate the interactions between the exchange rate and stock prices on the financial markets of emerging countries (India, Korea, Pakistan, and the Philippines) and they conclude that there is one-way causality of exchange rates at stock prices in all countries in the sample, with the exception of the Philippines. Leeves (2007) evaluates the effect of the change in the IND/USD exchange rate on equity returns in Indonesia during the Asian Financial Crisis using the AGARCH and NGARCH models. He concludes that the increases in asymmetric response patterns appear to match with the sharp devaluations of the rupee exchange rate over this period, followed by symmetric short-term volatility, and generally after the crisis. For the period from 2003 to 2010, Ulku and Demirci (2012) show that exchange rates have substantial positive effects on stock returns in countries that receive net capital inflows and the robustness of the results from exchange rates and stock returns depends upon controlling the effects of stock returns in emerging and advanced countries from abroad, along with strong local stock markets. Bahmani-Oskooee and Saha (2016) explore the effect of exchange rate movements on stock prices, for other countries (Brazil, Canada, Chile, Indonesia, Japan, Korea, Malaysia, Mexico, and the United Kingdom), applying the non-linear ARDL method and they find that exchange rate movements have asymmetric effects on stock prices mainly in the short term.
Recently, Tang and Yao (2018) investigate the impact of the domestic financing structure, considered as a key means of interaction between stock markets and foreign exchange markets, on the relationship between stock prices and exchange rates of eleven emerging countries, namely; Argentina, Brazil, China, India, Indonesia, South Korea, Mexico, Russia, Saudi Arabia, South Africa, and Turkey during the period 1988-2014. Using Granger's co-integration method and multivariate causality tests, the results show that the internal financing structure, which reflects the share of direct and indirect financing, plays an important role in the relation between the exchange rate and share price. They also find that, with the exception of China, internal financing structures had a significant effect, whether through capital or equity flows, on the coupling mechanism between the exchange rate and the emerging market equities. Morales-Zumaquero and Sosvilla-Rivero (2018) empirically analyse the evidence of intra-spillovers and inter-spillovers between foreign exchange and stock markets in the seven economies which constitute the majority of foreign exchange transactions (the United Kingdom, the United States, the Euro area, Australia, Switzerland, Canada, and Japan) for the period from 1990 to 2015. Using the C-GARCH methodology and the SVAR framework, results suggest that the long-run volatility relationships are stronger than the short-run volatility linkages with reinforcement during the post-global financial crisis period. They find that the stock markets play a dominant role in the transmission of long-run and short-run volatility in all samples, except for the period after the global financial crisis, where the foreign exchange markets are the main long-run volatility triggers.
In addition, "the characteristics of the stock markets, the behavior of investors and the economic policies of BRICS countries are different from those of developed countries and other emerging countries" (Mozumder et al., 2015). Little research has investigated the long-term interactions between stock markets and money markets in the BRICS countries. For example, Sui and Sun (2016) examine the spillover effects of exchange rates and share prices of BRICS countries after the global financial crisis of 2007-2008, looking at dynamic, long-term and short-term relationships. By applying autoregressive vector models and vector error correction models, the results show a significant effect of stock prices on exchange rate movements in the case of Brazil and Russia, and insignificant effect for the case of India, China, and South-Africa. Ho and Huang (2015) investigate the relationship between the stock market indices and exchange rates of the BRIC countries (with the exception of South Africa) using the Lagrange multiplier principle (LM), during the period from February 2002 to December 2013 and show that the causal relationship of the exchange rate to the stock index differ according to the market states. During the period 2006-2015, Naresh et al. (2018) try to identify the long-run spillover effect of US dollar on major stock indices of BRICS nations by applying individual and Panel Generalized Method of Moments (GMM). The results indicate that the appreciation in the value of BRICS currencies against dollars has increased the value of the respective nation’s stock indices. More recently, based on a wavelet analysis, Dahir et al. (2018) investigate the dynamic links between exchange rates and stock returns in BRICS countries and reveal that relationships between exchange rates and stock returns are positive in the medium and long term, indicating that exchange rates lead stock returns in Brazil and Russia, negative in India and seem to be more bidirectional causality in China.
Data description and preliminary statistics
To test the dynamic relationships, the exchange rate between USD and BRICS currencies namely Real (BRL), Ruble (RUB), Rupee (INR), Yuan Renminbi (CNY), Rand (ZAR) and the closing prices of the stock market indices of BRICS countries namely IBOVESPA, MICEX, ENSEX, SHCOMP and JALSH representing Brazil, Russia, India, China, South-Africa respectively have been considered. Daily data of the above-mentioned indices for the period from January 1, 2008, to February 23, 2018, have been collected from DataStream databases.
The trend of the exchange rates and the prices of the BRICS countries' stock market indices are illustrated in Figure 1.
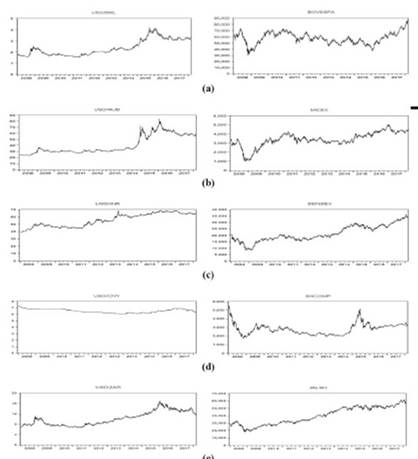
Figure 1 Exchange rates and stock market index prices trend on the BRICS countries (form January 1, 2008, to February 23, 2018)
Generally, panels A1, A2, B1, B2, C1, C2, D1, D2, E1, and E2 of Figure 1 show similar trends of exchange rates and index prices. More precisely, results show that changes in stock market indices prices may influence movements in exchange rates. Following earlier studies, illustration reveals that the volatility of the stock market indices can be deduced as a result of the change in the exchange rate of each country. According to figure 1, we can notice that the BRICS countries' stock market indices are highly volatile compared to the exchange rates. Among the stock indices, from the panel E2, JALSH index price shows an increasing trend in the long run since 2009, though there are some short-term fluctuations. Whereas for the case of the exchange rate, through the panels A1, B1, and E1 of figure 1, BRL/USD, RUB/USD, and ZAR/USD exchange rates exhibit high volatility as compared to the exchange rates of the other BRICS. Through this finding, we can reveal that Brazil and South-Africa are largely dependent on the U.S. for their foreign trade transactions and that the U.S. dollar has traditionally been used to settle oil transactions and oil is a key export for Russia. For the case of China, panels D1 and D2 show that the SHCOMP index price is highly volatile, while the exchange rate (CNY/USD) is comparatively weakly volatile. As it is noted by Naresh et al, (2018), this difference may be due to Government intervention in spite of implementing managed float.
Before proceeding to test the causality and dynamic relationships, all the data have been converted into their log returns form, through the following formulation : (ln(Yt/Y(t-1))); where Yt is the exchange rate or stock index prices at day t, to have better elasticity. Table 1 reports the descriptive statistics, for the overall sample period, of stock market indices returns and exchange rates change of all BRICS counties.
Table 1 Descriptive statistics of stock market indices returns and exchange rates changes of BRICS countries
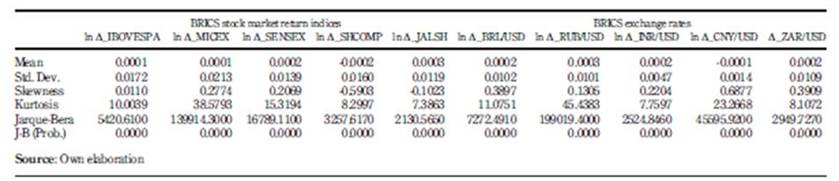
On average, Table 1 shows that the means of the BRICS stock market returns and Exchange rates are positive. From Table 1, we notice that China index and CNY/USD exchange rate reveal the lowest daily mean return (-0.0002) and Yuan Renminbi against dollar change (-0.0001) respectively while South-Africa index and RUB/USD exchange rate yield the highest daily mean return (0.0003) and Ruble against dollar change (0.0003) respectively. From a risk perspective, South-Africa and Russia stock market indices (CNY/USD and ZAR/USD changes) reveal respectively the lowest and the highest standard deviation compared to the other BRICS countries. Skewness, kurtosis, and J-B statistic probabilities imply that the null hypothesis of normal distribution could be rejected in all cases.
Table 2 reports the correlation coefficients between both stock market indices returns and exchange rate variations of the BRICS countries over the total sample period.
Table 2 Correlation matrix between stock market indices returns and exchange rates variations of BRICS countries over the total sample period (January 2008-February 2018)
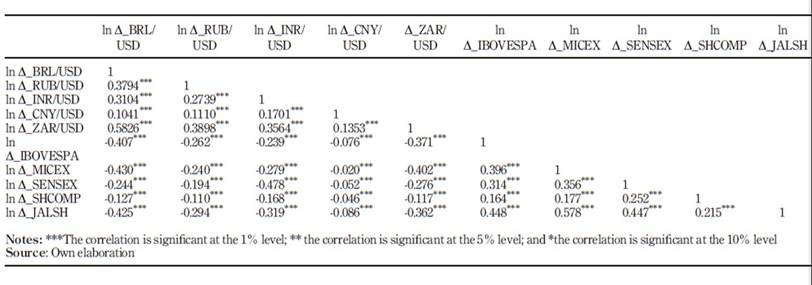
Over the total period of study, Table 2 shows that the correlation between the different variables is generally weak and negative especially between all BRICS countries' stock market returns and exchange rates. This implies that the two financial markets can show opposite movements. The highest and the lowest correlation are between ZAR/USD and BRL/USD exchange rates (0.5826) and between South-Africa index return and BRL/USD exchange rate (-0.425). According to Kennedy (2003), we can deduce that there is no problem of multi-collinearity between all variables since the correlation coefficients are less than the limit value, equal to 0.8.
Methodology and research design
Individual and common unit root tests
To test the presence of unit root, we use individual unit root tests namely Augmented Dickey-Fuller (ADF) test and Phillips Peron (PP) test for the case of stock market returns and exchange rates change values for all BRICS countries. Besides, since the panel estimations are used, we apply the Levin, Lin, and Chu (LLC), Breitung t-test to check common unit root process and Im, Pesaran and Shin, ADF-Fisher chi-square and PP-Fisher chi-square panel unit root tests to verify individual unit root process of the panel data.
Table 3 summarizes the estimation results of Augmented Dickey-Fuller (ADF) and Phillips Perron (PP) unit root tests.
Table 3 ADF and PP unit root tests of stock market indices returns and exchange rates variation values of BRICS countries
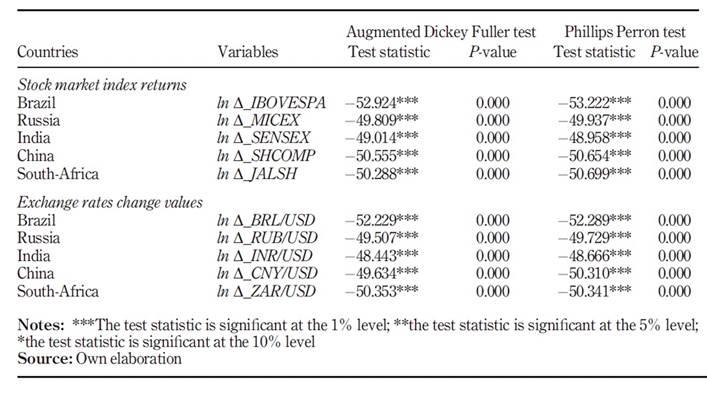
Table 3 shows that the test statistics of both ADF and PP tests are highly significant at a 1 percent level for the case of all the variables indicating the absence of unit root in the log-returns of stock indices and exchange rates of BRICS countries and all series are stationary.
In this step, we examine the presence of panel unit root using common and individual unit root processes and we reveal that there is no presence of panel unit root in case of all the variables. Table 4 reports the estimation results of panel unit root tests of the two considered variables; ln Δ_Stock market Indices returns and ln Δ_Exchange Rate.
Table 4 Panel unit root tests of stock market indices returns and exchange rates variation values of BRICS countries
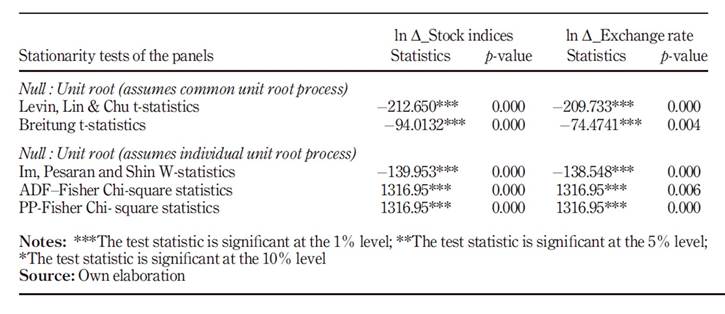
From Table 4, the results of Levin, Lin & Chu test and Breitung t-test, which explain the presence of common unit root process, show that all test statistics are significant even at a 1 percent level implying that the stock market indices returns and exchange rates variations are stationary. Thus, the null hypothesis of the presence of the common unit process is rejected in 100 percent of cases. Besides, the Im, Pesaran and Shin, ADF-Fisher chi-square and PP-Fisher Chi-square panel unit root tests that explain the individual unit root process of the panel data show the absence of unit root in case of all the considered variables. The test statistics of the three tests are significant even at a 1 percent level, implying the reject of the null hypothesis of the presence of the individual unit root process.
Panel/GMM model estimation
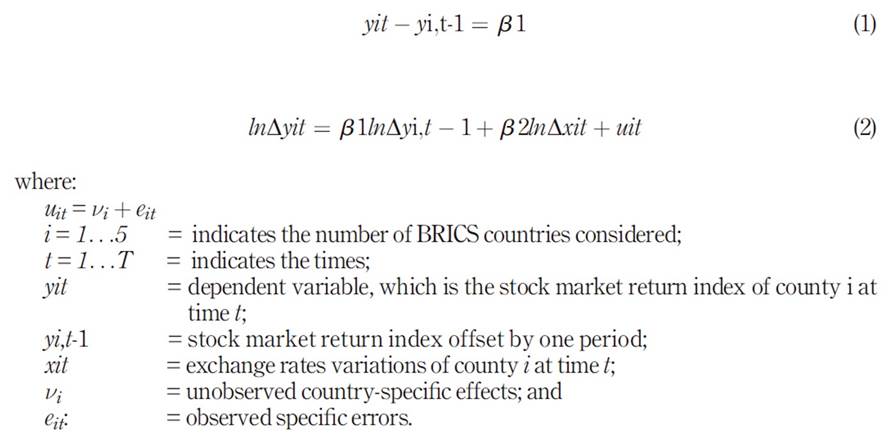
To examine the causality and dynamic links between exchange rates and stock market indices of BRICS countries, we use a methodology based on several steps. Regarding the Auto-correlation errors in static panel data models, dynamic panel data models are used in this paper to identify the relationship between a dependent variable and its past, including offset levels of the dependent variables. Firstly, we use panel fixed-effects or random-effects model with the help of Hausman’s test. Secondly, we apply the panel GMM model. The rationale for the selection of the model is that, instead of using assumptions on the entire distribution, it uses assumptions only about specific moments, thus it represents a good alternative. In fact, the latent time-invariant variable may change over time rather than being constant as in the case of a fixed or random-effects model. It may also correlate with some other variables as well, so it is necessary to have lagged endogenous variables in the model. This has been put forth as another important reason for considering Panel GMM, as it is less likely to be mis-specified and it solves the endogeneity problem as well using the instrumental variables. Moreover, if there is unit-specific heterogeneity, it is difficult to disentangle the effects of observed and unobserved time-invariant heterogeneity using panel fixed and random effects models, thus dynamic panel model/GMM has been considered as the appropriate model amongst others (Arellano and Bond, 1991).
The GMM model has one or more lagged dependent variables, which allows modelling of a partial adjustment mechanism. The GMM model used to examine the impact of exchange rates changes on stock market returns volatility of the BRICS countries is defined as follow:
Empirical results and analysis
Panel/GMM model estimation
Initially, we define the optimal lag length of the dynamic panel models, basing on several criteria, Akaike (AIC) and Shwarz (SIC) criteria, to be minimized, and three other criteria, to maximize: R2 or R2-adjusted, Fisher's statistic, and Log-likelihood. Table 5 reports the estimation results of the five criteria.
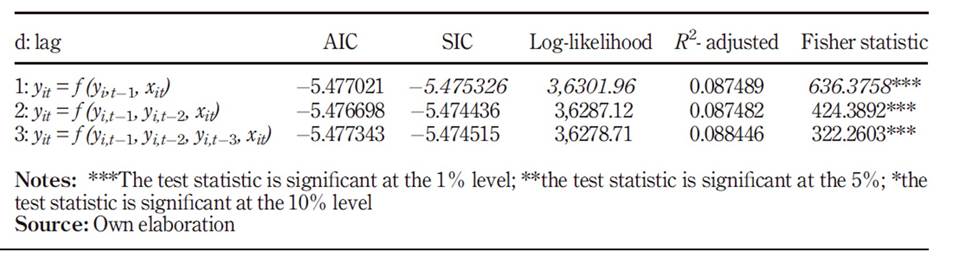
The results of Table 5 reveal that the optimal lag considered for the dynamic panel model is 1.
Secondly, our study attempts to evaluate the effect of exchange rate variation on stock market volatility using either a fixed or a random-effects model using the Hausman test. Table 6 summarizes the estimation results of the Hausman test.
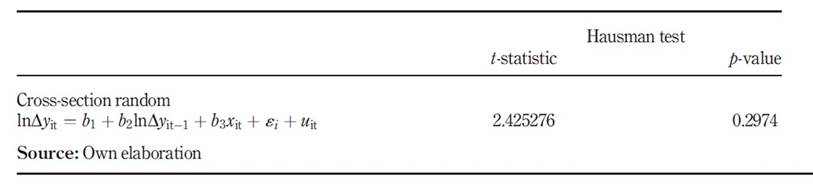
Table 6 shows that the asymptotic χ2 statistics of the Hausman specification test is not significant even at a 10 percent level (p-value=0.2974), implying that the random effect model is appropriate for the chosen panel data specifications.
Table 7 reports the estimation results of the random effects of exchange rates volatility on stock market index returns of BRICS countries.
Table 7 Random effects estimation results of exchange rates volatility on stock market index returns of BRICS countries
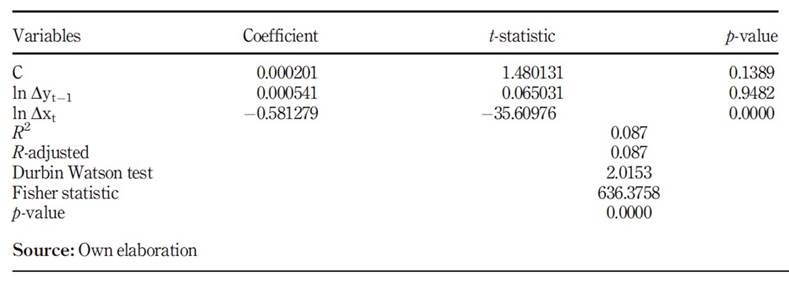
Table 7 shows that the effects of exchange rates volatility on stock market index returns of the five considered BRICS counties have been clearly explained by the random-effects model. From the estimation results, we find that the explanatory power of the models is good with an R-square value of 0.087 and Fisher statistics (F-statistics=636.3758) highly significant at 1 percent level. Furthermore, Table 7 reveals that the Durbin-Watson statistics is 2.0153 and close to 2 explaining that the model is free from the problem of autocorrelation. Also, the examination of the effect of exchange rates volatility on the stock market index returns is summarized in the coefficients of ln ΔXt in the model which is equal to −0.5812 and the t-statistic is equal to −35.609 (with a p-value=0) which is significant even at 1 percent level. The negative coefficient of exchange rate indicates that the appreciation in the value of BRICS currencies has increased the value of stock indices. It should be noted that the rise (or fall) in BRICS stock index returns is due to the appreciation (or depreciation) of each country's local currency against the USD. But, the estimation of the effect changes rates volatility on the stock market indices shows that the integration of yesterday's stock market index returns by the random effect model does not have a significant effect on current returns. Subsequently, our study attempts to analyse the causal relationship between exchange rates and BRICS market index returns by the first difference dynamic/GMM model to improve the results of our study and to determine whether prices of the previous day's market indices have an effect or not on the overall volatility of the BRICS countries' stock market indices.
The Panel/GMM estimation results examining the impact of the change in the exchange rate on the volatility of the stock market indices are summarized in Table 8.
Table 8 Panel/GMM estimation results for the impact of the change in the exchange rate on the volatility of the stock market
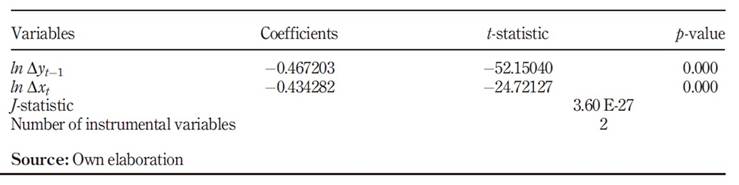
The results of table 8 show that the exchange rate changes have a significant effect on BRICS stock market index returns, even at the 1 percent level. In addition, the negative sign of the exchange rate coefficient indicates that the value of the BRICS stock indices increases as the value of the local currency increases against the USD and vice versa. Besides, empirical findings reveal that the value of the stock indices has been strongly influenced by their previous day’s values. In fact, the current performance of the BRICS countries' stock indices is significantly influenced by the performance of the previous day’s, given that the volume of transactions is very high in these countries and especially for the case of China, India, and South-Africa. Based on the J statistic and the instrumental variable rank, and since the reported J statistic is simply the Sargan statistic (the value of the GMM objective function at the estimated parameters), we can use it to build the test from Sargan. The results show that the critical value is not significant at 5 percent, even at the 10 percent level. This implies that there is no correlation between the matrix of instruments and disturbances, that is to say, the instruments are valid.
The results of the autocorrelation error tests according to the Arellano and Bond procedure are reported in Table 9.
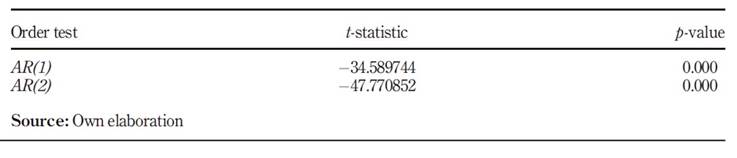
The results in Table 9 show that the first order and second-order statistics are statistically significant. Thus, we find that there is a second-order autocorrelation of the difference equation (AR (2)) errors in all our models since the critical value of AR (2) is significant even at a 1 percent level.
Dynamic Panel ARDL model estimation
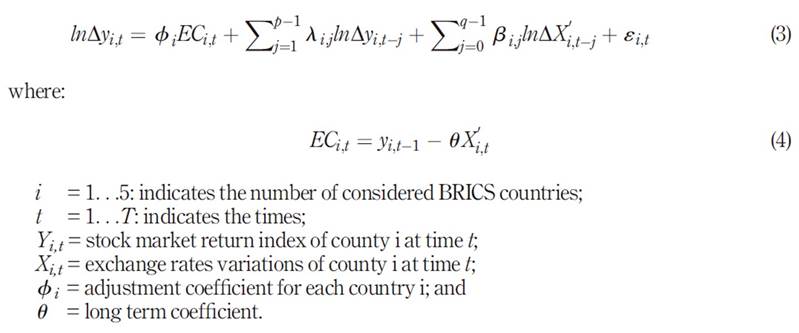
Although the Panel/GMM method gives only the results relating to the effect of exchange rate change on the volatility of the stock market indices only in the long run over the entire sample, the dynamic regression can be considered into the Error Correction model using the ARDL model (p, q) to estimate the same effect, in the short- and long-run, for each cross-section, for each country in our sample. In this paper, we consider the pooled mean group (PMG) estimator because it involves both pooling and averaging. This estimator allows the intercepts, short-run coefficients, and error variances to differ freely across groups but constrains the long-run coefficients to be the same. The reasons for assuming that short-run dynamics and error variances should be the same tend to be less compelling. Not imposing equality of short-run slope coefficients also allows the dynamic specification (e.g., the number of lags included) to differ across groups.
The PMG/ARDL (p, q) model of the dynamic panel estimation is written as follow:
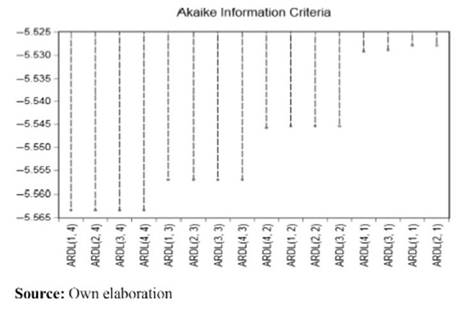
According to the Akaike Information Criterion (the lowest AIC value), optimal ARDL (p, q) model will be considered.
The determination of the optimal lags number of the ARDL error correction model is based on the Akaike information criterion to be minimized. From Figure 2, the estimated results show that the ARDL model (1.4) is the most appropriate, with p=1 and q=4.
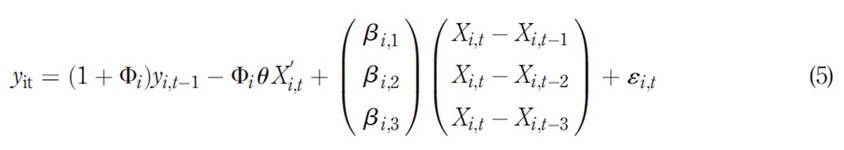
The model PMG / ARDL (1.4) is presented as follow:
The estimation results of the PMG/ARDL model are summarized in table 10.
Table 10 the PMG/ARDL Estimation results of the impact of the exchange rate change on BRICS stock market volatility
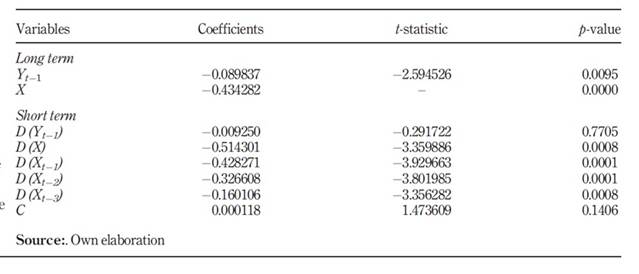
The estimation of the impact of the exchange rate changes on the volatility of the BRICS long-term market indices by the Panel/ARDL model (1.4) shows similar results to those of the Panel/GMM method. From Table 10, we find that yesterday's stock market index returns have a significant effect on daily returns, only in the long run. Similarly, the exchange rate change has a significant effect on the volatility of stock market indices even at a 1 percent level, in the short- and long-terms.
Table 11 summarizes the PMG/ARDL method estimation results of the individual effects of the exchange rate changes on the BRICS stock indices.
Table 11 Individual effects of the exchange rate changes on the volatility of BRICS country market index returns by the PMG/ARDL method (1.4)
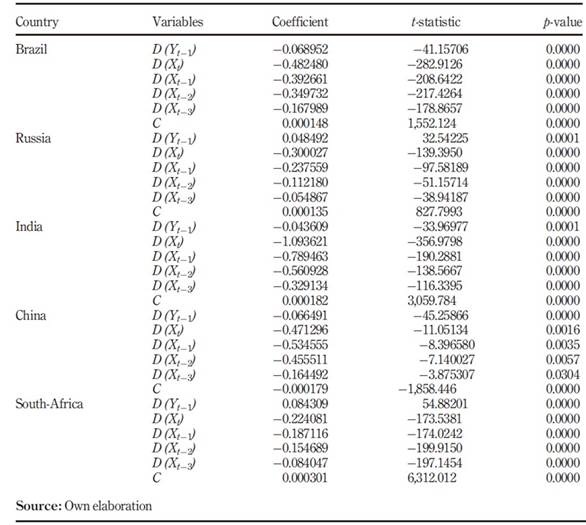
The results of Table 11 show that the exchange rates and historical returns of the BRICS countries have significant statistics at the 5 percent significance level. Therefore, we find that the exchange rates and historical returns of the BRICS countries' stock indices exhibit significant volatility on the returns of the current stock market indices. This result corroborates the results of Naresh et al (2018). We find also that the coefficients of the overall exchange rates are negative implying that the stock markets of BRICS countries react negatively to fluctuation in US Dollar price.
The results of the Panel/ARDL (1.4) method show that the effect of the exchange rate and stock market index returns of the previous day on the returns of the current stock market indices, in the BRICS region, differs from one country to another after the 2007-2008 financial crisis. As shown in Table 11, the previous day’s stock return of all counties has a significant effect on current stock return. Indeed, the current returns of Indian and South-African stock indices are influenced by their previous day’s return; this is due to the high volume of transactions in these countries.
For the case of Brazil, the results show that the returns of the previous day's stock market return, as well as the change the USD/BRL exchange rate, have a significant effect on the current returns of the Brazilian stock index, despite the increased dependence, between the US and Brazilian markets, and between the Brazilian Real and the US dollar, since the United States is the second-largest importer/exporter and investor of Brazil. Forbes in his report in 2016 said that "the rally of the Brazilian stock market is strongly tied to the US dollar". The adoption of a stronger and more efficient monetary policy has reduced their dependence on the US dollar. In addition, the new policy has positive effects on the Brazilian economy, for example, the drop in inflation allowed the Central Bank to gradually reduce the benchmark interest rate from 14.25% in October 2016 to 6.5% in March 2018. Thus, increased exports and investments helped Brazil come out of a deep recession in 2017.
After several years of economic stagnation caused by the fall in oil prices, the Western embargo in response to the Ukrainian crisis in 2014, capital flight, and the collapse of the ruble, Russia's growth rate has increased by -0.2% in 2016 to 1.8% in 2017. This growth was influenced mainly by the ore extraction sector and by household consumption. The growth rates forecast by the IMF are respectively 1.6% and 1.5% in 2018 and 2019. Also, the fiscal deficit has fallen to 2% of GDP in 2017. The inflation rate has fallen to 4% and this trend should continue thanks to the strengthening of the ruble. All these clarifications explain the effect of the change in exchange rates and returns of the previous day's stock market indexes on current yields in Russia after the recent financial crisis.
Similarly, the results of our study show that the current returns of the Indian equity index are significantly influenced by their previous day’s returns relating to the higher transaction volume in this country. According to IMF data, India's growth was 6.7% of GDP in 2017, supported by the development of the industrial activity, especially construction, and by the expansion of agriculture. Also, India's GDP exceeded for the first time the GDP of France in 2017, taking sixth place in the world economies in place of France, according to the World Bank website, and is on the way to the 5 first world economic powers. The OECD (Organization for Economic Co-operation and Development), in February 2017, showed that India had experienced the highest growth of the G20 countries during the 2014-2016 period. Forecasts estimate that Indian growth will increase to 7.4% in 2018 and 2019.
For the case of the Chinese market, yesterday's stock market index returns have a significant effect on current returns. This result can be explained by several reasons: First, the amount of Chinese investment abroad has increased 13-fold in 10 years, from 10 billion dollar in 2005 to 60 billion dollars in 2010, and 130 billion dollars in 2015. Secondly, China made a record by recording, in the first quarter of 2018, a commercial surplus which rose to 19.4%, that is equal to 58.2 billion dollars, in its trade with the United States. The figure prompted US President Donald Trump to engage in a trade war by imposing additional taxes on imports of Chinese goods. Thirdly, Chinese investments are constantly increasing, this country is doing as much as possible to be present in all the markets of the world, and this is materialized by its economic openness and its investment projects, especially in the countries of Asia and Africa in this last year. Indeed, trade flows between China and its main partners; the United States, the European Union (EU-28), Hong Kong, Japan and the Republic of Korea (South Korea), as well as their investments abroad, have a strong influence on fluctuations in exchange between the US dollar and the Chinese Yuan, and consequently on the Chinese stock market.
The results of Table 11 show also that the changes in the USD/ZAR exchange rate and the volatility returns of the previous day’s stock market index have a significant effect on the current returns of the South-African stock index. This is due to the high transaction level in this country. In addition, the negative sign of the ZAR/USD exchange rate coefficient indicates that the appreciation of South Africa's local currency positively influenced the returns of its stock market index. Besides, South Africa's economy, which has the continent's leading industrial power, grew by 1.3% in 2017, double the previous year.
Finally, not all regions of the global economy suffer from the crisis in the same way. However, the BRICS countries, like China, which has managed to get first place in the economic order from the United States, while India has grown quite fast. Despite the difficulties that have known Brazil and Russia, they have managed to emerge from a deep economic recession, and the return of Russia by a growth rate of 1.8% in 2017, all of these reasons explain the strength of these countries.
Conclusion and policy implications
This paper examines the causality and the dynamic dependence between exchange rate changes and stock market indices volatility of BRICS countries for the period from January 2008 to February 2018. A double methodology has been applied through the dynamic panel Generalized Method of Moments (GMM) model and the ARDL method to measure the short- and long-term relationships. The results of the Panel/GMM model show that the change in exchange rates and the returns of the previous day's stock market indexes have a significant effect on the volatility of the current returns of the BRICS returns indices. However, the results of the PMG/ARDL model indicated that historical returns of stock market indices have a significant effect on their current returns only in the long-term. The findings reveal that exchange rate movements have a significant effect on short- and long-term market index returns of all BRICS countries.
Our findings have implications for policymakers as well as market participants, especially monetary authorities who are responsible for stabilizing the domestic macroeconomy and financial markets. Policymakers who try to manage the exchange rate will have a different dose of intervention if they know that the effects of currency depreciation are different than appreciation. As for market participants or investors, the dynamic relationships between stock market indices and exchange rates information will discourage or encourage them from leaving or keeping the market when the domestic currency depreciates or appreciates. Besides, our results would be useful to international investors. Thus, the information on the dependence structure between exchange and stock markets would help international investors diversify their assets and reduce the risks by investing in weakly or negatively correlated markets. It would be also helpful for international investors to predict market returns in response to certain kinds of shocks.

