


 English (pdf)
 Article in xml format
 Article references
 Send this article by e-mail
 Cited by SciELO
  Similars in
SciELO
Similars in
SciELO 
 Permalink
1. Introduction
Market efficiency is defined as the integration of available information into financial asset prices. The efficient markets hypothesis (EMH) is based on the idea of investor’s rationality which is supposed to be perfect. However, numerous studies have revealed results quite different from the market efficiency theory predictions, which may explain some financial market anomalies. As these anomalies have become increasingly important phenomena, a new paradigm began to emerge - the behavioral finance.
De Bondt and Thaler (1985) have challenged the EMH and highlighted the emergence of the behavioral finance theory. Their study shows that the stock market is not efficient because of the incorrect market transmission of investor’s emotions such as pride, doubt, fear and hope. They also revealed that the rapid course of events causes irrational investors behavior. In fact, the investor’s sentiment creates movements in the market, which generate an evolution of prices of different assets above or below their reasonable values. Thus, the behavioral finance poses the fundamentals of an alternative financial theory, assuming that investor’s behavior is not perfectly rational. We then notice that the advantages and challenges of modern finance are to explain the phenomena qualified as behavioral biases.
The behavioral theory of finance is based on two basic assumptions. The first is that investors are not fully rational in the sense that their demand of risky financial assets is influenced by emotions as well as by beliefs. However, this latter is not justified by economic fundamentals which make the expectations mostly biased. The second assumption is the limited effectiveness of arbitrage which is carried out by fully rational investors. As a consequence, a debate prevails between the EMH and the fundamentals of the behavioral finance.
We note that the behavioral finance affects the investor’s behavior and therefore their strategic investment choices. Focusing on the US context, the following figure illustrates the evolution of the Dow Jones Industrial Average (DJIA) market index over the past 10 years on the New York Stock Exchange (NYSE). The (DJIA) index is one of the oldest, most well-known and most frequently used indexes in the world, and obviously the first on the (NYSE). It was created in 1986 by Charles Dow and Edward Jones when they started their own company: the Dow Jones & Company. They subsequently estimated that industrial values have the most important potential on the stock market. From Figure 1, we notice the rapid evolution of this index. According to the basic hypotheses of the behavioral finance, this strong evolution is due to the psychological behavior of investors that explains the stock market anomalies. As Isaac Newton (1720) affirmed: “I can calculate the motion of heavenly bodies but not the madness of people”.
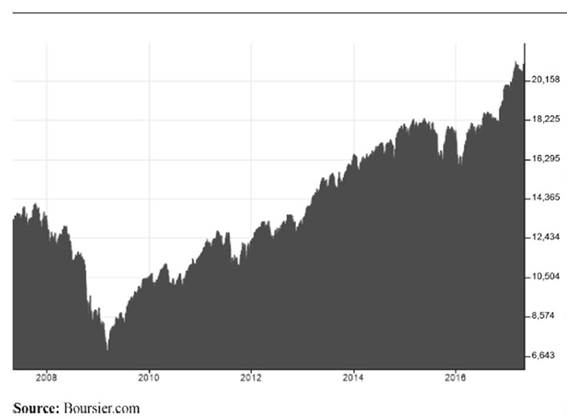
Figure 1 Evolution of the DJIA market index over the past 10-year period (2006-2016) on the New York Stock Exchange (NYSE)
Generally, the company goes through several situations. It can be in a performance stage when its stock market price is quite important, as it might be in a risky situation when its stock market price is very low. In classical financial models, the agents have always been considered rational and competent, but in reality, when a problem arises at the level of decision-making, these agents resort to mental calculation and this leads sometimes to a mistreatment of information. This mistreatment is then explained by investors’ behavioral biases, which in turn affects the stock market price of the company. Behavioral biases of investors can of two kinds: the biases of pessimism and the optimism. Therefore, these biases will affect the investment choices, and consequently, the company performance. In this way, we ask the following question: How loss-aversion and overconfidence biases of investors affect the performance of US companies?
Empirical studies have documented the influence of investor sentiment on financial markets, but the underlying economic market performance remains unclear. The literature lacks a consensus about the best measure of sentiment or on whether sentiment in fact affects stock market performance. While existing studies test the impact of sentiment on individual stocks and portfolios of stocks whose valuations are highly subjective and difficult to arbitrage, this paper takes a different approach. This study links psychological research and a traditional modified basic model to investigate the influence of investor sentiment on market performance. Two dimensions of sentiment are examined: loss-aversion sentiment and overconfidence sentiment. For this end, we developed two panel data models that were administered to a sample of 154 US companies from two different sectors of real economic activities - the industry sector and the service sector - using quarterly data for the period between January 2006 and December 2016. By relaxing the assumption of investor rationality and using panel regression, we show that investor sentiment has the ability to predict stock market performance of companies. The investor sentiment provides an incremental predictive power for the market performance in both sectors of activity, namely, industrial and services, compared to other variables routinely used in the literature. Overall, there is a positive impact between overconfidence and market performance of industrial firms, but the impact does not hold similarly at the service sector. The evidence also suggests that the investor loss-aversion sentiment strongly and negatively affects economic performance in the US market. Furthermore, we show that the overconfidence sentiment generally persists that US investors are culturally more prone to overconfidence-like behavior and therefore it may have a greater influence on market performance than the loss-aversion sentiment. This result is important for portfolio managers; investors’ sentiment can mislead market performance of a company, and it is, by the way, is a good predictor of securities overvaluation. Finally, this is a key result for financial market regulators, and the relationship between investors’ sentiment and market performance can be useful to anticipate periods characterized by excessive investors’ confidence and to adequately prevent prominent followed periods of stock market crises.
The remainder of the paper is organized as follows. Section 2 reviews the literature on the loss-aversion and overconfidence biases, and it develops our hypotheses. Section 3 describes data and methodology. In Section 4, we present our empirical results and interpret them. Finally, we conclude in Section 5 and present some limits and key features for future research.
2. Literature review and hypotheses development
2.1 Loss aversion: a psychological bias that reflects pessimism
The loss-aversion bias was explored by the theory of prospects (Kahneman and Tversky, 1979). It consists in the matter that investors do not value the gain and loss in the same way. The investor under this bias uses gain to make a decision rather than loss because he tries to avoid the risk linked to loss. An investor is subject to loss aversion if he thinks that when he did not realize a loss for the securities he holds on stock market then he realized a gain. He wants to get profit quickly from his gain by selling the security because price evolves very rapidly, he sells the asset which worth less in the market by the price he had bought it. The importance of this bias is due to his influence on investor’s decision-making in purchase and sale of securities.
Giving that loss aversion is a particular case of regret aversion, Shiller (1998) advanced that there is a human tendency to feel the pain of regret when having made errors, even for small errors, and for wishes to avoid the regret pain. Aftalion (2002) proposed an example of regret aversion:
“Paul owns shares of firm A. During the previous year, he had thought of selling them to buy in their place shares of firm B, but had renounced to his idea. If he had pursued, he would have earned $20,000. Georgette owned shares of firm B, which it sold them to buy shares of firm A. If she had kept shares of firm B, she would have been richer by $20,000” (p. 63).
The first investor is loss-averse and he does not want to sell. The second has sold and he is not subject to loss aversion. Aftalion (2002) asserted that the majority consider that the second investor normally must be less happy. We can note that mentally, the effect of loss on investor's behavior is more important than the effect of gain, what characterizes the loss aversion and explains the pessimism of investor subject to this bias. So, when investors are very sensitive to loss, they always seek to avoid it which influences absolutely their decision-making. Focusing on strategic buying and selling decisions of investors’ securities, the winning shares are much more sold than losing shares, which explains the fear sentiment of loss that can affect the investor.
Many researchers like Chau et al. (2011) and Rephael et al. (2012) have used the prospect theory to understand decisions made by the investor. They relied on normative models in which investors, based on certain criteria, maximize the utility function. In an early application of prospect theory and in terms of risk premium, Benartzi and Thaler (1995) illustrated an important gap between the returns of stocks and bonds. Their contribution using simulations is based on the Mehra and Prescott (1985) study. Always in the context of risk premium, these researchers have based on the determination of the frequency of portfolio valuation which makes investor indifferent between having a portfolio of stocks by assuming its loss aversion. It has been shown that the valuation interval has an impact on investor’s feeling of loss aversion: the more the evaluation interval is narrow, the greater the loss aversion is confirmed, and the more the securities lose power to attract investor. Barberis et al. (2001) studied loss aversion in a consumption-based model to evaluate the financial assets as illustrated by the prospect theory. Asset prices are analyzed in an economy where investors derive direct utility not only from consumption but also from fluctuations in the value of their financial wealth. The authors conclude that investors are loss-averse over these fluctuations, and the degree of loss aversion depends on their prior investment performance. Another study conducted by Thaler and Johnson (1990) showed that the degree of loss aversion primarily depends on past results when it is about gain and loss. For example: when an investor has realized gains as past results, then it becomes weakly averse to loss, but when it is a loss, he becomes strongly averse to loss. Loss aversion forces investors to keep losing investments and do not sell them in the hope that things will get lost once again. On the other hand, it motivates investors to sell their profitable stocks because they fear losing their profits (Kaestner, 2005).
Ellsberg’s (1961) seminal article has emerged from the idea that investors do not choose situations in which probability distribution of a game is uncertain. This behavior is explained by the ambiguity aversion that is at the origin of investors’ behavioral biases. Curley and Yates (1989) investigate this point by testing descriptive models in two studies. In Study 1, lotteries involved receiving a positive amount or nothing, where P denotes the probability of receiving the nonzero amount. Subjects were willing to forego expected winnings to avoid ambiguity near P = 0.50 and P = 0.75. Near P = 0.25, a significant percentage of subjects exhibited ambiguity seeking, with subjects, on average, willing to forego expected winnings to have the more ambiguous option. Study 2 tested polynomial models using diagnostic properties in the context of conjoint measurement theory. The results supported a sign dependence of ambiguity with respect to the probability level P, such that subjects’ preference orderings over ambiguity reversed with changes in P. On the other hand, Amonlirdviman and Carvalho (2010) analyzed the portfolio problem of an investor who has to choose between home and foreign equities in the presence of asymmetric co-movement in returns. Surprisingly, in the context of the home bias puzzle, the authors argue that the loss-averse investors behaves similarly to those with standard expected-utility preferences and plausible levels of risk aversion. Yang et al. (2009) discussed the problem concerning inter-temporal decision-making under uncertainty when its subject has psychological biases. Through numerical experiments they show that the optimal dividend distribution under inconsistent time preference and loss aversion is quite different from the distribution without these psychological factors, and that combinations of the two factors produce various patterns of dividend distribution. Yao and Li’s (2013) explicitly modeled bounded rationality as a decision mechanism that captures incomplete information, psychological adaptation and rational behavior. Their results highlight that the endogenous loss aversion and optimism emerge when the degree of information incompleteness reaches a certain threshold, and both grow to be more prominent when information becomes sparser.
Other studies support the notion of ambiguity aversion that justifies and explains the existence of all behavioral biases that can influence any investor. In this way, Barberis and Thaler (2002) discuss two topics, namely limits to arbitrage and psychology, and present a number of behavioral finance applications to the aggregate stock market, to the cross-section of average returns, to individual trading behavior and to corporate finance. Gebhardt (2011) study an exchange economy in which investors are loss-averse over relative consumption, that is, they suffer from utility loss if they consume less than the members of their reference group. As a consequence, there is an incentive to hold the same portfolio of risky assets as the reference group. Thus, risk premia can be supported in equilibrium that diverges from the risk premia obtained without loss aversion over relative consumption. Fortin and Hlouskova (2011) study the asset allocation of a linear loss-averse investor and compare it to the more traditional mean-variance and conditional value-at-risk investors. They find that under asymmetric dependence, loss-averse portfolios outperform mean-variance portfolios, provided investors are sufficiently loss-averse and dependence is large. Then, by using 13 EU and US assets, they show that loss-averse portfolios clearly outperform mean-variance and conditional value-at-risk portfolios and that incorporating a dynamic update of the loss-averse parameters significantly improves the performance of loss-averse portfolios.
For others researchers, people in general and even investors prefer the known to the unknown because of the fear of risk-taking that exists in different degrees and probabilities. As such Dimmock and Kouwenberg (2010) test if loss aversion affects household participation in equity markets, household allocations to equity and household allocations between mutual funds and individual stocks. They show that higher loss aversion is significantly associated with a lower probability of participation. The Grüne and Semmler (2008) study evaluates asset pricing with loss aversion in a production economy by using a stochastic growth model and a stochastic version of a dynamic programming method with adaptive grid scheme to compute the above-mentioned asset price characteristics of a model with loss aversion in preferences. As their results show using loss aversion, they get considerably better results than one obtains from pure consumption-based asset pricing models including the habit formation variant. Polman (2012) in eight studies tested the prediction that making choices for others involves less loss aversion than making choices for the self. He found that loss aversion has significantly lessened among people choosing for others in scenarios describing riskless choice, gambling and social aspects of life, such as likeably and status. Moreover, he found this pattern in relatively realistic conditions where people are rewarded for making desirable choices for others, when the other for whom a choice is made is physically present and when real money is at stake. He finish by concluding that loss aversion is moderated when factors associated with self-other differences in decision-making are taken into account, such as decision-makers’ construal level, regulatory focus, degree of information seeking and omission bias.
Some authors highlighted whether the investor has a feeling of worry or uncertainty regarding his security returns, and then an important ambiguity aversion premium will be required as compensation for ambiguity. Shefrin (2009), for example, show that the root cause of the financial crisis that erupted in 2008 is psychological. In the events which led up to the crisis, heuristics, biases and framing effects strongly influenced the judgments and decisions of financial firms, rating agencies, elected officials, government regulators and institutional investors. Examples involving UBS, Merrill Lynch, Citigroup, Standard and Poor, the SEC and end investors illustrate this point. Leung and Tsang (2013), also by using a data set that contains most real estate transactions in Hong Kong from 1992 to 2006, find anchoring and loss aversion to be important, and the results are robust to type of housing and sample period. The finding is consistent with the strong correlations among house price, price dispersion and volume found in the data. Their results suggest that anchoring and loss aversion contribute to the cyclicality of the housing market.
The equilibrium model of financial assets (black and Scholes, 1972) has long been used, but over the years, it has weakened through research studies showing that there are many factors that affect asset returns independently of market risk. Jung et al. (2009) and Bollerslev et al. (2011) state that the emergence of behavioral finance has introduced individual investor behavior (investor psychology) as a factor affecting asset returns. Shiller (1981) restated the efficient markets model in innovation form which allows better understanding of the limits on stock price volatility imposed by the model. In particular, this will enable us to see that the standard deviation of p is the highest when information about dividends is revealed smoothly, and that if information is revealed in big lumps, occasionally the price series may have higher kurtosis but will have lower variance. By conducting studies on the US market, Leroy and Porter (1981) have demonstrated the proof that fundamental value and stock price do not evolve in the same direction. Many other studies (Orléan, 2001; Stracca, 2004) have analyzed factors that can lead to market inefficiency and subsequently the integration of behavioral approach of finance. In the same way, Ho and Hung (2009) assess whether incorporating investor sentiment as conditioning information in asset-pricing models helps capture the impacts of the size, value, liquidity and momentum effects on risk-adjusted returns of individual stocks. Shu’s (2010) results indicate that both equity and bill prices correlate positively with investor mood, with higher asset prices associated with better mood. The author suggests that investor mood is a vital factor in equilibrium asset prices and returns, and integrating investor mood into asset-pricing models helps to interpret the growing body of seemingly anomalous evidence regarding investor behavior. Hoffmann et al. (2013), by combining monthly data with matching trading records, find that investor perceptions fluctuate significantly during the 2008-2009 financial crisis, with risk tolerance and risk perceptions being less volatile than return expectations. During the worst months of the crisis, investors’ return expectations and risk tolerance decrease, while their risk perceptions increase. Toward the end of the crisis, investor perceptions recover. Yang and Zhang (2013) present a dynamic asset pricing model with heterogeneous sentiments and reveal that the equilibrium stock price is the wealth share-weighted average of the stock prices that would prevail in an economy with one sentiment investor only. Moreover, heterogeneous sentiments induce fluctuations in the wealth distribution, which increases stock return volatility and induces mean reversion in stock returns.
The first part of this literature survey based on the prospect theory showed that the loss-aversion bias greatly influences an investor’s decision-making and also his investment strategies. Investor sentiment and corporate performance are two factors that may have a strong connection. Thus, the loss-aversion bias can affect firm performance, especially through the performance of the company’s assets, hence our first hypothesis:
H1. Does loss-aversion bias that reflects investors’ pessimism affects negatively the performance of US companies and then their investment decision-making and strategies?
2.2 Overconfidence: a psychological bias that reflects optimism
Overconfidence appears from different situations of overestimation. It is a bias that exists when the individual is very confident of his knowledge and abilities. Studies have shown that an overconfident investor is one who overestimates his own capacities to generate information and data which will allow him/her to build forecasts. Overconfident investors always give privilege to their own information compared to public information which is available to all investors. So the investor subject to overconfidence thinks and believes that he succeeds better by following his own ideas and intuitions than to follow the ideas and advices of others; he uses stock exchange rules which are not justified but make him satisfied; he is responsible for his portfolio management of securities; he performs buying and selling operations on stock exchange in a very frequent manner; and he truly believes that he is lucky in life. An experimental study was carried out by Russo and Schoemaker (1992) on overconfidence from a questionnaire based on a group of individuals who must give for each question an interval from minimum to maximum to be almost sure that the right answer belongs to the interval. The result is as follows: 1 per cent of individuals have nine correct answers out of ten, but the most have between four and seven wrong answers. In conclusion, most individuals have much confidence compared to their general knowledge. Dreman et al. (2001) studied overconfidence among both men and women on the basis of a sample of 220,000 US families and found that a male investor subject to overconfidence does not have the same behavior as a female investor. Indeed, men are more overconfident than women, and the explanation of this gap between the two genres is purely scientific owing to the difference in nature: the manner of thinking and the preferences of men and woman are not the same.
We notice that the market value of a security is dependent on psychological factors of investors so that they determine it. Daniel et al. (1998) explained the bias of overconfidence through a cross-sectional model of investor behavior which highlights evidence about the importance given by investor to his own information and the negligence of others. Many researchers contributed by their studies to show that price volatility is necessarily due to investor confidence. Benos (1998) studies an extreme form of posterior overconfidence where some risk-neutral investors overestimate the precision of their private information, and compete in market orders with informed traders who have rational expectations. The author shows that the participation of overconfident traders in the market leads to higher transactions volume, larger depth, more volatile and more informative prices. Jung et al. (2009) ask the question of greater uncertainty and the lack of transparency, which are typical of emergent markets and render it more likely that investors will disagree with each other and hold different portfolios, resulting in a mean variance-inefficient market portfolio. Results on Korean stock market show that with greater severity of investor heterogeneity in emerging markets, a developed market with comparable data availability, namely, Japan, shows similar but weaker test results. Lambert et al. (2012) examine the role of expertise by comparing a group of bankers (20 loan officers) and a group of students (64), control in the role of risk aversion and implement different measures of overconfidence. They conclude that overconfidence determines decision-making in a different way across the two groups. Concerning students, overconfidence influenced general tasks such as global knowledge of the assets, but when it came to investing, risk aversion had a major effect. In contrast, bankers were strongly influenced by their overconfidence. For them, it mainly affected specific tasks but, surprisingly, risk aversion had no effect on investment decision.
On the stock market, overconfidence leads investors to believe that they know the market well and they are able to anticipate the different fluctuations. Daniel et al. (1998) and Ho and Hung (2009) argue that two kinds of investors are present on financial market. The first concerns investors who dispose of private information and might be subject to overconfidence. The second concerns investors who dispose of only public information and are supposed to be rational. It is showed that overconfidence confirms the overestimation of investors compared to the accuracy of available information. De Bondt and Thaler (1985) are among the first researchers conducting an empirical test of the overreaction effect on stock prices. They indicate that losing portfolios will have a 25 per cent greater future performance than portfolios having winning securities.
According to these first findings, overconfidence may dominate rationality and survive in the long term. So an investor subject to overconfidence realizes greater profit than a rational investor because of risk-taking. Kyle and Wang (1997) deepened these results and showed that overconfidence may strictly dominate rationality, as an overconfident trader may generate not only higher expected profit and utility than his rational opponent but also higher than if he were also rational. This occurs because overconfidence acts like a commitment device in a standard Cournot duopoly. As a result, for some parameter values, the Nash equilibrium of a two-fund game is a prisoner's dilemma in which both funds hire overconfident managers. Thus, overconfidence can persist and survive in the long run. Hirshleifer and Luo (2001) offer additional explanation. Overconfident traders do better than purely rational traders at exploiting mispricing caused by liquidity or noise traders. They examine both the static profitability of overconfident versus rational trading strategies, and the dynamic evolution of a population of overconfident, rational and noise traders. Replication of overconfident and rational types is assumed to be increasing in the recent profitability of their strategies. Chuang and Susmel (2011) provide evidence that individual investors are more overconfident traders than institutional investors. For the case of Taiwan, they show that both individual and institutional investors trade more aggressively following market gains in bull markets, in up-market states, in up-momentum market states and in low-volatility market states and that only individual investor’s trade more in riskier securities following market gains. More importantly, individual investors are found to trade more aggressively following market gains in the three conditional states of the market and in high-volatility market states than institutional investors.
Others studies have empirically analyzed the relationship between overconfidence and stock price. The bias is directly attributed to the notion of learning bias, and this is explained by the overconfidence decrease due to the investors’ experiences taking into account in trading activity. Thus, forecasts tend toward rationality. Gervais and Odean (2001) develop a model describing both the process by which traders learn about their ability and how a bias in this learning can create overconfident traders. A trader’s expected level of overconfidence increases in the early stages of his career. Then, with more experience, he comes to better recognize his own ability. Huisman et al. (2012) present an alternative measurement method of investor overconfidence, using unique survey data on stock market predictions of investors. They apply the Parkinson estimate based on extreme bounds around the stock forecast to deduce investor confidence. The results support overconfidence. Corredor et al. (2013) analyze the investor sentiment effect in four key European stock markets: France, Germany, Spain and the UK. The findings show that sentiment has a significant influence on returns, varying in intensity across markets. The variation appears to involve both stock characteristics and cross-country cultural or institutional differences. Gervais and Odean (2001) and Jung et al. (2009) conclude that investors who have no experience are subject to overconfidence much more than the experienced ones.
In contrast, many studies suggest the opposite and confirm the idea that experts tend to be subjects of overconfidence more than investors without experience. Following Griffin and Tversky (1992), the pattern of overconfidence and underconfidence observed in studies of intuitive judgment is explained by the hypothesis that people focus on the strength or extremeness of the available evidence with insufficient regard for its weight or credence. This mode of judgment yields overconfidence when strength is high and weight is low and vice versa. Griffin and Tversky (1992) demonstrate this phenomenon in a chance setup, and then extend the analysis to more complex evidential problems, including general knowledge questions and predicting the behavior of self and of others. They also propose that people’s confidence is determined by the balance of arguments for and against the competing hypotheses, with insufficient regard for the weight of the evidence. They show that this account can explain the effect of item difficulty on overconfidence. Huisman et al. (2012) present an alternative measurement method of investor overconfidence, using unique survey data on stock market predictions of investors. They apply the Parkinson estimate based on extreme bounds around the stock forecast to deduce investor confidence. Their results support overconfidence.
In literature, investor behavior is considered as a factor that helps to explain stock market crisis. An increasing amount of research studies emerge focusing on studying the impact of investor’s behavioral biases on stock prices in different periods, namely, periods of tranquility and periods with environmental problems (White, 1990; Shiller, 2000; Drakos, 2010; Shu, 2010; Hoffmann, Post and Pennings, 2013). White (1990) highlights that most factors cited by historians played trivial or insignificant role. His quantitative evidence favors the view that a bubble was present in the 1929 market. Shiller (1987) analyzed the causes of stock market crisis and documented that the remarkable decrease in stock prices is mainly caused by investors’ attitudes and not by fundamental data such as interest rates or earnings. Siegel (1992) reached the same conclusions; fundamental data are not able to explain stock market crashes and high price volatility in 1987. Greenspan (1996) believes that the company’s stock market performance is realized in periods when the level of stock prices is very high because investors are becoming more optimistic. This idea was confirmed by Kliger and Levy (2010), and Chuang and Susmel (2011). Based on the Dow Jones Index and S&P 500, Solt and Statman (1988) and Clarke and Statman (1998) attempt to determine whether the investor sentiment can be considered as a reliable factor for trading in the stock exchange. They proved that there is an insignificant relationship between sentiment indicator and stock market performance. Meanwhile, Fisher and Statman (2000) used the future profitability of the S&P 500 index to show that investor sentiment may predict company’s performance in the stock exchange. A well-known study carried out by Brown and Cliff (2005) demonstrates that the more an investor is optimistic, the greater is security price than the intrinsic value, and the more he is pessimistic, the lower is the security price than the intrinsic value. In addition, a period of optimism is often followed by low-returns periods and a period of pessimism is followed by high-return periods.
Investor overconfidence depends on the value of a security which plays an important role in determining the stock market performance reflecting a company’s situation on the stock exchange. This latter is influenced by strategic decisions of investor. Market performance may also be related to manager’s ability to manage properly the company what reflects its good reputation on the stock exchange. For instance, we can quote the relationship between Steve Jobs and Apple’s performance. Steve Jobs is an American inventor, creator and founder of Apple Company which is the pioneer of the personal computer revolution. Investor confidence in the Apple brand depended on their confidence in Steve Jobs. On August 24, 2011, Steve jobs, suffering from a pancreatic cancer, could no longer be in his position and announced his final resignation. After some hours of his declaration, Apple’s stock value decreased by 5 per cent, and subsequently Apple passed from the first to the third place on the stock exchange because many investors began to lose confidence and were said to be really afraid about the future of Apple. This great story of Steve Jobs, Apple and investors supports the idea that we try to empirically investigate in this paper.
The second part of this literature survey showed that the overconfidence bias greatly influences the economic performance via the company’s stock market performance. This leads to our second hypothesis.
H2.Does overconfidence bias that reflects investors’ optimism, affects positively the stock market performance of US companies and then the US economic performance?
3. Research design
3.1 Sample selection and variables measurement
Our sample consists of 154 non-financial firms listed on S&P 100, a subset of S&P 500 index and some listed firms on the DJIA markets. The sample covers the period from the 1 January 2006 to 31 December 2016, a total of 6,777 quarterly observations. Quarterly data are collected from the Reuters base, and all US firms contained in the database are included.
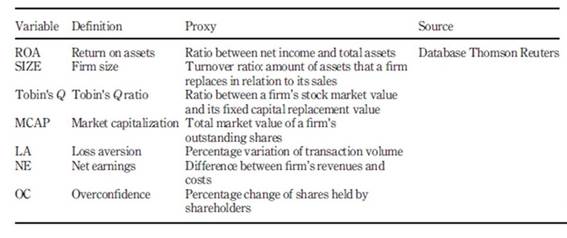
The data set retains a set of control and independent variables that may affect the market performance of companies: market capitalization, net earnings, company turnover as measures of firm size, return on assets (ROA) as an indicator of economic performance of the company and Tobin's Q ratio as an indicator of stock market performance. H1 is tested by including a loss-aversion variable which is calculated through the fast variation of trading volume within a specified period of time. The use of this variable as proxy is supported by many studies in the literature (we can cite Kahneman and Tversky, 1992; Genesove and Mayer, 2001; O’Connell and Teo, 2009; Gomes, 2005). To test H2, we define the overconfidence variable which is proxied by the percentage change of shareholders’ capital. The choice of this variable proxy follows the studies of Malmendier and Tate (2005), Heaton (2002) and Michailova (2010). Table 1 summarizes the variables’ definition and source.
3.2 Methodology
We conduct fixed-effect regressions to test the hypotheses formulated in the survey of literature. More precisely, we use two panel fixed-effect models to capture both the effects of loss-aversion and overconfidence biases in economic and market performance of US companies. The choice of the fixed-effect model is justified by the results of the both tests of F-statistic (homogeneity test, i.e. Wald test: P(F-statistic) < 0.05) and Hausman test (χ2 test). The fixed-effects model is shown to be the most appropriate one rather than the pooled regression model (pooled OLS) or the random effects model (very significant χ2 value at the 1 per cent, 5 per cent and 10 per cent levels). In general, pooled panel data analysis is more appropriate to use only when the data are a mixture of time series and cross section, and the sample observation is small, which is not the case of our sample. In addition, the Durbin-Watson test indicates that serial correlation does not pose a problem for our models.
ROA and Tobin’s Q are our performance measures of this study. The ROA is considered as a factor measuring company’s performance as well as its management performance. It informs how much can company recover from its assets value. ROA is extensively used in the financial literature as a proxy of firm performance (Karaca and Ekşi, 2012; Chari et al., 2012; Miranty and Sisnuhadi, 2011; Valenti et al., 2011; Geletkanycz and Boyd, 2011; and Prabowo and Simpson, 2011). Also, Tobin’s Q ratio is a generally accepted measure for market performance in the literature (Tobin and Brainard, 1968; Tobin, 1969; Chung and Pruitt, 1994; Lei and Song, 2011; Bozec et al., 2010).
The basic model used to detect the effect of loss aversion on the economic performance (H1) can be written as follows:

H1 predicts that the coefficient of loss-aversion variable, LA will be significant, suggesting that loss aversion of investors has an impact on the ROA of US companies. The model controls a number of other variables that prior research has found to explain the economic performance of companies.
Analysis examining the effect of overconfidence among investors on market performance (H2) is expressed in the following regression model:

H2 predicts that the coefficient on overconfidence variable OC will be significant. We seek to check whether investors operating on the US stock markets exhibit overconfidence in their behavior that has an empirical impact on stock market performance. The model uses a number of other variables to determine more observable effects on market performance of companies.
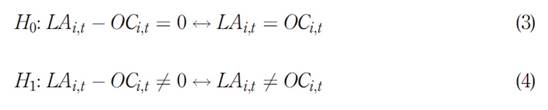
In this paper, we also evaluate the normality of the loss-aversion and overconfidence effects of US investors on a company’s performance. Then we discuss the dominance of one bias compared to the other in the US markets based on a paired-sample t-test between the percentage variation of transaction volume representing loss aversion and the percentage variation of shares held by shareholders referring to overconfidence. The hypothesis of our paired sample t-test looks as follows:
4. Results
4.1 Descriptive statistics and Pearson correlations
Table 2 provides descriptive statistics for the main variables in the two different sectors considered in the analysis (industry and service sector). Model 1 reports information on the variables used to test H1. Model 2 reports information on the variables used to test H2. The information is analyzed on 6,777 observations over the full period (2006-2016).
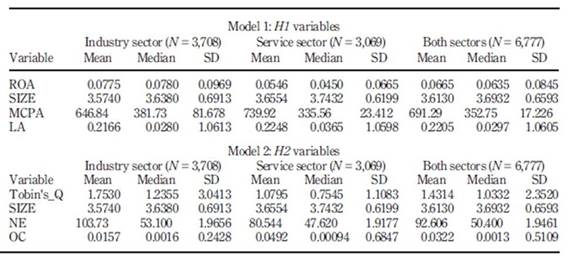
The normality test shows that all variables - ROA, company size, market capitalization, loss aversion (percentage of trading volume), Tobin’s Q, net earnings and overconfidence (percentage variation of shares) - are not normally and symmetrically distributed, as their skewness is different from 0 and their kurtosis largely exceeds 3. Thus, the symmetry information assumption is rejected but if loss-aversion and overconfidence behavior are detected in the US S&P 100, US S&P 500 and US DJIA markets, it would be an asymmetric behavior (the values of skewness and kurtosis from descriptive statistics are not presented here but they can be provided upon request).
As can be seen in Model 1, the ROA has a mean of 7.75 per cent and a median of 7.80 per cent in the industry sector, which are higher than that in the service sector (5.46 per cent and 4.50 per cent). The mean size of the firms in the sample measured in terms of a company’s revenue is $3,574m for the industry sector and $3,655 for the service sector, which is close to the median (3.638 and 3.743, respectively). The mean market capitalization of the companies investigated is $691.29m with a median of $352.75m and a standard deviation of 17.226 per cent. In addition, the mean of the loss-aversion bias (i.e. the trading volume change as defined above) for the overall sample is about 22.05 per cent of the asset returns with a standard deviation of 106.05 per cent.
Findings of Model 2 also show that, on average, the mean and median of Tobin's Q ratio are greater for firms belonging to the industry sector than that of service sector (1.7530 against 1.2355, respectively). The mean net earnings is about $103.73m and $80.544 for the two sectors, although the medians are very close to each other and the standard deviations are almost the same. Finally, the variable of overconfidence (i.e. the change of shares held by shareholders as defined above) is lower on average and volatile. We record a mean of 3.22 per cent and a standard deviation of 51.09 per cent during the period 2006-2016.
A Pearson correlation matrix was used to test the direction and the magnitude of the linear relationship between the dependent, explanatory and independent variables used in our models. This test helps discover the potential presence of multicollinearity among the variables. As shown in Table 3, the Pearson correlation coefficients appear to be relatively low and there is no important multicollinearity between the variables. Also as expected, the economic performance measured by the ROA is positively correlated with the company size and market capitalization (MCAP) (p-value = 0.0000 for the US industry sector companies). Meanwhile, there is generally a negative statistically significant correlation of investors’ aversion to loss with firms investment performance (ROA), which is higher for US companies in service sector (p-value = 0.0290) than for US companies in the industry. Results of Model 1 confirm H1 that the loss aversion of investors has a quite high significant impact on the economic performance of US companies.
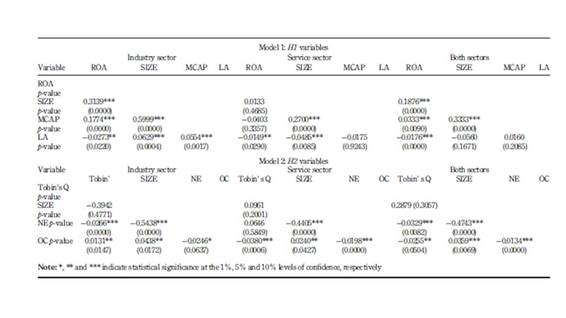
Consistently, the stock market performance expressed by the Tobin's Q ratio is positively correlated with the company size (p-value = 0.3057 for both sectors), but negatively correlated with net earnings of a company (NE) (p-value = 0.0082 for both sectors), suggesting that high-growth firms will create more investment opportunities to attract new investors by paying fewer dividends to actual shareholders. On the one hand, we remark a strong positively significant relationship between investors’ confidence and market performance for US industrial firms (p-value = 0.0147). On the other, given the low level of correlation found between these two variables for US service firms (p-value = 0.0006), it is necessary to say that the relation is negative and statistically significant. Accordingly, the evidence of H2 is confirmed and overconfidence behavior of investors impacts the market performance.
4.2 Empirical results
4.2.1 Loss aversion and overconfidence effects of investors on market performance: quarterly estimates.
Results are presented in three steps. We look firstly at the results of the loss-aversion and overconfidence effects. We do it separately as it is the most important step of our analysis. Then we look at the normality of distributions of the research variables. Finally, we present evidence of a bias dominance among the investors in US markets. To identify the impact of behavioral biases, we use the panel fixed-effect model as justified in the methodology. Table 4 summarizes the results of the estimated regression models.
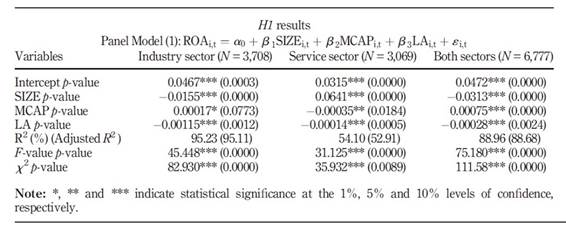
Table 4 reports the estimation results of panel data for H1 testing the effect of loss aversion on the economic performance of US companies. The regression covers the full period of analysis (2006Q1-2016Q4) for the two sectors of activity (industry and service). Most of the regressed variables on the asset returns are statistically significant. This result implies the existence of a loss-aversion bias effect on the economic performance of companies in the US Stock Exchange. Thus, H1 is a well-confirmed hypothesis.
According to Table 4, the model is highly significant (F = 75.180, p-value = 0,000) and has a coefficient of determination R2 of 88.96 per cent. This means that independent variables explain 88.96 per cent of the variation in the dependent variable ROA. The estimates indicate that in the US market, the variable LA (represented by the company's trading volume change) negatively affects asset returns (ROA) of companies. This result is negative and statistically significant for the industry sector as well as for the service sector. The other variables in our model (SIZE and MCAP) are statistically significant at the 1 per cent, 5 per cent and 10 per cent levels for both tested sectors. Specifically, in the industry sector, the variable LA negatively affects the ROA of US companies with a coefficient of −0.00115. In the service sector, LA also has a negative impact on the ROA, but this impact is less important with a coefficient of −0.00014. By focusing on both sectors at the same time, we find that the LA coefficient is less important than that of the industry sector and more important than that of the service sector. It is equal to −0.00028. As for the SIZE and MCAP variables, their effect differs between the two sectors. For the first sector, its coefficients are important, respectively, negative and positive (−0.0155, 0.0641), while they are less significant, respectively, positive and negative (0.00017, −0.00035) for the second sector.
The negative impact of loss aversion on the ROA of US firms regardless of the sector of activity - industry or service - shows that the more the investor is loss-averse lower is the economic performance of the company. More precisely, the loss aversion evolves with the ROA of US firms but in the opposite direction. The more investors are loss-averse the more the ROA is negatively influenced. Indeed, it is not in the interest of companies that they invest in securities that they hold loss aversely because their loss aversion due to their risk aversion leads them to a risky economic situation. Loss aversion features the pessimistic investor and unfavorable market conditions or even the remarkable events in the American society which may push an investor to be loss-averse in his strategic investment choices for any period. Indeed, when the transaction volume (trading volume) of a firm varies in a random manner, it reflects an investor's reaction vis-à-vis his loss aversion, but we have previously observed that loss aversion negatively affects the economic performance of companies independently from their sector of activity, and then this bias is attached to the investor personality. Therefore, we can notice that if the company or market situation encourages investing, the investor subject to loss aversion remains under its own principles.
A second set of estimates conducted on panel data covering the full period of analysis (2006Q1-2016Q4) for the two sectors of activity (industry and service) test H2. The purpose is to check whether the overconfidence investors’ bias has an effect on the stock market performance of US companies. Table 5 reports the estimation results of this quarterly panel data regression. The regression coefficients are statistically significant for all variables. The results from the regression model therefore support the previous discussion of an overconfidence effect and provide evidence for the approval of H2.
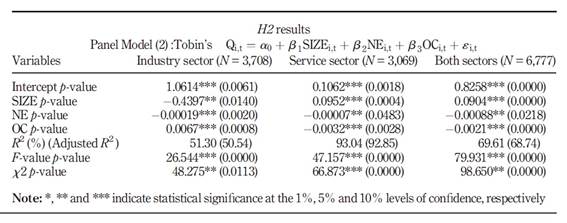
As it is shown in Table 5, this model is overall significant (F = 79.931, p-value = 0.000), the coefficient of determination (R-squared = 0.6961) shows that 69.61 per cent of the variation in the dependent variable (Tobin's Q ratio) can be explained by the model regression. The variable OC (represented by the change in shares held by shareholders) is positive and statistically significant for the industry sector, while it is negative and statistically significant for the service sector. The other variables (SIZE and NE) are statistically significant for the two sectors at the 1 per cent, 5 per cent and 10 per cent levels. Interestingly, we find that the variable OC positively impacts the Tobin's Q of US companies with a coefficient of 0.0067, but in the service sector, it negatively impacts the Tobin's Q with a coefficient of −0.0032. By focusing on both sectors at the same time, we notice that the OC coefficient is positive and more important for the industry sector than for the service sector. Some other interesting relations arise from the SIZE and NE variables in the two sectors. First, the coefficients of revenue SIZE take the negative and positive sign, respectively, and are importantly related with Tobin's Q ratio (−0.4397, 0.0952). Second, the NE earnings variable is always negative in relation with Tobin's Q but less important (−0.00019, −0.00007).
Investor overconfidence has a positive impact on the Tobin's Q of the US firms in the industry sector, while for the service sector, this impact is negative. This suggests that stock market performance of companies can be positively or negatively influenced by overconfidence. Particularly, the overconfidence evolves with the Tobin's Q of US firms. But, either they evolve positively and therefore in the same direction, or negatively and therefore in the opposite direction. In light of these results, it is in the interest of an industrial company that it invests in the securities that it holds overconfidently because overconfidence allows it to improve its stock market performance. However, it is not in the interest of a service company that it invests in the securities that it holds overconfidently because overconfidence leads it to a low stock market performance. Overconfidence characterizes the optimistic investor. Unfavorable market conditions or remarkable events in the American society may push an investor to be overconfident in his strategic investment choices for any period. Indeed, when the change in shareholders’ capital of firm varies (increases or decreases) in a remarkable manner, it reflects investor's reaction to his overconfidence; however, as previously proved, overconfidence positively affects market performance of industrial companies and negatively affects that of service companies, and this bias might not be only attached to the investor personality but also to that of the market or the firm itself. We conclude that the overconfidence effect depends on the sector of activity and can lead a US company to improve its performance and to drive another impediment to its performance.
4.2.2 Non-normality of the research variables: non-normality of loss-aversion and overconfidence effects and non-normality of economic and market performance.
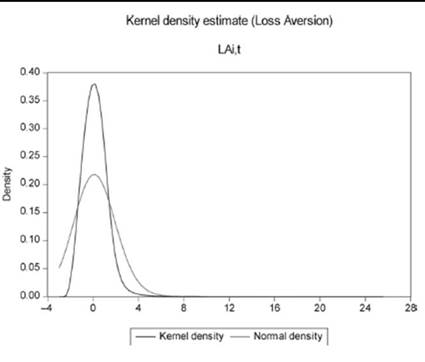
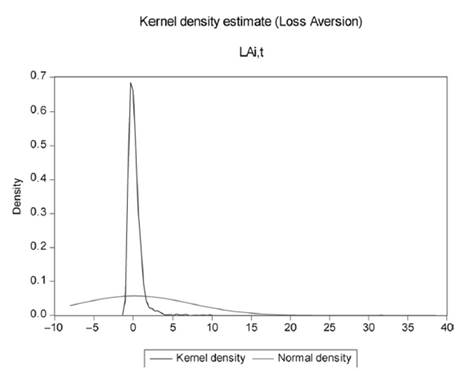
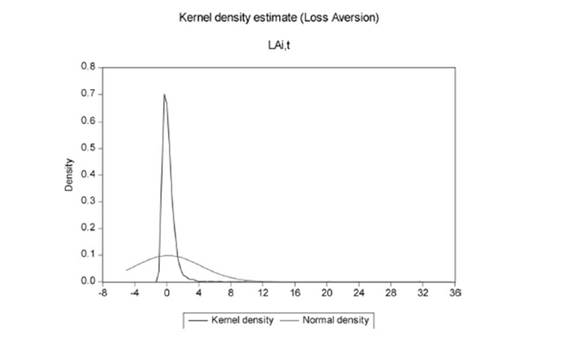
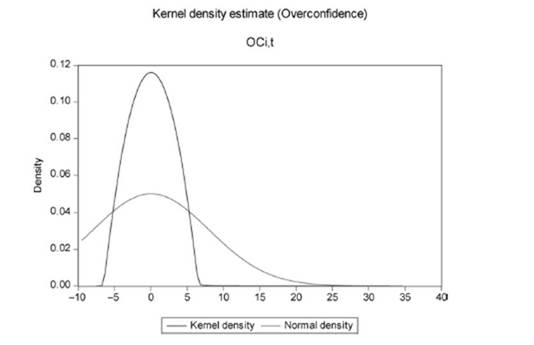
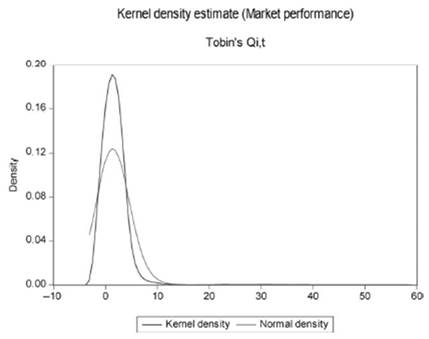
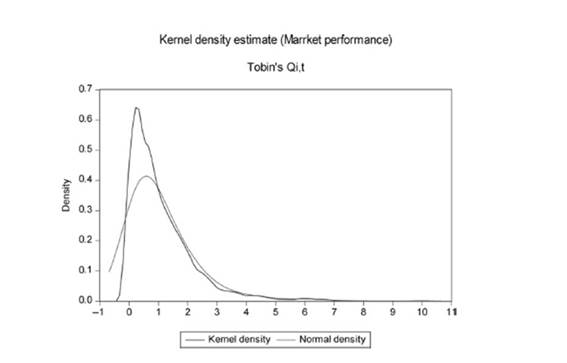
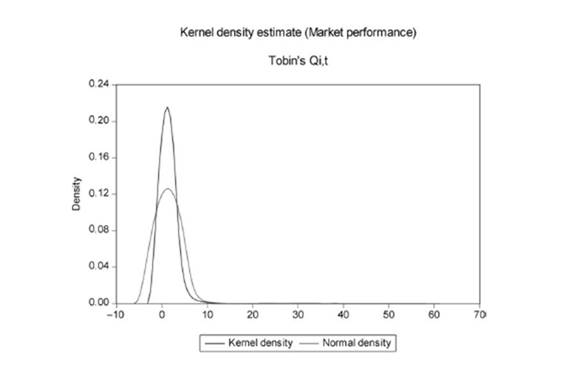
Normality of distributions of the research variables is examined through a Kernel density estimate graph (normality curve). The following figures provide the test results over the normal distribution.
Figures 2, 3 and 4 compare the loss-aversion curve represented by the company's trading volume change in the both sectors to the normal distribution curve. We observe an important gap between these two variables. However, we have already found in previous tests that the loss-aversion variable negatively influences the ROA of US companies regardless of the sector analyzed. Therefore, it is in the interest of US companies that an investor begins to protect himself against loss aversion. In fact, from these figures, we show that the loss-aversion effect is pushed aside from the normal distribution for all firms (industry and service), whereas the ideal for firms is that this effect be close to normal. The more the two curves are close, the less the US companies are worried about the impact of this bias on their economic performance.
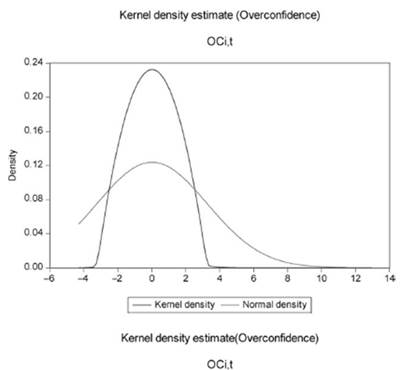
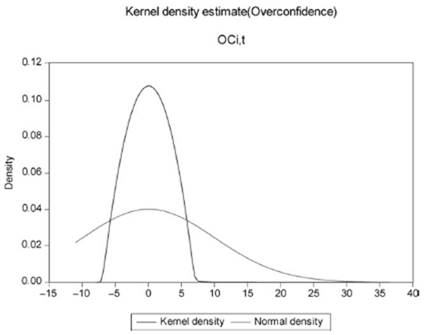
Figures 5, 6 and 7 compare the overconfidence curve represented by the change in shares held by a company’s shareholders to the normal distribution curve. An important gap is observed between the two variables despite previous results indicating that this variable positively influences Tobin's Q ratio of US companies in the industrial sector. Therefore, it is not in the interest of industrial firms that an investor begins to protect himself against overconfidence while it is for the interest of service firms that he does it. We conclude that the overconfidence effect is pushed aside from normal distribution for all firms, whereas the ideal for firms is that this effect is close to normal. The more the two curves are close, the less the US companies are worried about the impact of this bias on their stock market performance.
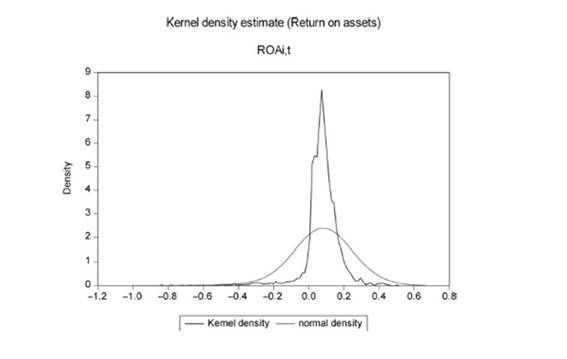
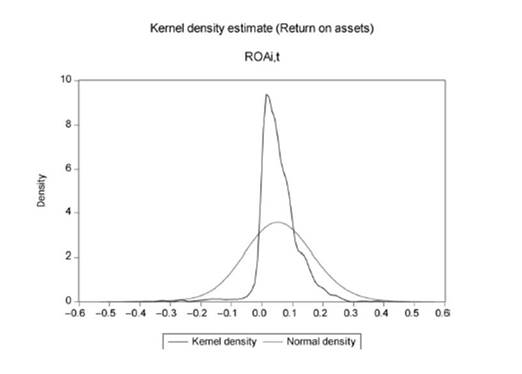
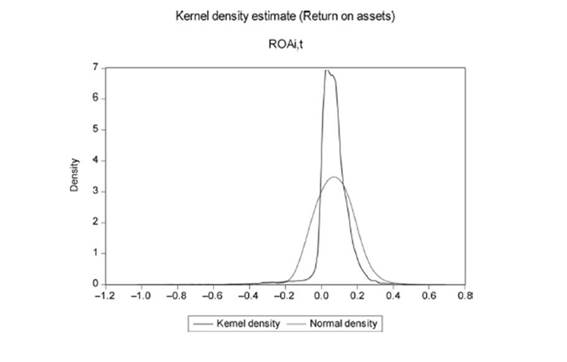
Figures 8, 9 and 10 show that the ROA of US companies (ROA) in the two sectors analyzed (industry and service) is pushed aside from the normal distribution. As previous finding indicates, ROA is negatively influenced by loss aversion, we confirm that the loss-aversion bias of an investor is one of the factors leading the economic performance curve to deviate from its normal distribution regardless the sector of activity of the company.
Lastly, Figures 11, 12 and 13 illustrate that the Tobin’s Q ratio of US companies in the two sectors analyzed is slightly pushed aside from the normal distribution. The Tobin’s Q ratio is previously found to be positively influenced by overconfidence for industrial firms and negatively influenced for service firms. Thus, we confirm that overconfidence bias of investor is one of the factors leading the stock market performance curve to deviate from that of the normal distribution regardless the sector of activity of the company.
The non-normality of variables previously established does not introduce biasness in the model or incorrect estimates and invalidates our regression technique. This is because in sufficiently large samples, linear regressions do not require any assumption of normal distribution (Diehr and Lumley, 2002). Only residuals need to be normally distributed.
4.2.3 Dominance of investor overconfidence compared to loss aversion.
We seek to answer empirically the following question: Does an investor tend to be loss-averse or rather overconfident? Loss aversion is a sentiment that reflects pessimism, while overconfidence reflects optimism. Theoretically, the investor cannot be subject to two biases at the same time. Table 6 shows the results of paired-sample t-test between the percentage variation of transaction volume measuring loss aversion and the percentage of variation of shares held by shareholders measuring overconfidence. The hypothesis proposed by this test is that the difference between the two percentages is equal to 0.
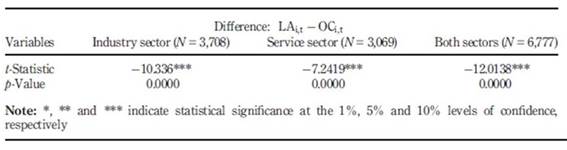
The empirical results for both sectors of activity suggest that the difference between the two variables is less than 0. This means that overconfidence dominates loss aversion. In other words, investors tend to be overconfident rather than loss-averse. The dominance of overconfidence compared to loss aversion shows that investors of US companies are rather optimistic. However optimism although it can lead to company's stock market performance, it can also negatively influence it as we have previously pointed that overconfidence positively influences the stock market performance of industrial firm and negatively that of the service firm.
5. Conclusion
This paper looks at the impact of loss-aversion and overconfidence biases on the performance of US companies. We provide evidence supporting that companies’ performance in the US financial markets as measured by economic and market performance is significantly influenced by these two behavioral biases. This result is confirmed by the pioneer’s study of De Bondt and Thaler (1985). Investors’ pessimism reflecting loss aversion is showed to negatively influence the economic performance of US companies, whereas investors’ optimism reflecting overconfidence positively influences the stock market performance of companies. These later findings are largely supported by empirical studies such as Han et al. (2015) and Berger and Turtle (2012), implying that an overconfident investor may benefit shareholders through higher stock returns, greater profitability and lower risk, when the loss aversion may exert the opposite effect.
More specifically, our results suggest that it is for the interest of US companies that the investor be less pessimistic and starts to protect himself over loss aversion. However it is not for their interest that the investor protects himself against overconfidence when companies belong to the industry sector. Controversy, in the case of service sector’s companies, is that it is more suitable that the investor be less overconfident. We explain these results by the view that the overconfidence effect differs from one sector to another because the competition among industrial companies is rougher and more severe than between service companies. This corroborates Lambert et al. (2012), and Dreman et al. (2001) results, implying that overconfidence determines decision-making in a different way across different groups of investors. We also highlight that investor in service sector is less faithful than that in the industry sector. Even though the investor in the service sector is overconfident about the service company, his overconfidence may deviate to another company easily, but in the case of an industrial company, the overconfident investor may be more loyal. Indeed, as showed by Just et al. (2009), competition between two industrial products with a similar utility is more difficult than competition between two services, which justifies why investors’ faithfulness to an industrial product is more important than his fidelity to a service.
CEO overconfidence has a positive impact on the firm performance, implying that overconfident CEOs may benefit shareholders through higher stock returns, greater profitability and lower risk. Our results show that overconfident CEOs do a better job managing underwriting risk, leading to higher underwriting returns and, consequently, better firm performance.
Finally, our results show that the existence of both these cognitive biases is able to push aside the firm from normal situation, but this is not always beneficial because it is more suitable that it deviates from normal only toward performance. It is also important to highlight that theoretically and empirically, loss aversion is dominated by overconfidence in both sectors. The probability that an investor is subject to overconfidence is greater than the probability that he is loss-averse on the US Stock Markets.
This research can be extended by focusing on the question: What is the impact of the opposite effect of investor’s loss aversion and overconfidence on the US company performance in the case of occurrence of stock market crisis or crashes?

