


 English (pdf)
 Article in xml format
 Article references
 Send this article by e-mail
 Cited by SciELO
  Similars in
SciELO
Similars in
SciELO 
 Permalink
Introduction
After the financial crisis of 2008, both academics and professionals have focused their attention on the cash holdings of firms as these are thought to affect the investment prospects, the risk, and therefore, the expected profitability of the stocks in the future (Rao et al., 2013). While there are studies on the determinants of cash holdings, as well as studies on their relationship with the value of the firm, those about the relationship between cash holdings, risk and expected equity return are very scarce. Also, the findings serve as a reference for firms in developed economies such as those of the US and Europe, whose capital markets are deeper and more developed, and therefore, do not present agency problems and information asymmetries, as is the case with markets emerging economies (Deloof, 2003).
According to Uyar and Güngörmüş (2013), emerging markets differ from developed markets in the following aspects, namely, weak regulatory framework, fragile corporate governance, weak protection of minority shareholders and poor disclosure of information. These factors have consequences for firms operating in emerging markets, generating agency problems and an increase in the costs associated with external financing. Therefore, the degree of information asymmetry affects the levels of cash holdings, which means that firms that operate in countries where the levels of information asymmetry are higher have lower levels of cash holdings (Chung et al., 2015). Hence, it was expected that the negative relationship between information asymmetry and cash holdings found for emerging countries would impact the relationship between cash holdings and expected equity return.
Despite being a subject of such importance, few studies address this problem, the works of Palazzo (2012) and Simutin (2010) are clear exceptions. These studies have provided empirical evidence that firms with higher risk, i.e. those that have a greater correlation between their cash flows and the performance of their stocks, generally have higher cash levels, as they are more susceptible to experience cash deficits in the future (Palazzo, 2012). Accordingly, a high level of corporate liquidity will signal financial constraint risk and will be associated with a higher expected return (Wang, 2012). Therefore, if the level of cash holdings indicates various sources of risk such as cash flow volatility and financial constraints, it is expected that those firms that accumulate more liquid assets do so because they have more volatile cash flows, and therefore, high risk is associated with a higher expected equity return (Simutin, 2010).
Nevertheless, these studies are concentrated exclusively in North American firms, whereas, for emerging economies, especially in Latin America, studies are scarce and information on the relationship between cash holdings, risk and expected equity return has not been researched. Given the above, there was a need to observe these relationships in emerging markets, where agency problems and information asymmetry are more pronounced because their capital markets are less developed (Deloof, 2003). In other words, economic and financial structures vary considerably in emerging countries compared to developed countries, and the results of most of these studies for developed countries are not fully replicable and generalized in the context of Latin American economies.
This paper is divided into five sections. Section 2 presents the literature review of cash holdings and expected equity return. Section 3 contains the methodology and provides a deep understanding of the relationship between cash holdings, expected equity return and risk. Section 4 contains the results of the research. Finally, Section 5 concludes and provides recommendations for future research and explains the implications from a perspective both theoretical and practical.
2. Literature review
Cash holdings have been a subject of particular interest in corporate finance for the past 20 years. The seminal work of Opler et al. (1999) supports this idea. While it is true that in the literature the study of the determinants of cash holdings accounts for the great majority of contributions, the topic has also been studied concerning other important concepts in the field of corporate finance such as the value of the firm, financial risks and corporate governance. However, few works have studied its relationship with the expected equity return. The search process evidenced that the studies are few and very recent, mainly after the crisis of 2008, when corporate liquidity began to be incorporated as a risk factor capable of predicting expected equity return. The first study to address this relationship corresponds to that of Simutin (2010), in which it was established that there is a positive relationship between the excess of corporate cash and the expected equity return, arguing the firms with more cash in excess have higher market betas and lower yields during market crises. Also, firms with high excess cash invest much more in the future than their low-cash peers but do not experience a higher expected equity return was said by the author. In general, this evidence is consistent with the notion that excess cash holdings represent risky growth options (Brick and Liao, 2017).
Afterwards, Palazzo (2012) carried out a study using a sample of firms such as Simutin (2010) in which he developed and empirically tested a model that highlights how the correlation between cash flows and a source of risk affects the optimal cash holdings policy of a firm. In their model, riskier firms (i.e. firms with a greater correlation between cash flows and risk) are more likely to use external financing to finance their growth option exercises, and thus, gain greater savings. This saving motive, as a precaution, implies a positive relationship between the expected equity returns and the cash holdings; in addition, this positive relationship is stronger for firms with less valuable growth options (Palazzo, 2012).
Similarly, Wang (2012) examines the effect that corporate liquidity has on stock returns of the firm and found that firms with more cash have higher expected equity returns because they engage in higher risks. In general, firms with greater corporate liquidity tend to be smaller, have a higher beta, more volatile cash flows and more financial constraints. He also established that corporate liquidity contains risk information different from that of the size and value factors of the Fama French model, suggesting that corporate liquidity can serve as a proxy for cash flow risk and the risk of the financial constraint of firms (Wang, 2012). Nevertheless, and in contrast to previous studies, Sodjahin (2013) tests the positive relationship between these two variables using a new measure of cash holdings, indicating that, different to Simutin’s (2010) and Palazzo’s (2012) proposal, it is the changes in the level of cash holdings, not the cash holding alone, which has a greater power to predict the expected equity return. However, their results are in line with the above. Likewise, this relationship was tested by Rao et al. (2013), who concluded that cash holdings can predict the future performance of a firm’s stocks and that firms with higher cash holdings, on average, experience higher returns, suggesting that investors should pay close attention to cash holdings when making investment decisions. More recently, Chen et al. (2016), using a real option component of cash holdings, concluded that stock returns of firms with higher cash holdings have a positive correlation with the shock to the real option component.
The literature review process reveals that while the issue of cash holdings has been studied from different approaches, these studies have not addressed the relationship between cash holdings and expected equity return in emerging countries, which are characterized by having a high degree of asymmetry of information. This condition implies the need to theoretically validate the proposed relationships in a scenario characterized by information asymmetry such as the firms that belong to the Pacific Alliance. Thus, as the literature review does retrieve studies for emerging economies, but only a few whose scope only includes developed economies, this condition indicates that there is a gap in the literature in terms of asset valuation models, therefore it becomes the motive for the development of the present research.
3. Methodology
3.1 Sampling frame
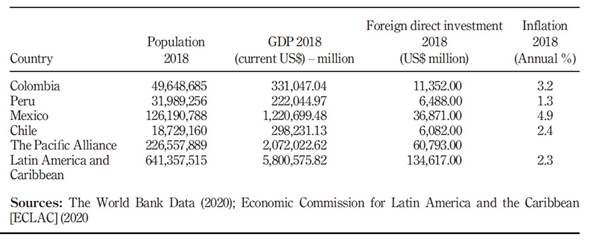
To examine the relationship between cash holding, risk and expected equity return, we constructed a panel of Pacific Alliance firms. We selected this sample for different reasons. On one hand, on the macroeconomic level, the Pacific Alliance represents a critical trade bloc in Latin America. As Table 1 reports, the Pacific Alliance population represents 3% of the total population of Latin American and the Caribbean. Concerning economic growth, Pacific Alliance countries represent 36% of the total gross domestic product of Latin America and the Caribbean. Similarly, in 2018, the countries of the Pacific Alliance received 45% of total foreign direct investment in Latin America and, as a whole, the four countries make up the eighth largest economy in the world (Alianza del Pacífico, 2020).
Additionally, the stock exchanges and depositories of these four countries represent the largest capital market in Latin America since 2011. This market is named The Latin American Integrated Market, which had a market capitalization of USD 763,573 MM to February 2020 (Mercado Integrado Latinoamericano (MILA), 2020). Table 1 displays some economic indicators of the countries considered in this study.
3.2 Data
We obtained the data used for this research from DataStream. We take quarterly data from the financial statements of the listed firms of the Pacific Alliance countries for the period ranging from 2010 to 2016. Following the prior literature on cash holdings, we excluded banks, financial firms, trusts and utility firms (5,510, 5,550, 5,560 and 5,910 codes according to Thomson Reuters Business Classification). Also, we eliminated firms with negative equity, firms with a total debt to total asset ratio greater than one, and firms with a negative dividend pay-out ratio (Simutin, 2010; Sodjahin, 2013; Palazzo, 2012; Wang, 2012). To reduce the impact of outliers, we winsorized accounting variables at the top and bottom 1% to avoid the results of the analysis being affected by extreme values (Brick and Liao, 2017; Chen et al., 2016; Palazzo, 2012). Our final sample consisted of an unbalanced panel with 215 firms and 3,361 observations.
3.3 Variables
Return on stock (r) corresponds to the quarterly return of the stock. We estimated firm size (ASSETS _ LN) as the natural logarithm of the book value of total assets. (MKCAP_LN) correspond to the natural logarithm of market capitalization. We obtained the book to market equity ratio (BEME) as the book value/market value of the equity. We calculated cash holdings (CH) by the total cash to total assets ratio. (CH_DEV) is the standard deviation of CH over the past six quarters. Cash to net assets (CHNA) is the ratio of cash to net assets (total assets minus cash). We calculated leverage (LEV) by total debt divided by total assets. Cash flow (CFA) corresponds to the operating cash flow (income before extraordinary items) and was calculated as cash flow divided by total assets. We estimated cash flow volatility (CFA_DEV) as its standard deviation over the past six quarters. Dividends (DIVP) is the amount paid for a firm to its owners over operational income.
So, as a robustness check, another alternative way to measure cash holdings was calculated, where cash holdings were estimated by the ratio of cash to net Assets (CHNA) and net assets are equivalent to total assets minus cash (Dittmar et al., 2003; Faleye, 2004).
3.4 Hypothesis
According to Simutin (2010), the information captured by the cash holdings may be related to the expected equity return, risk, investment options and profitability of the firm in two different ways. On the one hand, excessively high levels of cash may indicate managerial concerns about future operating cash flows and investment opportunities, insinuating a positive link between excess cash and expected return on investment, as cash may be considered as a mitigating factor in the face of future volatility of cash flows. Based on the above, we tested the following hypotheses:
H1a. There is a positive relationship between cash holdings and the firm’s expected equity return.
H1b. There is a positive relationship between cash holdings and the firm’s systematic risk.
H1c. There is a positive relationship between cash holdings and the firm’s idiosyncratic risk.
4. Results
We analysed the data using STATA software. Table 2 reports summary statistics of the variables used in this study and shows the average (mean), standard deviation (Sd), the median, the 5th, 25th, 50th, 75th and 95th percentiles.
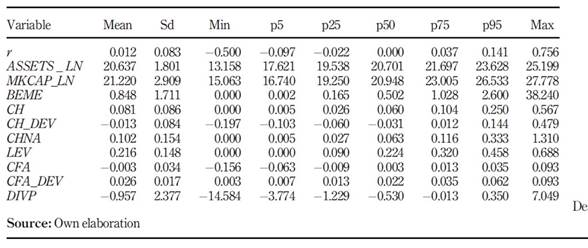
As shown in Table 2, the mean of cash holdings was 8.1%. When we compare this finding with the results of studies conducted for developed countries the average value of cash holdings is lower (Al-Najjar and Clark, 2017; Brick and Liao, 2017; Lozano and Caltabiano, 2015; Wang, 2012). These findings suggest that on average, firms in emerging economies tend to have fewer liquid assets as a proportion of their total assets in contrast with firms in developed countries, where the cash holdings ratio tends to be higher.
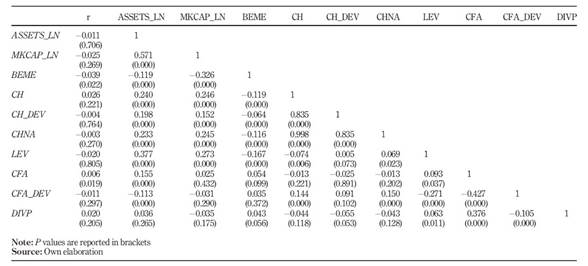
On the other hand, Table 3 reports the coefficients of correlation between variables used in this study. Cash holdings (CH) are positively correlated with return (r). This result provides preliminary support to H1a. Cash holdings (CH) is also positively correlated with size, cash flow volatility and market capitalization. Conversely, the correlations between cash holdings and book to market equity ratio (BEME), dividends (DIVP), leverage (LEV) and cash flow to assets (CFA) were negative. These results are in line with previous studies and support the idea that firms with higher levels of cash holdings tend to have lower levels of debt (Al-Najjar and Clark, 2017; Wang, 2012).
4.1 Findings
Fama and French (1993) established a multifactorial asset valuation model, which consists of a model composed of three risk factors. The first factor (MKT) is the market factor that represents the market risk, and, for the case of this research, we take as each one of the indexes of the Stock Exchanges for each country (COLCAP index for Colombia, IPSA for Chile, IPC for Mexico and IGBVL for Peru). The second factor called SMB (small minus big) is the risk factor associated with the size according to its market capitalization. The HML (high minus low) factor is a measure for the risk factor associated with the value according to its book to market equity (BEME) ratio, which consists of the quotient of the book value of the stock and the market value.
Subsequently, we estimated the return factor portfolios. For this purpose, we calculated the quarterly return on a stock as the change between the current value of the stock in the quarter and lagged value previous quarter. For the risk-free rate (Rt) we used a three-month bond rate from each country. We constructed expected excess portfolio return (r) as the difference between the return on stock i in the quarter t (ri,t) and the risk-free rate in the quarter t (Rt). Then, we estimated the return of the market as the quarterly return from the market index for each country. We obtained the data on both risk-free rates and market indexes from Bloomberg.
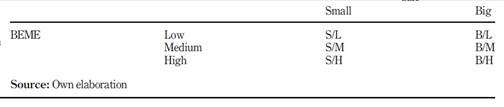
To build the portfolios, we divided the sample into two groups according to their size, measured by market capitalization, namely, big firms (B), which contains the stocks with the highest market capitalization and small firms (S) and composed of the stocks with the lowest market capitalization. Subsequently, we ordered each group of stocks by its BEME ratio from highest to lowest and was divided into three groups called: Low, stocks with a low BEME ratio; Medium, stocks with a medium BEME ratio and High, stocks with a high BEME ratio. From this classification, we built six quarterly portfolios. In Table 4, we show the portfolios that were created, where S/L portfolio corresponds to stocks with low market capitalization and low BEME ratio; S/M portfolio, stocks with low market capitalization and medium BEME ratio; S/H portfolio, stocks of low market capitalization and high BEME ratio; B/L portfolio, stocks with high market capitalization and low BEME ratio; B/M portfolio, stocks with high market capitalization and medium BEME ratio and B/H portfolio, stocks with high market capitalization and high BEME ratio.
Once we had built the portfolios, we estimated the betas of the factors considered by each model within a time series. We estimated these betas as a systematic risk measure; we calculated the betas through a regression between the monthly return on the stock in period and the market index return for each country. It should be clarified that the betas obtained in this step correspond to the unlevered beta so that its calculation is isolated from the effect of the capital structure of the firm.
To estimate the relationship of cash holdings, expected equity return and risk, first, we sorted the portfolios from the highest to the lowest level of cash holding. Then, we examined the relationship between firms with the highest returns and those with higher cash holdings to determine if the cash holdings are considered as compensation for a higher level of risk. For this purpose and following previous studies, we estimated a fourth factor (Palazzo, 2012; Simutin, 2010; Wang, 2012). We called this factor cash holding (CH) and we calculated it as the proportion of cash and equivalents accounts that the firm has in relation to its total assets for a given period (Belkhir et al., 2017; Brick and Liao, 2017; Wang, 2012). We used the following model to examine the relationship between cash holdings and the expected equity return:

Where is the return on portfolio in period (dependent variable) and is the three-month bond rate. is the portfolio excess return; MKT, SMB and HML represent the slopes of each of the expected premiums. While, , correspond to the coefficients of the return on market factor, size factor and value factor, respectively. CH is the cash holdings variable. Alpha is the intercept and is the error term.
4.2 Cash holdings and expected equity return
In this section, we present the results of the estimations of a set of models that we use to test the first hypothesis. In the first stage, we explored how a firm’s cash holding affects the coefficient on expected equity return. So, we regressed expected equity return against the independent variables (Palazzo, 2012; Simutin, 2010; Wang, 2012). In this regression, the main independent variable was cash holdings (CH), and the variable dependent in all the models was the expected equity return, which we estimated using Fama and French three-factor model. In the second stage, we estimated the models using a panel data technique. Table 5 exhibits regression results of a set of models that we estimated with different specifications.
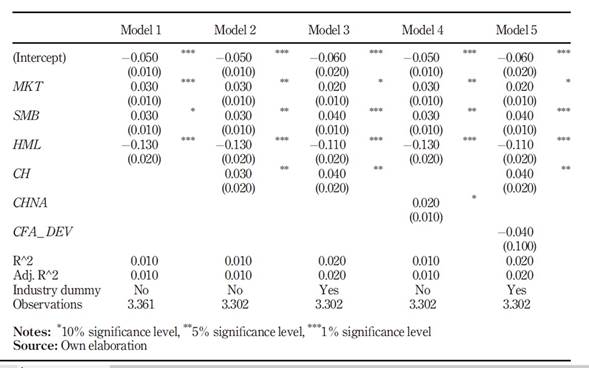
Our findings show that the MKT, SMB and HML factors are statistically significant and the Fama-French three-factor model is robust to explain the expected equity return for the sample that we used in this research. The coefficient on the MKT factor was positive and significant at a 1% level (MKT = 0.030). The coefficient on the SMB factor was positive and significant at a 10% level (SMB = 0.030). The coefficient on the HML factor was negative and significant at a 1% level (HML = −0.130). These results are in line with previous studies that indicate that Fama and French three-factor model has a better performance to explain the expected return than the CAPM model for emerging countries (Belimam et al., 2018; Al-Mwalla and Karasneh, 2011).
In Model 2, we formally tested the impact that cash holdings (CH) impose on expected equity return. The results confirmed that there is a positive relationship between cash holdings and expected equity return. The coefficient on cash holdings (CH = 0.030) was positive and significant at a 5% level. This means that a 1% increase in the cash holdings of the firm is associated, on average, with an increase of 3% in its expected equity return. In consequence, these empirical results supported H1a and corroborated the positive relationship that we established from finance theory. In addition, the significance of the coefficients on the three-factor model did not disappear when we introduced the cash holdings (CH) variable in the model.
Meanwhile, we included in Model 3 an industry dummy variable to control for the economic sector effect. The industry is an essential determinant of corporate liquidity, some industries tend to have higher cash holdings than others due to the higher risks they face or the financial constraints (Wang, 2012). After we control for the industry effect, the coefficient on cash holding (CH) presented still a positive and significant relationship with expected equity return. The coefficient estimated was significant at the 5% level (CH = 0.04), and the three factors did not lose their signs and explanatory power when it was controlled by the industry effects. This result indicates that the positive relationship between cash holdings and the expected return was not explained for a specific economic sector. On the contrary, the positive relationship persisted regardless across different industries even after we controlled for different variables.
To ensure the validity of the results and as a robustness check, we estimated Model 4 using an alternative measure to cash holdings. In this case, we estimated the model using the ratio of Cash to Net Assets (CHNA), where net assets are equivalent to total assets minus cash (Dittmar et al., 2003; Faleye, 2004). The coefficient on cash holding to net assets (CHNA) also was positive and significant at a 10% level (CHNA = 0.02). Both regressions provided consistent and similar results and confirm the explanatory power of cash holdings for different measures, in line with the results obtained for Simutin (2010) and Wang (2012), who concluded that the results obtained when the relationship between cash holdings and expected equity return was analysed, were robust even using different measures of cash holdings. In Model 5, we estimated the same version of Model 3 but controlling for Cash Flow volatility (CFA_DEV). In significant statistical terms, regression results were similar to previous models but the coefficient on CFA_DEV was not significant. Therefore, this evidence suggests that the cash flow volatility did not play a significant role to explain the positive relationship between cash holdings and expected equity return for firms in emerging countries.
In a second stage, in addition to the multivariate regression estimation, we examined the model’s explanatory capacity using the fixed effect-panel data technique. The main advantage of panel data techniques is that it allows the researcher to analyse the information in a more dynamic way that is in a temporal dimension and in a structural dimension, which makes it appropriate for answering the inquiry question (Chireka and Fakoya, 2017; Lozano and Caltabiano, 2015). On the other hand, the fixed-effects model considers that there is a different constant term for each firm and assumes that the individual effects are independent of each other, which allows to control for unobservable heterogeneity and to eliminate possible biases in the results (Lozano and Caltabiano, 2015).
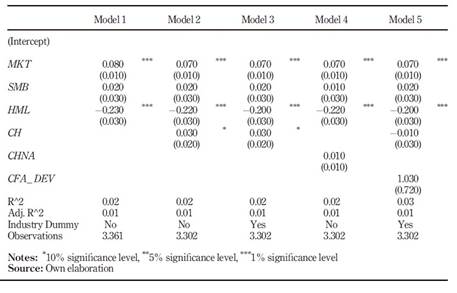
To examine the relationship across firms with higher market capitalization, we divided the sample into two groups according to its market capitalization (MKCAP) using the fixed-effect technique. Table 6 displays results for different specifications of models using fixed effects to their estimation. As can be seen in Table 6, the coefficient that we estimated for the five models, showed similar results when we did the estimation using ordinary least square. In the same way, the results were similar when we only tested the relationship between cash holdings (CH) and expected equity return (re) across the largest firms. In fixed-effect panel data regression, the coefficient on cash holdings in Model 2 maintained its value (CH = 0.03) but was less statistically significant (at 10% level). In Model 3, after we controlled for sector economic effect, the coefficient on cash holdings also was less strong (CH = 0.03 and significance at 10% level). This result shows that the relationship between cash holding and expected equity return was less strong across larger firms (higher BEME). In Models 4 and 5, CHNA and CFA_DEV variables were not significant when we estimated by fixed effects.
Table 6 Regression results of cash holdings and expected equity return in large firms. Fixed effects estimation
4.2.1 Further analysis.
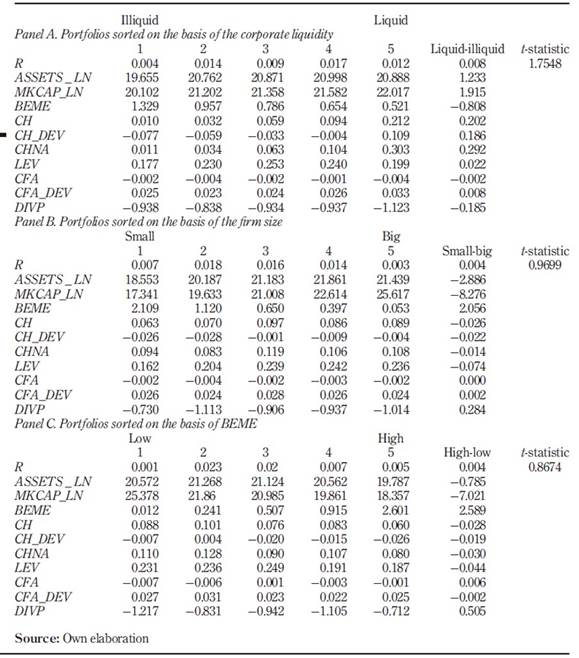
Going deeper into the impact that cash holdings have on the expected equity return, we analysed the characteristics of the firm. To this end, we divided the sample into quintiles and organized it according to their cash holdings position, size and BEME ratio. Panel A of Table 7 provides the firm’s characteristics of the sample when we sorted them from the least liquid to the most liquid. As can be seen, in general, the expected equity returns increase when firms have a higher level of cash holdings. On average, the expected equity returns for the most liquids firms were 0.012% while for those located in the lowest percentile that is those with the lowest cash holding, this average was situated in 0.004%, which represents a significant difference in financial terms. Also, these results provided additional empirical evidence to support H1a; therefore, firms with higher cash holdings tend to have higher expected equity returns and higher volatility in their cash flows. This positive association between cash holdings and cash flow volatility provides support to the fact that firms hold on to cash for precautionary motive, then firms that have higher cash holdings, have higher volatility cash flows (means higher risks) and higher expected equity return.
Panel B of Table 7 shows the characteristics of the firms when we sorted them by their size. According to these results, on average, expected equity return decreases as firms are larger. Likewise, cash holdings were higher in bigger firms than in smaller ones. These results suggest that larger firms need more cash to finance their future growth opportunity. Panel C of Table 7 exhibits firms’ characteristics when they were sorted by their book market ratio (BEME). Cash holdings (CH) and cash holding to net assets (CHNA) were smaller when firms had a higher BEME ratio. In consequence, firms with higher growth options (higher BEME) tend to hold fewer liquid assets and higher returns.
4.3 Cash holdings and systematic risk
To establish if cash holdings represent a source of risk and can contribute to explaining firm beta, we estimated the individual beta of the firm as a proxy for systematic risk (β). To obtain this result, we regress individual beta against cash holdings (CH) controlling for firm size and BEME. Table 8 shows the results of the regressions that we carried out. In all models, the dependent variable was the systematic risk (β).
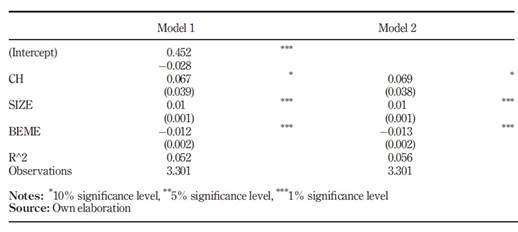
Using multivariate regression technique, we estimated Model 1. The coefficient on cash holdings was positive and significant at a 10% level (CH = 0.067). The results suggest that cash holdings (CH) was positively associated with the beta (β) of the firm and this relationship persisted after controlling for different variables as Size and BEME. Our results are in line with prior literature (Wang, 2012; Simutin, 2010). In consequence, empirical evidence supports H1b, which establishes that cash holdings could be a sign of higher risks and contain additional information to explain the systematic risk (β). We estimated Model 2 using the fixed-effects technique. The obtained results were similar to Model 1, the sign and statistical significance of CH were still controlled for other variables (CH = 0.69 at 10% level). So, we provide evidence that cash holdings can be considered as a priced risk factor.
4.4 Cash holdings and idiosyncratic risk
Traditional models of asset valuation such as CAPM and Fama and French (1993) consider only systematic risk, as idiosyncratic risk can be eliminated through diversification (Sharpe, 1964). However, recent studies have found that there is a relationship between idiosyncratic risk and expected return (Tavakoli and Mallik, 2018; Qadan et al., 2019; Kinnunen and Martikainen, 2017; Chen and Petkova, 2012; Wan and Xiao, 2014). On the other hand, the relationship between cash holdings and idiosyncratic risk has not been widely studied. Except the work done by Acharya et al. (2014), Bigelli and Sánchez-Vidal (2012) and Bates et al. (2009), in the review of the literature made studies that examine this relationship in emerging economies context were not found.
In this sense, to test H1c, we used the market model. First, we carried out a regression on monthly stock returns against the market index using linear regression (traditional CAPM model). Then, we calculated the idiosyncratic risk variable (IRISK) as the root mean squared error of the regression (Cheung, 2016). Once we had estimated the idiosyncratic risk variable, we built a model similar to the model used by Cruz (2015) to examine the relationship between cash holdings and idiosyncratic risk (IRISK). In this model (equation (2)), our dependent variable was cash holdings (CH) and the main independent variable was the idiosyncratic risk (IRISK). We estimated the following model:

where CH is the cash holdings (variable dependent) and IRISK is the idiosyncratic risk variable. Zi,t is a control variables vector, which includes size measured both as the logarithm of market capitalization (MKCAP) as the logarithm of total assets (ASSETS_ LN), Tobin’s Q, cash flow to the asset (CFA), cash flow volatility (CFA_DEV), leverage (LEV), dividend payout ratio (DIVP). Also, we introduced the lag of the cash holdings (LAG_CH) to control for endogeneity and persistence of the dependent variable (Cruz, 2015). We estimated all models using fixed effects. Table 9 contains the regression results for the different specifications model.
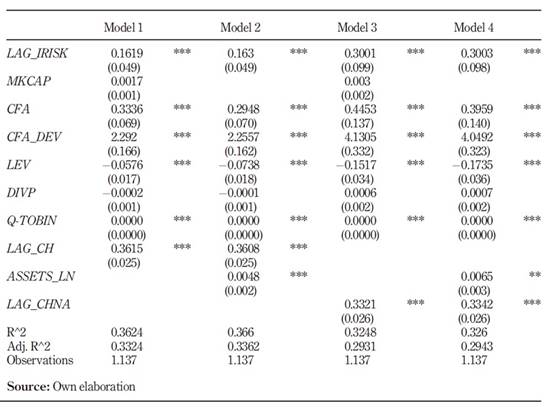
We estimated Models 1 and 2 similarly. The only difference was presented with the variable size. In Model 1, we first calculated this variable as the log of market capitalization (MKCAP) and, in Model 2, we calculated this variable as the log of assets (ASSETS_LN). In Model 1, the coefficient on IRISK was positive, statistically and economically significant at a 1% level (IRISK = 0.1619). The second column in Table 9, displays the estimations of Model 2. In this case, we estimated the model using a different measure for size and we calculated this variable as the log of assets (ASSETS_LN). Also, the coefficient on IRISK was positive, statistically and economically significant at a 1% level (IRISK = 0.163).
We estimated Models 3 and 4 with different definitions for cash holdings. In both cases, we used CHNA as the dependent variable and we did not change the other control variables. Again, we estimated Model 3 using the log of market capitalization (MKCAP) for the variable size. The results showed that the coefficient on idiosyncratic risk was positive and statistically significant, indeed, the economic significance is higher when are compared with estimations of Models 1 and 2 (IRISK = 0.3001 at 1% significance level). For all models, growth opportunities measured by Tobin’s Q did not have an economically significant impact on the level of cash holdings. By last, we also estimated Model 4 using CHNA as a dependent variable but considering the log of assets (ASSETS_LN) for the variable size. The power explanatory of idiosyncratic risk persisted, and the coefficient was statistically and economically significant at the 1% level (IRISK = 0.3003). For different specification models, the results supported H1c. These results are in line with the underlying theory (Acharya et al., 2014).
5. Conclusions
This paper explores the relationship between cash holdings and expected equity return. Our results of multiple regression analyses show that there is a positive and statistically significant relationship between cash holdings and the expected return. Our findings suggest that firms with higher cash holdings tend to have higher equity expected returns and higher volatility in their cash flows. This positive association between cash holdings and cash flow volatility provides support to the fact that firms hold on to cash for precautionary motive, then firms that have higher cash holdings, have higher volatility cash flows (means higher risks) and higher expected equity return. A reasonable explanation for this relation is that corporate cash holdings are a sign of potential risks; therefore, investors expect a higher return. Also, through a subsample analysis, we observe that this relationship persists even after controlling for different characteristics of the firm; so, it is possible to conclude that cash holdings have a positive impact on expected return independent of the economic sector to which the firm belongs.
On the other hand, when we sorted firms by size, we conclude that the expected equity return decreased as firms were larger. Likewise, cash holdings were higher in bigger firms than in smaller ones. That means that larger firms need more cash to finance their future growth opportunity and to realize their investment projects. Overall, this empirical evidence suggests that cash holdings may contain additional risk information to explain the expected equity return, which is not being captured by the Fama and French three-factor model. Hence, our results support the hypotheses that suggest that cash holdings represent a source of risk and serve as an essential predictor factor for expected equity return. Concerning the relationship between cash holdings and systematic risk, our results based on four emerging markets provide strong empirical evidence in favour of this positive relationship. These results also were consistent with the findings of developed countries and supported H1b.
In conclusion, the results of our study allow it to conclude that for the sample of emerging countries used, the relationship between cash holdings and expected return is the same for developed countries. Moreover, the sense of this relationship persists despite the characteristics of emerging markets, indicating that this positive relationship is not typical of developed markets but, in effect, corresponds to a direct relationship between cash holdings and expected equity return. In this way, the results of our research contribute to the academic debate on the understanding of capital asset pricing models in emerging markets.
In terms of the idiosyncratic risk effect, our empirical evidence corroborated that there is a positive and strong relationship between cash holdings and the firm’s idiosyncratic risk (H1c). According to this result, we can infer that idiosyncratic risk imposes an effect on cash holdings and idiosyncratic risk contributes to explain cash holdings because when firms are exposed to higher risks, they tend to hold more cash. In this order of ideas, we concluded that this higher risk is not only explained by the systematic risk but also by the non-systematic or idiosyncratic risk. According to this finding, we can conclude that ignoring the relationship between cash holdings and idiosyncratic risk could result in the wrong idea that idiosyncratic risk does not affect the expected return and the risk assessment in the asset pricing model.
Future research should examine the relationship proposed in this study for different emerging countries such as emerging Asian economies or Middle-East and North African countries. Another important issue to research could be to examine this relationship for start-up firms, these firms are younger and have faster growth; therefore, this condition makes it difficult to estimate the expected equity return for investors in this kind of company. Also, it may be interesting to examine this relationship for firms financed by venture capital, which implies a different measuring for variables used in this study, mainly, for the leverage variable.

