


 Inglês (pdf)
 Artigo em XML
 Referências do artigo
 Enviar este artigo por email
 Citado por SciELO
  Similares em
SciELO
Similares em
SciELO 
 Permalink
1. Introduction
The interest in the study and support of intellectual capital has increased, from its definition (Edvinson and Malone, 1997), the proposal of models with financing approach (Brooking, 1996), with corporative strategic approach (Atkinson et al., 1997; Bontis, 1998; Bueno, 2002) and even the consensus of its main components: human capital, structural capital and relational capital (Bontis, 1998; Edvinsson and Sullivan, 1996; Edvinson and Malone, 1997; Stewart, 1997; Sveiby, 1997; Roos et al., 1998; Bueno-CIC, 2003; Mondal and Ghosh, 2012; Joshi et al., 2013), as well as the interrelation among its elements (Chen et al., 2004; Nazari and Herremans, 2007; Iazzolino and Laise, 2013).
The study of intellectual capital has considered the measurement of the impact on the financial performance of companies (Yalama and Coskun, 2007; Pew Tan et al., 2007; Chu et al., 2011), on the return on investments (Makki and Lodhi, 2009), as well as the performance of companies (Jin and Wu, 2008; Clarke et al., 2011; Maditinos et al., 2011; Mehri et al., 2013). Only some authors have developed studies to determine the relationship, impact and/or effects on the added value of the company. Specifically, Gan and Saleh (2008), tried to explain if efficiency in value creation can be explained by market valuation, profitability and productivity in technology-intensive companies, finding that VAICTM components have different impacts on performance compared to the aggregate indicator. A special case is a study by Britto et al. (2014) on real estate companies, who analysed whether the value created by real estate companies can be better evaluated using elements of intellectual capital or traditional performance measures, finding that CI has a significant inverse relationship with the market value of companies. Despite the great evidence of studies on performance and scarce studies on the value-added of companies, there are no records of studies on family businesses (FB), where the impact and/or effects of intellectual capital on the performance of EF, an important issue that this research proposes to analyse.
For some authors, the IC, and the relationship with the groups of interest have an important role in the creation of value (Powell, 2003; Chen et al., 2005) and in a special way in family businesses (Kammerlander et al., 2015), becoming a source of competitive advantages and, therefore, ensures better performance of companies (Razafindrambinina and Kariodimedjo, 2010; Wang, 2012).
In Chile, family businesses represent 90% of all participating companies in the national economy (Torres et al., 2017), with an approximate contribution of 50% to GDP and 63% of employment (Vesna et al., 2015).
Despite the abundant literature on studies about family businesses (FB), that mainly discuss the heterogeneity of FB (Barbera and Moores, 2013) and the differences with non-family business (NFB) (Dawson and Mussolino, 2014; Deephouse, and Jaskiewicz, 2013), covering specific areas such as socio-emotional wealth (Berrone et al., 2012; Chua et al., 2015), psychological and social (Jiang et al., 2018), generational succession (Fang et al., 2018), governance (Nordqvist et al., 2014; Le Breton-Miller and Miller, 2018) and financial factors (Kotlar et al., 2018). These are the most studied areas, and few explore the role of intellectual capital in this type of businesses (Grimaldi et al., 2016) and even less focus on its measure and impact on the performance of FB.
Given that intellectual capital has become the strategic factor under the paradigm of competitiveness and has been considered as one of the flexible factors in production, which is relevant when measuring its contribution and efficiency against business production and competitiveness (Dzinkowski, 2000; Marr et al., 2003; Chu et al., 2011). The purpose of this study is to analyse the impact that intellectual capital has on financial performance and the added value of production, through calculations of the VAICTM index, in family businesses in the industrial manufacturing sector of Chile. The foregoing is per the proposal by Andreeva and Garanina (2016), who consider more empirical research in emerging markets important and necessary, given that the empirical evidence on the role of the IC in financial performance and organizational competitiveness is still extremely limited. Using a linear econometric model, the impact of the efficiency coefficient of intellectual capital on ROA financial performance and value-added in family businesses will be analysed. The results of this research allow us to reduce the gap in the literature on intellectual capital management and studies on family businesses, providing evidence of the impact of this asset on the financial performance and on the added value of family and non-family businesses in Chile.
This study is organized as followed: first, it presents a theoretical framework based on an intentional review of literature about intellectual capital and its measurements in businesses. Then, the methodology is described, showing the data, the variables defined and the models; and, in the following sections, the results and discussion are presented to finally end with the main conclusions.
2. Theoretical framework
2.1 Coefficient of value-added of intellectual capital
Undoubtedly, the development of competitive advantages is based, among other factors, on the resources of intangible nature (Bontis, 1996; Bueno, 2002), so the generation of wealth and better business performance would be related to the possession and management of these types of resources (Polo and Rodríguez, 2014). In the past few years, the set of tools to measure business performance has increased and all of them have the same goal: the creation of value, so the ultimate goal of business performance analysis and evaluation is the determination of the added value of the companies.
The studies related to the concept of intellectual capital have shown heterogeneity, which can be seen in the studies carried out by Bueno et al. (2008), Monagas-Docasal (2012) and Volkov (2012). Nevertheless, a consensual element of this concept, is that it contributes to improving the performance of businesses (Bueno, 2002) and to the generation of value (Brooking, 1996; Bontis, 1996; Firer and Williams, 2003; Pew Tan et al., 2007; Chu et al., 2011). For Bueno et al. (2008), intellectual capital is an indicator of the organization’s wealth derived from the knowledge managed. This will allow the creation of new knowledge and thus the accumulation of greater wealth, creating value to the organization through this intangible asset.
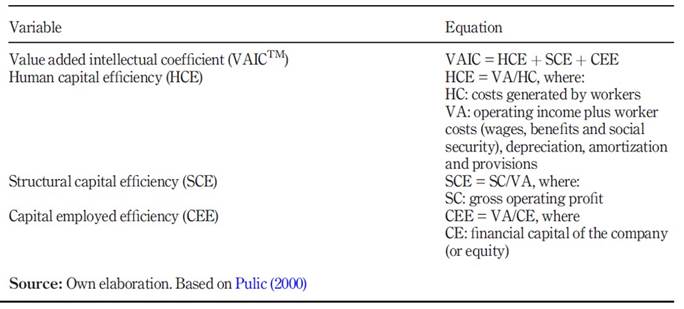
Pulic (1998, 2004) developed a model that allows measuring intellectual capital of a business (VAICTM) based on the efficiency of three components:
Human capital efficiency (HCE), which represents the costs generated by the business employees;
Capital employed efficiency (CEE), which is understood as the financial capital, as to say, the accounting patrimony; and
Structural capital efficiency (SCE), which is understood as the difference between the added value (VA) and the human capital (CH).
Table 1 shows the equations that allow measuring this VAICTM index.
The VAICTM model has been used by several authors (Dzinkowski, 2000; Marr et al., 2003; Chen et al., 2005; Ghosh and Mondal, 2009; Chu et al., 2011; Joshi et al., 2013; Mehri et al., 2013; Dženopoljac et al., 2016) in determining the impact or/and effects on the performance of companies or businesses, whose motives can be summarized in the following:
The model VAICTM is based on the determination of a low number of variables and simple calculations.
Despite criticism, the VAICTM model delivers consistent information on intellectual capital in organizations.
The information used to determine the VAICTM coefficient is reliable because it is data present in the financial documents submitted to audits.
On the other hand, several authors have carried out research under the methodology of systematic review and bibliometrics (Volkov, 2012; Iazzolino and Laise, 2013), showing limited contribution on the study of intellectual capital about the performance of family businesses (Lunardi et al., 2017).
2.2 Intellectual capital and financial performance
According to García (2009, 2003), performance is defined as a measure of productivity, where the resources committed to a business guarantee its permanence and growth, thus, generating value for investors. Growing these resources, which allows increasing the assets of investors, is the purpose of any company (Ittner and Larcker, 2003). Therefore, the measurement of the company's performance becomes relevant, with several indicators for this.
A group of indicators used in most studies (Molina-Parra et al., 2017), correspond to those of effectiveness or productivity, such as, return on assets (ROA) and Return on Equity (ROE) (Rivera and Ruiz, 2011). These indicators measure the ability to generate profits, considering three important factors: the number of assets, their nature (operational or total) and the right to own the resource (equity) (Rivera and Ruiz, 2011; Stern et al., 1995).
However, the intangible nature of some resources or assets makes it difficult to measure the performance of the company using these resources, with intellectual capital being one of them. Given that this asset is not reflected in the financial reports of the businesses (Brooking, 1996; Edvinson and Malone, 1997; Sveiby, 1997; Bueno, 2002), its measurement is essential to analyse its effect on the performance of the businesses (Puntillo, 2009). In this sense, the models developed to measure the intangibles are focused on the economic performance of the business (Sveiby, 2007), showing a shortage of studies that analyse the effect or the impact of the intellectual capital in the business financial performance (Stern et al., 1995; Stewart, 1997; Pulic, 1998; Lev, 1999; Firer and Williams, 2003; Pew Tan et al., 2007; Chu et al., 2011).
Sufficient evidence exists on the use of the VAICTM model in financial and banking sectors, measuring the intellectual capital impact over the performance of the businesses (Wei Kiong Ting and Hooi Lean, 2009; Mondal and Ghosh, 2012; Joshi et al., 2013; Al-Musali and Ismail, 2014) and its use is limited in other sectors, except the studies carried out by Zeghal and Maaloul (2010) applied to the high technology sector in Great Britain and the one carried out by Guo et al. (2012) applied to the biotechnology sector, both studies investigated the impact of intellectual capital in the financial performance of the businesses. González et al. (2017) also used this model about financial profit, applying it to businesses that quote and belong to the Mexican Industrial Sector, being the human capital the main source of intellectual capital and value creator, resulting in similarity to other studies applied in the financial sector (Goh, 2005; Mondal and Ghosh, 2012).
Most of the studies that analyse the relation between VAICTM components and the financial performance of businesses, use the return on assets (ROA) as a variable of study (Gan and Saleh, 2008; Chu et al., 2011; Mondal and Ghosh, 2012; Joshi et al., 2013; González et al., 2017), stating that there is a positive relationship between financial performance indicators and VAICTM, while other researches (Chan, 2009; Ghosh and Mondal, 2009), do not show conclusive results about such positive relationship. According to Sveiby (2010), the use of ROA indicator is useful for comparative financial analysis among businesses from the same sector, allowing to perceive the financial value of the intangible assets in a scenario of established accounting and financial standards.
Therefore, the following hypotheses are proposed concerning intellectual capital and financial performance in FB.
H1. In the manufacturing industrial sector, the greater the value-added factor of intellectual capital level (VAICTM), the greater the return on assets (ROA) of the businesses.
H2. In the manufacturing industrial sector, the relationship between the return on assets (ROA) and the value-added factor of intellectual capital (VAICTM), is positive and greater among family businesses than in non-family businesses.
2.3 Intellectual capital and value-added
For the Ministry of Economy, Development, and Tourism of Chile, the added value of production is the value of production of companies discounted the value of the products used in their production. Thus, the added value of the production of the companies can be expressed as follows:

The previous expression considers the final value of the production, decomposing in the value added by the companies to the final production and the value coming from the intermediate goods that are also used in this production (Fuentes and García, 2014), avoiding a double accounting in the final value. In this way, it is possible to adapt equation (1), as follows:

where:
Total revenues correspond to the income from the main activity of the company, other operating income, plus the variation of stocks or inventories between year t and t − 1.
Variation inventories corresponds to the stocks of both finished and in-process products, as well as the existence of raw materials, so it would not be correct to use the total production as a variation. However, because there is no availability of other variables that allow such correction, it is also possible to use it in the production calculation (Chumacero and Fuentes, 2002).
For Liang and Yao (2005), net income is the most significant explanatory capacity in the value contributed by the company to the market. On the other hand, intermediate consumption corresponds to the products consumed in the production process without considering taxes, represented by equation (3).
Intermediate Consumption = Total expenses - Dependent workers compensation (3)
where:
Total expenses correspond to sales and/or production costs, energy expenses, communication and ICT service expenses, general expenses, administration and finance expenses.
Following Mosavi et al. (2012), there are two methods to determine the value of a company: First, based on the financial statements of the company, and second, based on its market value, through the stock market. Both values will be different, resulting in a larger amount market value (Chen et al., 2005; Edvinson and Malone, 1997). Among the reasons for such difference between the two values, is the effect of the intellectual capital used by the company and as mentioned, is not present in the financial statements (Brooking, 1996; Edvinson and Malone, 1997; Sveiby, 1997; Good, 2002).
To the extent that companies efficiently manage their intellectual capital, a greater potential for success through the link with the development of competitive advantages and value-added will generate the company to the market (Cañibano et al., 1999), regardless of its typology and nature, for example, family or non-family business.
There are abundant theoretical arguments and empirical background for the competitive advantages and disadvantages of companies, especially family businesses; however, there is still a comprehensive perspective focused on adding value based on intangible factors (Kammerlander et al., 2015). For some authors (Salehi et al., 2014), there is a significant relationship between added value and efficiency of intellectual capital, thereby demonstrating a growth in the performance of companies (Lunardi et al., 2017; Makki and Lodhi, 2008). Therefore, the higher the coefficient of intellectual capital or VAICTM, the more value-added the company will obtain (Mosavi et al., 2012).
Therefore, the following hypotheses are proposed concerning intellectual capital and added value in the FB:
H3. In the manufacturing industrial sector, the relationship between the value-added factor of intellectual capital (VAICTM) and the value added of production (VAEmp), is positive and greater among family businesses than in non-family businesses.
3. Data and methodology
In Chile, 48.3% of the businesses in the country are family ones and under this framework, 48.6% correspond to SMEs, while 39.8% correspond to big companies; they generate 60% of the jobs and contribute to 64.7% of the GDP (gross domestic product) (Ministerio de Economía de Chile, 2017). The national manufacturing industrial sector represents an essential pillar in the country’s growth, not only for the use of resources such as raw materials, energy and capital but also for generating jobs improving productivity and developing productive linkage. Based on data from the World Bank (2016), the Chilean industrial sector has contributed, on average, with 34.8% of the GDP in the periods of 2010-2016, concentrating 52% of the family businesses in the country. Therefore, it is important to study and analyse the added value of the FB in the industrial sector of Chile, as a result of the management of its intellectual capital, which has become an important focus in the generation of competitive advantages.
3.1 Database
The database corresponds to the fourth longitudinal survey of businesses 2016 of Chile (ELE-4), with records for the periods of 2014-2015 that represent national statistics based on the activity and size of the businesses (Ministerio de Economía de Chile, 2017). The form design and the methodology used to follow the general guidelines suggested by OECD and Eurostat Community Innovation Survey (CIS), which are embodied in OSLO Manual (OECD/European Communities, 2005). Database corresponds to 8.084 businesses of 13 economic sectors with sales levels above US$31,594.12 (exchange rate for 31 December 2016).
Therefore, the sample contains 1.198 businesses from the industrial manufacturing sector (Production of food and drinks, Furniture Manufacture, Paper Manufacture, Machinery and Equipment Manufacture and other industrial goods). The presence of an outlier requires prior data processing using the criteria of extreme points from the left side x < Q1 − 3(Q3 − Q1), and from the right-side x > Q3 + 3(Q3 − Q1). The clean sample finally corresponds to 1.109 businesses.
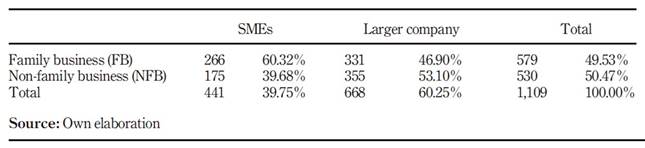
The family businesses (FB) correspond to 49.53% of the business of the samples. The criteria used to decide if a business is a family business or not, are (San Martín-Reyna and Durán-Encalada, 2012):
in the business ownership the participants are mainly (more than 50%) a family or a family group; and
at least one member of the family that owns the business is present in the management of it.
The remaining 50% corresponds to non-family businesses. Table 2 shows the descriptive summary of the sample.
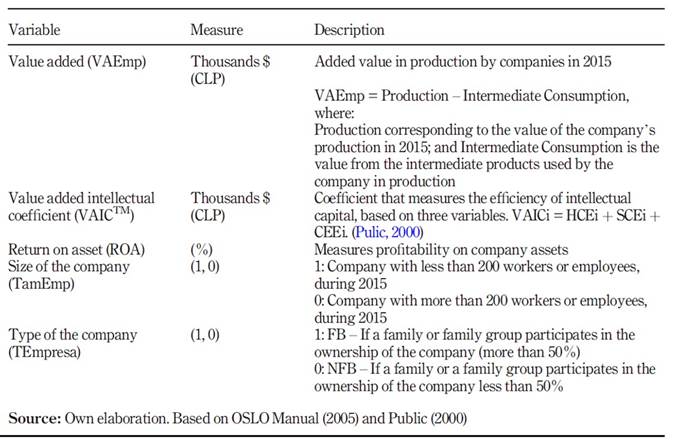
3.2 Variables
The selection of the variables used and indicated in Table 3 are established from OSLO Manual (OECD/European Communities, 2005). The size of the business is used as a control variable, nevertheless, literature is not precise about its use, given that, in an innovation context, SME’s suffer from high competition and lack of resources (financial and professional), which results in difficulties for the efficient performance of such process, differently from big businesses (Ko et al., 2008).
The analysis is conducted under the application of the multiple linear regression and the analysis of the statistics of pearson correlation, variance inflation factor (VIF), t test, F test (Pérez, 2004; Hair et al., 2010).
3.3 Models
To provide answers to the questions using the analysis of the parameters of the explicative variables, the regression models are presented in Table 4 with their respective operationalization of the variables.
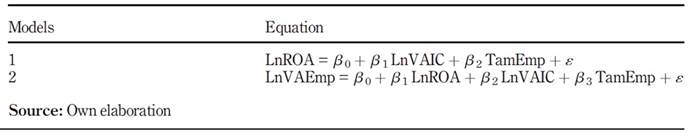
In the calculation of the VAICTM indicator, it will be used the methodology proposed by Pulic (2014) and the one applied by Kujansivu and Lönnqvist (2007) and Laing et al. (2010).
4. Results
It is presented in a comparative way, the calculation of the statisticians that allow interfering in the fulfilment of the conditions to determine the different impacts about the performance and added value of the production of the studied businesses. Table 5 corresponds to the correlation matrix (EF and EnF), and it shows that the values indicate an acceptable basis of discriminant validity (Cohen et al., 2014; Kemp, 2003). In this sense, the presence of high significance in all the coefficients of correlation is important. The background about the goodness of fit and statistical independence of regression models that will allow understanding H1, H2, y H3 is presented in Table 6.
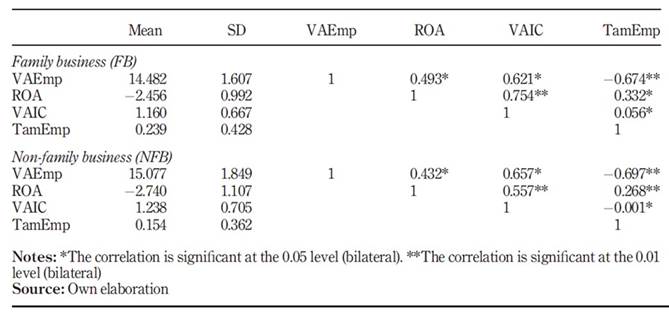
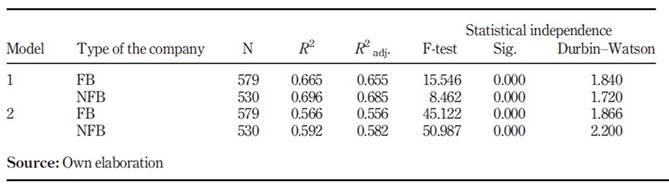
Table 7 shows the results of each model, the relation of β coefficients and co-linearity diagnosis, according to the type of businesses (FB and NFB).
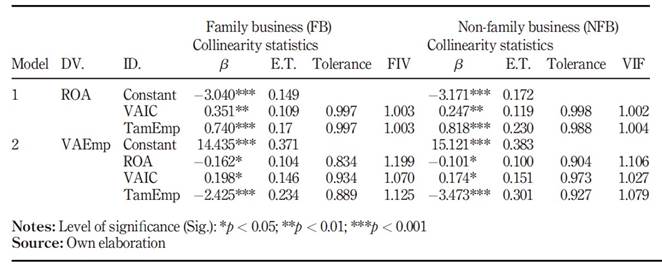
Table 8 shows the results of the homoscedasticity test and the main indicators of the ANOVA matrix, according to variables of classification: type of businesses (FB versus NFB), and the size of the business (TamEmp).
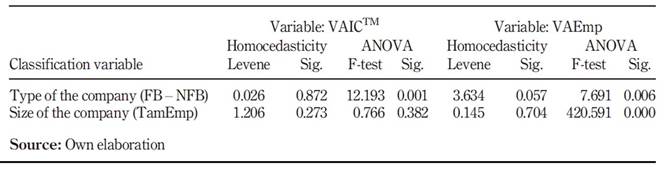
Levene's test allows contrasting the hypothesis of equality of population variance. In this case, the level of significance (Sig.) is greater than 0.05, so the hypothesis of equality of the variance is accepted, concluding that there is homoscedasticity in the variables studied (VAICTM y VAEmp).
In respect to the analysis of variance, F statistic in Table 8 allows analysing intragroup significance. In this case, it is observed an F indicator less than 0.05, rejecting the hypothesis of equality of means. The exception is produced in the result for the coefficient of the value added of the intellectual capital (VAICTM), where depending on the size of the businesses, is accepted the hypothesis of equality of means; therefore, there are no significant differences between the businesses in relation to such variable (VAICTM).
5. Discussion
To validate the models proposed, following Pérez (2004) criteria and Hair et al. (2010), the goodness of fit and the statistic significance, the independence of the residues and the collinearity diagnosis were analysed. In Table 6, it can be seen that both models present acceptable goodness of fit (R2 and R2adj), consistent with other studies (González et al., 2017; González, 2017; Amin and Aslam, 2017), in addition, DW values in both models are between 1.720 and 2.200 (Table 6); therefore, it can be assured the existence of independence in the explicative variables, validating such assumption. In respect to the existence of any exact relationship among the independent variables, a collinearity diagnosis was carried out using statistical tolerance and VIF. In this sense, it is observed in Table 7 that the values of tolerance are high (>0.904), which complemented with the values obtained for VIF (<1.106) allows to assure that the variance of the variable is less, and therefore, it makes it possible to ensure that there is no collinearity.
Each model presents a statistic significance (Table 6) according to F test (Sig. = 0.000) following Perez criteria (2004) and Hair et al. (2010). According to the results presented in Table 5, there is a homoscedastic behavior of the variance in the group of businesses studied, as for example the case of the variable value added of production, according to the type of business, that is slightly higher than 0.05.
In response to each hypothesis, the results for Model 1 (Table 7) show a positive and statistically important impact on financial performance (EF: β1= 0.351; p< 0.01/EnF: β1= 0.247; p< 0.01), complemented with the correlation coefficients (Table 5), they allow to empirically demonstrate that the predictors fulfil H1 (H1). These results are consistent with the ones obtained by other authors (González et al., 2017; Amin and Aslam, 2017; Chu et al., 2011) when pointing that VAICTM is an important predictor and has a positive impact on the financial performance of businesses. In addition, it can be observed in family businesses a β1 predictor (β1 = 0.351) that is greater than the one in non-family businesses (β1= 0.247) at the same level of significance, which makes H2 (H2) empirically accepted. These results align with the findings from other authors (Lunardi et al., 2017), where family businesses present better financial results (ROA - ROI) than non-family businesses based on internal and intangible factors, being FB the most financially conservative ones when facing periods of crisis.
When observing Model 2 (in Table 7) it is evident that VAICTM impact over the value added of production (VAEmp) is positive (β2= 0.198; p< 0.05; β2= 0.174; p< 0.05) and indifferent when it comes to the type of businesses (FB and NFB). From the above, it can be seen that the VAICTM contribution to the explanation of VAEmp is greater in the family business than in non-family businesses, as to say SME’s, although such difference in the impact on the dependent variable is marginal. Considering the group of FBs, family business of great size (big businesses, with more than 200 employees), VAICTM contribution to the value-added of productions is greater than the SME’s counterpart, possibly explained because of its greater disposition and quality of resources and greater efficiency in its processes. These results are consistent with the ones found by other authors (Lunardi et al., 2017; Makki and Lodhi, 2008; Firer and Stainbank, 2003). The authors decided to accept H3.
With the previous results, it is possible to empirically point that, there are significant differences in the value-added of family businesses of the manufacturing industrial sector, over the non-family businesses. The above is supported by the values presented in Table 8 (ANOVA, F test). The results obtained for the value added of production is significantly greater in the family businesses than in the non-family businesses. As for the value added of the intellectual capital (VAICTM), there are also important statistical differences (analysis of means), between FB and NFB. The previous allows supporting the results found for both groups of businesses, in terms of financial performance and value-added.
6. Conclusions
In this work, it has been studied how the intellectual capital, measured with the coefficient of the value-added of the intellectual capital (VAICTM) has an impact on the financial performance and the valued-added of the production of the businesses that belong to the manufacturing industrial sector of an emerging economy. From the analysis of 1,109 businesses using the fourth longitudinal survey of businesses 2016 of Chile (ELE-4), the empirical results establish that the efficiency of the intellectual capital affects positively the financial performance, showing a greater impact on family businesses than on non-family businesses, especially when it comes to SMEs.
The study shows significantly that the VAICTM coefficient produces a greater impact on the value-added of the production in family businesses, and such differences, with respect to the non-family business are important.
With the results obtained, it is possible to conclude that the coefficient of the value added of the intellectual capital (VAICTM) is an important predictor of the financial performance and the valued-added of the businesses, so its management will allow to strengthen the competitive advantages, improve the organizational efficiency and increase the development and growth of the business.
Finally, this work has implications for entrepreneurs, business managers and capital management managers by showing that there are internal and intangible factors that affect the businesses results (financial and production); therefore, it is advisable to pay special attention to them when establishing business strategies, especially the ones based on innovation processes.

