Introduction
Small- and medium-sized enterprises (SMEs) play a vital role in providing employment and sustaining economic growth in the New Zealand economy. SMEs comprise 97% of all native enterprises employing 30% of the working population and producing 27% of the country’s gross domestic product. SMEs dominate all industry groups and increasingly are engaged in innovative activities and business trade/exporting (Small Business Sector Report, 2014).
New Zealand has more ethnic nationalities than the world has countries, which speaks to the country’s widespread diversity (Minson, 2013). There are four major ethnic groups in New Zealand: European, Māori, Pacific and Asian. All four groups are largely concentrated on the North Island. The combined regions of Northland, Auckland, Waikato and Bay of Plenty comprise more than half (51%) of New Zealand’s total population. The population is likely to increase to 5.13-5.51 million in 2025 (Statistics New Zealand, 2020). Hamilton is expected to be one of the most diverse cities by 2038, with 28% Maori, 23% Asian and 10% Pacific population. Apart from the higher number of Maori, these statistics parallel Auckland’s ethnic makeup in 2013 (Statistics New Zealand, 2020). New Zealand’s Asian population has almost doubled in size since 2001. Asians as an ethnic group represented 6.6% of the entire population in the 2001 census, grew to 9.2% in the 2006 census and 11.8% in the 2013 census. Pacific ethnic groups increased from 6.9% of the entire population in 2006 to 7.4% in 2013, whereas European ethnicities increased from 67.6% in 2006 to 74% of the population in 2013 (Statistics New Zealand, 2013).
The projections for 2013-2038 indicate that the Māori, Asian and Pacific populations will continue to grow faster than New Zealand’s population overall, both in sheer numbers and as a proportion of the total New Zealand population. Looking forward, the growing ethnic diversity in New Zealand will have significant cultural, social, political and economic implications and will affect policymaking.
A vibrant and high-performing SMEs sector is clearly critical to the prosperity of New Zealand; however, how financing choices affect the survival of SMEs is not clear, particularly in diverse ethnic. To explore the survival factors of SMEs, this study focuses on New Zealand SMEs operating in the Hamilton and Waikato regions of New Zealand where different ethnicity is found, specifically, with the intent to:
examine SMEs’ survival factors across different ethnic groups; and
examine the financing options affecting the survival of those SMEs.
If accessibility issues mitigate as ethnic diversity rises, then this study would naturally provide a great contribution to extant literature. Additionally, the findings of this study could be used to guide the policymakers to use the benefits of potential factors to increase the survival rate in New Zealand SMEs.
The second section of this paper presents the literature relating to ethnic diversity, financing choice and SMEs survival. The third section outlines the research methodology indicating samples, empirical model and frequency distribution analysis. The fourth section presents empirical findings, and the last section discusses the research findings and concludes the whole thesis.
Literature review
Ethnicity is one of the factors relating to the survival of SMEs. Some SMEs in New Zealand have trouble accessing financing because of ethnicity bias of the lenders. Several studies outside the Pacific Rim region have suggested that owners of small businesses from certain demographic groups may have less access to institutional financing than Caucasians (Whites); hence, there is likely discrimination on the basis of race, ethnicity and/or gender (Asiedu et al., 2012; Bates, 1991; Blanchard et al., 2008; Blanchflower et al., 2003; Cavalluzzo and Cavalluzzo, 1998; Cavalluzzo et al., 2002). This limited finance results in failure and existence.
The link between their ethnicities, desires and the financing options becomes critically important information for SMEs and government. Supply and demand dimensions determine the financing choices of SMEs, then affecting their survival. On the supply side, information asymmetries may affect the supply of bank credit through interest rates and credit risk. This happens in two ways: first, an adverse selection effect comes from sorting potential debtors, and second, an incentive effect influences debtors’ actions (Stiglitz and Weiss, 1981). From the perspective of demand side financing choices, the pecking order concept implies that owing to the information asymmetries between the firm and potential investors, SMEs will prefer retained earnings to debt, short-term to long-term debt and debt to equity (Myers and Majluf, 1984). The concept offers a financing framework that addresses how agency issues between founders and funding sources affect the funding sequence or the pecking order of founders’ financing decisions.
Previous studies mention that funding choices to SMEs are either limited or non-existent, particularly as compared with the choices available to large and publicly traded firms (Abor and Biekpe, 2006; Estwick, 2013; Briozzo et al., 2016). In general, SMEs’ financing tends to depend on internally generated sources of capital such as the redeployment of profits or short-term debts (Heyman et al., 2008). Most early-stage funding originates with the founder or founding team (Gartner et al., 2012). During the process of survival creation, founders are more likely to use debt financing first, and later equity financing (Frid, 2015). The preference for debt financing could stem from the desire to maintain control and avoid dilution of their equity stake. Additionally, it could be because of the capital costs of debt and equity. In general, the literature has identified several characteristics uniquely related to the survival of SMEs (Briozzo et al., 2016). These include firm size and age, ownership type and legal form, geographical location, industry sector and asset structure (reflecting the ability to provide collateral).
Research methodology and analysis
Samples
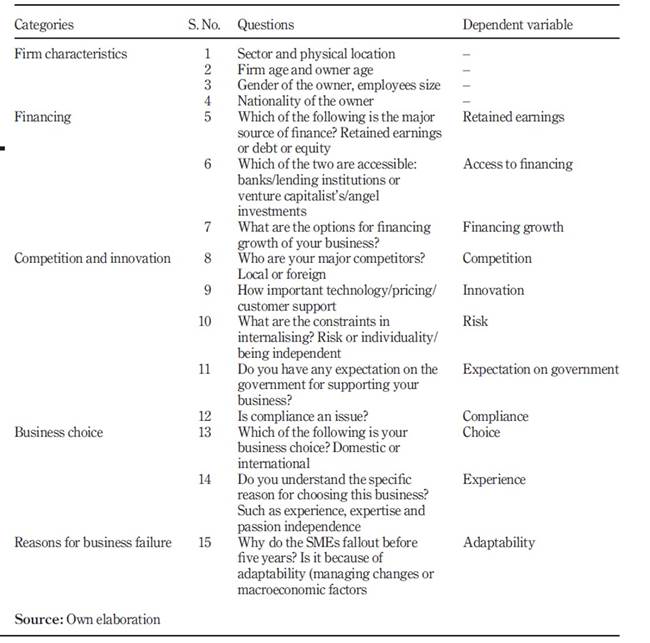
This study combines publicly available data obtained by questionnaires during the third quarter of 2014. The questionnaire was sent to 41 SMEs (Appendix) in the cities of Auckland and Hamilton using purposive sampling, achieving a response rate of 68.3%. The respondents of the survey were either the owners of small businesses or chief executive officers (CEOs) from SMEs’ privately held companies. The business entrepreneurs in the sample were asked a series of questions on topics relating to ethnicity, financing, employment, issues and challenges associated with survival and financing. The study also uses categorical, multiple choice and numerical ratings questions throughout the survey to collect financial data such as net profits or sales of SMEs from four groups involving six ethnic nationalities. Table 1 presents survey questions.
Empirical model
Following the literature (Shangqin et al., 2013; (Khermkhan et al., 2015), the study uses multiple linear regression (MLR) models with a binary dependent variable to examine factors affecting SMEs’ survival across different ethnicity. The linear probability model (LPM) is consistent with a binary dependent variable. The model regresses a binary variable on a set of explanatory variables using ordinary least squares, whereby the response probability is linear in the parameters. This study investigates whether factors such as firm characteristics, financing methods, competition, innovation, risk-internationalisation, growth and development affect the business continuity in the different phases of the business life cycle.
Firstly, to consider the impact of SMEs’ behavioural determinants on firm survival, the basic specifications with controlling SMEs characteristics are expressed as below:
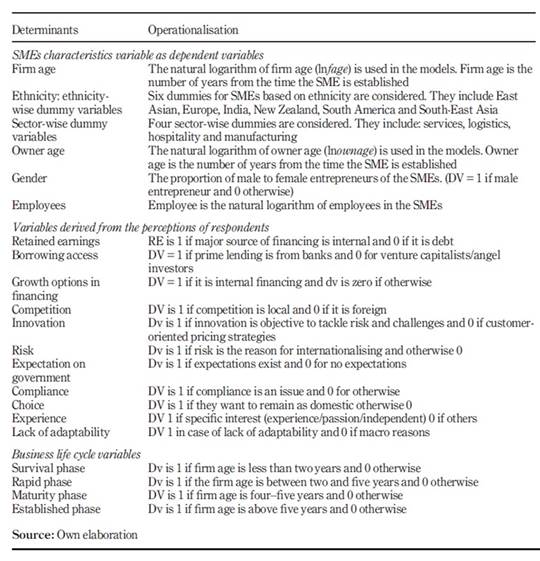
Table 2 presents variables use in this study. X1t is a vector of independent variables including SME characteristics. X2t is a set of dummy variables, consisting of ethnicity, business sector and business life cycle. This study also recognises the fact that the relationship between the outcome probability and the independent variables may not be linear even as an approximation. Therefore, this study uses non-linear models such as Probit and Logit to allow for this possibility. The construction of both non-linear models is based upon a latent variable approach. A variable is the net effect of taking a certain course of action. The outcome of the action Yi depends on such that:
However, only the binary outcome of the action (i.e. choice of financing and growth perceptions) can be observed. is a latent variable that can be directly explained by the set of explanatory variables:
Therefore:
where Ψ (.) is a cumulative distribution function (CDF).
For the Probit model, Ψ (·) is the CDF of the normal distribution. The Logit model bases its estimates on a logistic distribution. The CDFs of the normal and logistic distributions are very similar to each other, with the exception of the tails.
Frequency distribution analysis
The surveyed data is classified by the firms’ ethnicity, sector, firm age and employees.
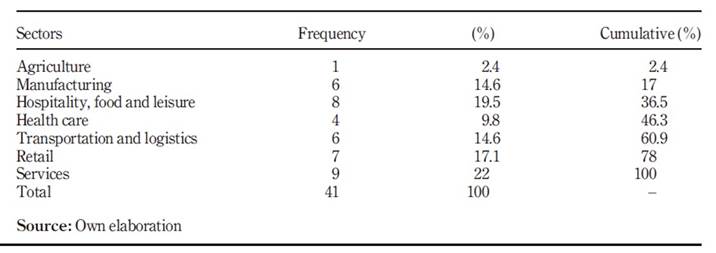
Table 3 presents that 22% of respondents are SMEs operating in the service sector; 19.5% from the hospitality, food and leisure sectors; 17.1% from the retail sector; and 14.6% from the manufacturing, transportation and logistics sectors. The health-care sector represents 9.8% and the agriculture sector represents 2.4% of the whole industry.
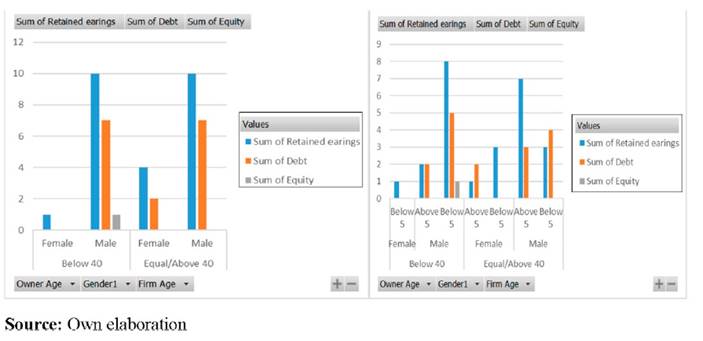
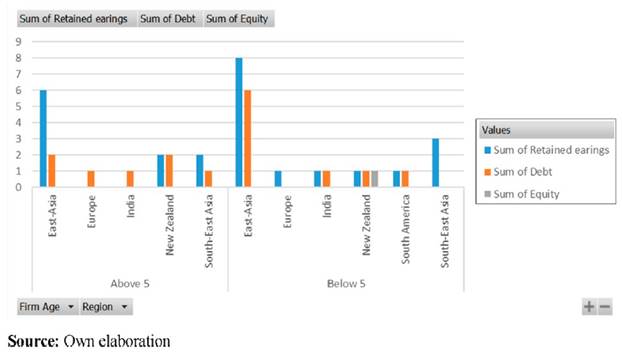
Figure 1 shows that retained earnings as a financing option are dominant over debt. Debt financing is not an option for female entrepreneurs who are younger than 40; they have a few options when they are older than 40. In the case of male entrepreneurs, age does not seem to be an important factor in financing options. The pattern of retained earnings and debt are the same under both age profiles of male business owners. When a firm’s age is considered, firms in business less than five years may have the option to carry a relatively higher debt level compared with firms in business longer than five years.
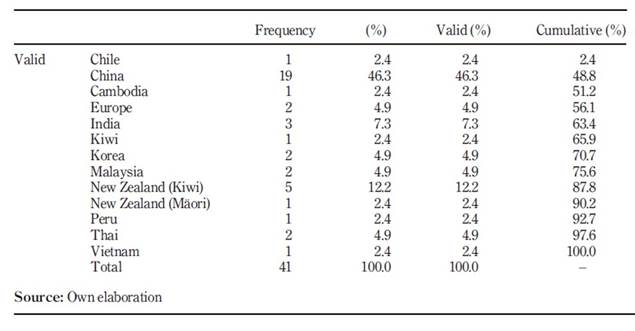
Figure 2 shows the spread of financing choices across six regions is classified based on ethnicity. The ethnicity classification and their representation in the sample are as follows: East Asia (51%) includes China and Korea; New Zealand (17%); South Asia (14.6%) includes Malaysia, Cambodia, Thailand and Vietnam; India (7.3%); Europe (4.9%); and South America (4.9%). In the case of East Asia, debt financing is prevalent in firms that have been in business for less than five years. The financing spread is in line with the evidence of Fluck et al. (1998), who found that contrary to predictions of the financial growth lifecycle model, external sources of financing were more prevalent than internal sources of financing for the youngest firms.
Empirical findings
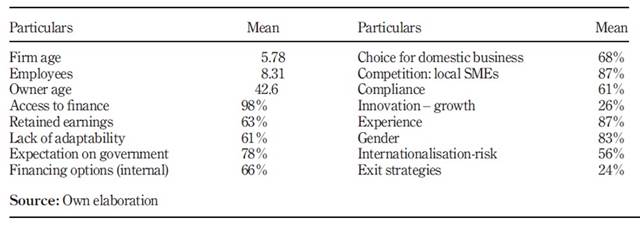
The summary statistics of the behavioural characteristics and independent variables are described in Table 4. Of the firms surveyed, the average length of time in business is five years, with an average of eight employees. The minimum age of the owners is 42 years. The descriptive statistics suggest that more than two-thirds (68%) of the selected SMEs included in the study prefer to be engaged in businesses within the country. The majority (87%) perceive that the threat of competition comes from local rather than international businesses. More than half of the SMEs (56%) perceive that this risk constrains their ability to internationalise. Although one quarter of the SMEs (26%) believe that innovation is an important strategy for growth and development, only one quarter (24%) of the SMEs have exit strategies in place should their businesses fail. Nearly two-thirds of the respondents (60%) indicated that retained earnings or self-funding is a popular option, called “internal financing”. Nearly all the respondents (98%) said that it is more common to borrow from banks and other lending institutions than to obtain funding through venture capitalists or angel investors. It is likely that more than half of the small businesses in New Zealand (61%) fail because of a lack of adaptability due to the failure to keep up with changes in the business environment. Three quarters of the respondents (78%) expect the government to support their businesses, and more than half (61%) consider governmental compliance an issue.
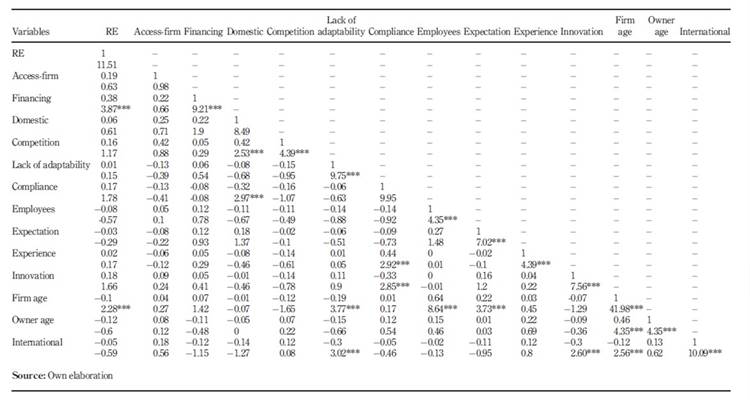
The correlation matrix for the SMEs behavioural characteristics and the explanatory variables is presented in Table 5.
As seen in Table 5, the domestic businesses category is strongly correlated with local competition and compliance, whereas retained earnings are strongly correlated with firm age and internal financing options. Further, lack of adaptability is strongly correlated with risk due to internationalisation and firm age. Likewise, a strong correlation is observed between firm age and expectations of government support, as well as between innovation and risk due to internationalisation.
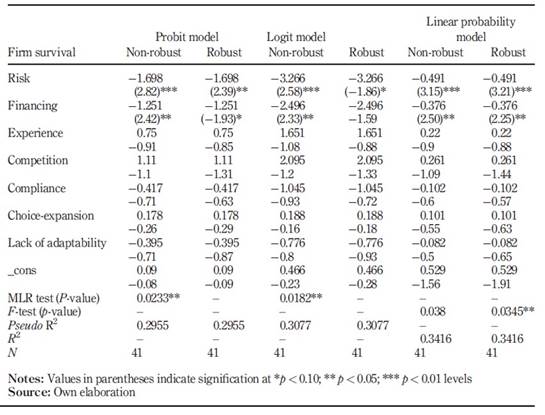
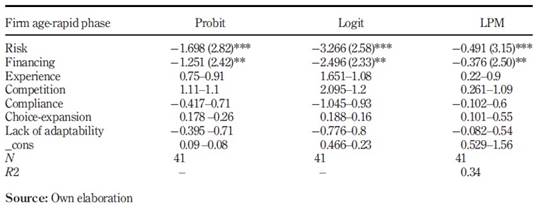
Table 6 demonstrates the results from Probit, Logit and LPM. The model is highly significant. LPM model and MLR tests show p-values as 0.023 and 0.0182, respectively, indicating significance at the 5% level. The R2 explains 34% of the variance within the group for the LPM model. Probit and Logit models show pseudo R2 at 0.29 and 0.30 under each model, respectively. Values of 0.2 or above are regarded as being very good (Louviere et al., 2000; McFadden, 1979). Further, to verify the validity of the variables’ significance, a robust approach is applied that affects the calculation of the standard errors, leaving the coefficient estimates unchanged. The resulting p-values for each independent variable are also shown in Table 6. Results are mostly robust under both model specifications.
Table 7 presents the marginal effects obtained from the linear and non-linear models. The variables found to have a significant effect on firm survival under all three approaches are similar and significant at the 1% level.
For each observation, Tables 8 and 9 present summary statistics of predicted probabilities calculated based on the coefficient estimates reported in Tables 5 and 6. The LPM predicts the probability to be outside zero, whereas the predictions from the Probit and Logit models are almost the same.
Post-estimation: measures of fit
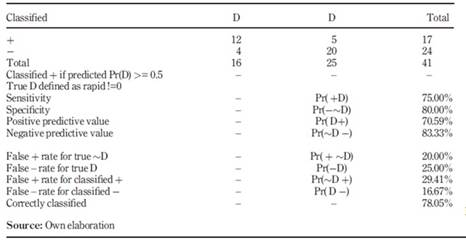
To ensure the model fit, the study uses Estat classification to estimate the acceptability of the fraction predicted. Table 10 presents the overall rate of correct classification is estimated to be 78%, with 80% of the firm age-rapid phase group correctly classified (specificity) and 75% of the firm age. The rapid phase is correctly classified (sensitivity).
Discussion and conclusion
The evidence gained from the above empirical findings suggests that in general, the deterministic pertaining to the firms’ survival is largely consistent with the theory that information asymmetries to the bankers and lending institutions may result in higher costs. The preferences of SMEs’ owners likely demonstrate pecking order behaviour. The empirical findings show that risk and financing are significant under three estimates. The coefficients under Probit and Logit models effect the change with a decrease in the z-score for a one-unit change in the risk by −1.68 (Probit), −3.266 (Logit) and −0.49 (LPM). A one-unit change in the financing would decrease the z-score by −1.251 (Probit), −2.496 (Logit) and −0.376 (LPM).
From the summary statistics, it is evident that only one quarter of the respondents considers innovation important for the growth and development of the business. Most of the respondents consider other local SMEs to be a competitive threat although more than half prefer doing business locally and consider doing business internationally to be too risky to contemplate. These perceptions of respondents imply they are either “defensive” or “necessity” entrepreneurs. Defensive entrepreneurs generally do not make changes to the business but let it continue in the way it is. Necessity entrepreneurs are people who became entrepreneurs because they prefer self-employment or prefer to avoid being subordinate (Colombelli et al., 2016). Further, the findings show that innovation does not significantly affect firm continuity, except for the manufacturing sector. A small portion of the manufacturing sector believes that innovation is significant.
The findings also show that debt financing is very low for female entrepreneurs. The clear majority of female entrepreneurs rely on retained earnings or self-financing. This aligns with the literature that suggests that women are less likely to seek external financing (Coleman and Cohn, 2000). With regard to gender, it appears that businessmen are more likely to employ multiple financing means, such as debt and/or equity, as compared with businesswomen, who tend to raise funds from internal firm sources or seek financial assistance from immediate or extended family members. This financial behaviour corresponds with gender stereotypes: male CEOs are usually risk takers, whereas women CEOs tend to be more cautious and less prone to risk-taking behaviours.
This study does not suggest challenges in financing for entrepreneurs based on their ethnicity. New Zealand entrepreneurs across all regions use debt financing regardless of their firm’s age or their own ethnicity. These results are in marked contrast to findings of researchers who consider ethnicity, especially Black ethnicity, as a factor in obtaining financing (Acs and Storey, 2004; Fraser, 2009; Ram and Smallbone, 2003).
The results of this study demonstrate that most of the New Zealand SMEs studied opted for internal financing, followed by bank borrowing for their survival. SMEs’ least preferred choice seems to be equity capital. This hierarchy of financing choices is consistent with Myers and Majluf’s (1984) pecking order theory. New Zealand SMEs focus their business on the domestic market; therefore, local competitors pose the greatest potential threats in the fight for market share. Furthermore, inadequate financial support is one of the main obstacles in restricting the growth of SMEs in New Zealand. SMEs employers have been demanding more financial subsidies than non-financial support from the Government of New Zealand. Given the high level of non-financial resources offered to SMEs, it is likely that organisations such as New Zealand Trade and Enterprise, Regional Business Partner Network, Business Mentors New Zealand and New Zealand Angel Association are satisfying New Zealand SMEs’ needs for non-financial resources.
Interestingly, limited access to debt financing is not the main reason New Zealand SMEs are deterred from going abroad for sales. Instead, SMEs say they fear they will fail to achieve expected returns, and this fear discourages them from establishing business overseas. The results also show that the longer firms exist, the more likely that debt financing would be used. These findings are consistent with Dong and Men’s (2014) findings, that financing is a greater obstacle for younger, smaller firms. Such companies are consistently confronted with severe, external financing challenges. As a result, younger, smaller firms largely depend on internal financing, despite its potential to impinge on their growth. The correlation matrix demonstrates that SMEs recruiting less than five employees are positively associated with newly built firms. Similarly, there is a positive relationship between SMEs with life spans exceeding five years and firms with 15-20 employees. The interpretation is that staff number tends to run proportional to the longevity of an SME’s establishment.


