


 English (pdf)
 Article in xml format
 Article references
 Send this article by e-mail
 Cited by SciELO
  Similars in
SciELO
Similars in
SciELO 
 Permalink
1. Introduction
Recurrent crises in the strongly connected world have resulted in many research studies in the risk management field. The global financial crisis of 2007-2009 brought attention to financial risk management practices with the goal of improving the existing methods for quantifying market risk. Value-at-risk (VaR) is a common tool used to quantify market risk.
VaR is defined as a measure of the maximum potential loss within a confidence level over a specific period of time. However, an important issue in market risk is the inaccurate estimation of risk since different VaR models lead to different risk measures. Particularly for emerging markets, VaR estimations during periods of financial crises are difficult, especially for the higher loss quantiles (Dimitrakopoulos et al., 2010). This investigation is principally motivated by this concern.
Many VaR estimation models have been presented in the literature, but there is not an accepted method for all situations and markets. One of the most successful methodologies for market risk quantification based on modeling the entire distribution of returns is the VaR estimation, which employs alternative GARCH specifications under different distributional assumptions (see Assaf, 2009; Mcmillan and Kambouroudis, 2009; Dimitrakopoulos et al., 2010). This approach relies on the specification of the variance equation, error distribution and assumption that the returns are i.i.d.
However, Kuester et al. (2006) noted that the optimal specification of the volatility dynamics is an impossible task and suggested that VaR estimation should be based on the quantile regression approach. One of the most successful methodologies based on modeling the quantile of the returns was proposed by Engle and Manganelli (2004) and is called the Conditional Autoregressive Value at Risk (CaViaR) model (see Bao et al., 2004; Chen et al., 2012; Drakos et al., 2015; Kuesteret al. (2006). This quantile regression model does not require distributional assumptions.
Although some studies have investigated the predictive performance of CaViaR models in VaR forecasting, the focus of the literature has largely been on developed markets. To our knowledge, there are no studies on the Market Integrated Latin America (MILA) and Association of Southeast Asian Nations (ASEAN) emerging stock markets that compare the predictive performance of CaViaR and VaR estimations based on GARCH models.
This paper tests the accuracies of the models that predict the VaR for the MILA and ASEAN-5 emerging stock markets during financial crisis periods. VaR estimations are performed using the GARCH, EGARCH and GJR-GARCH models under normal, skewednormal, Student-t and skewed-Student-t distributional assumptions and are compared with the predictive performance of the four CaViaR specifications proposed by Engle and Manganelli (2004). Global financial integration has allowed emerging countries to gain growing shares of direct and indirect foreign investment (Lizarzaburu et al., 2015). In this context, the development of a solid capital market and the accurate estimation of market risk help to ensure a source of continuous investment.
In particular, quantifying and forecasting the risk for the MILA and ASEAN-5 stock markets is crucial for evaluating the global market risk since the MILA is the biggest stock exchange in Latin America and the ASEAN region accounted for 11% of total global foreign direct investment inflows in 2014. Furthermore, ASEAN-5 global financial integration has accelerated in recent years and, according to the Asian Development Bank, this region is projected to average 7% annual growth by 2025.
The rest of this paper is organized as follows. Section 2 provides a brief literature review. Section 3 describes the univariate GARCH models, the CaViaR quantile regression model and the backtesting methodologies. Section 4 presents the statistical characteristics of the data, the volatility model estimations, the VaR forecasting and out-of-sample backtesting results. We conclude in Section 5.
2. Literature review
Many VaR estimation models have been presented in the literature, but there is not an accepted method for all situations and markets. For example Bao et al. (2004) compared the predictive performance of different VaR models before, during and after the Asian crisis according to the empirical coverage probability and the predictive quantile loss. The results for these five Asian economies show that for calm periods, the RiskMetrics model performs well, models based on extreme value theory (EVT) perform better in the crisis period (1997- 1998) and the Conditional Autoregressive Value-at-Risk (CaViaR) quantile regression models are quite satisfactory in predicting the VaR across various periods.
Similarly, Kuester et al. (2006) used a sample of 30 years of NASDAQ daily returns to examine the VaR forecasting performance of some methods arising from the models that were mentioned before, and the results show that none of the unconditional models are acceptable. In addition, the parametric GARCH models significantly enhanced forecasting performance. Conversely, quantile regression models delivered mixed results, and only the simple adaptive CaViaR specification performed well.
Mcmillan and Kambouroudis (2009) compared the GARCH and RiskMetrics models in terms of their volatility and VaR forecasting using 31 stock market indices in the period from January 1999 to September 2007. The results show the in-sample superiority of the GARCH model with respect to RiskMetrics. However, for the forecasting of the VaR, the APARCH model is better than GARCH for most European markets and larger Asian markets.
In the case of emerging markets, Ho et al. (2000) measured the VaR using EVT for six Asian financial markets, and their results showed that the extreme value approach captured rare events and their magnitude beyond the 99% confidence level. Similarly, Assaf (2009) studied Egyptian, Jordanian, Moroccan and Turkish markets using sample data of the stock indexes from April 1997 to April 2002. The conclusion, in this case, was that the heavy tail behavior of the returns cannot be ignored because the normal distribution underestimates the value at risk and the use of EVT is appropriate for these markets.
In Dimitrakopoulos et al. (2010), a very exhaustive study of developed and emerging markets in normal, crises and post-crisis periods is presented. Commonly used models for VaR quantification are compared with the EVT approach. The best estimations of risk for emerging markets are given by two approaches: Peaks over the threshold and Filtered Historical Simulation. Conversely, for developed markets, several methods perform well. The conclusion of this study is that there is an evident difference between the two kinds of markets. Particularly for emerging markets, VaR estimation during periods of financial crises is a difficult task, especially for the higher loss quantiles.
Chen et al. (2012) examined the VaR forecasting performance of some risk models using violation rates, backtesting, market risk charges and quantile loss functions. The empirical results suggest that the proposed threshold CaViaR model outperforms the other models in terms of VaR forecasting. In addition, Rubia and Sanchis-marco (2013) analyzed whether certain state variables that are related to the market trading process can enhance tailpredictability, and the results of an empirical analysis based on a battery of backtesting tests applied to different VaR approaches (CaViaR, EVT, EWMA and GARCH) suggest that traderelated variables enhance the VaR forecasting performance.
Drakos et al. (2015) tested the four CaViaR specifications of Engle and Manganelli (2004) and its asymmetric improvement I-CaViaR from Huang et al. (2009). They compared their predictive performances, and an empirical analysis was conducted before, during and after the 2007-2009 financial crisis of six stock market indices (Standard & Poor 500, FTSE, NIKKEI, DAX, CAC and Athens Exchange General Index). The results demonstrate that the CaViaR and I-CaViaR models provide adequate VaR predictions.
More recently, there has been a growing body of literature on energy commodities’ prices and VaR forecasting that compare the predictive performance of the GARCH and CaViaR approaches, such as Youssef et al. (2015). Laporta et al. (2018) showed for the case of seven energy commodities that the CAViaR and a new technique called dynamic quantile regression is the best selection since the point of view of backtesting. In the same line of commodities, Liu et al. (2019) CAViaR model was used analyzing the oil international market and its impact on stock, commodities and foreign exchange Chinese markets but the spillover of risk is important only for the commodity market.
Related with China, in Jian et al. (2018) a measure (multivariate semiparametric predictive CoVaR) bidirectional dynamics is derived from a MV-CAViaR model to study the asymmetry of Chinese stock exchange and the futures markets as main transmission depending on the periods of bullish and bearish in the market. The model CAViaR was used for the estimation of VaR with log returns of Chinese indexes SSEC (Shanghai Security Composite), SHBSHR (Shanghai Stock Exchange B Share) and SZSC (Shenzhen Security Component) in Wu (2020). The following model specifications are compared: Adaptive, Symmetric absolute value, Asymmetric slope and Indirect GARCH (1,1). The symmetric absolute value model was the better one for the 1% VaR in the cases of SSEC and SHBSHR. At the same time, the indirect GARCH was the better model for SZSC.
Klochkov et al. (2019) made a novelty approach of the called localizing multivariate CAViaR to study the risk transmission found the important role of American market represented by the S&P 500. Another interesting application is the impact of default risk of a bank towards the country risk in Peng (2021). The study is through the five years CDS (Credit Default Swaps) spreads using CAViaR models resulting in a relevant impact for the case of Netherlands and Germany economies.
As new line of papers, we found those related with cryptocurrencies. In an application for seven cryptocurrencies returns, Li et al. (2020) analyzed the risks of them using the CAViaR model concluding that the risk transmission is highly related to the market capitalization of the cryptocurrencies. Similarly, Lia et al. (2021) explore the VaR estimation and volatility forecasting capability using the CAViaR methodology.
Although some studies have investigated the predictive performance of the CaViaR models in VaR forecasting, the focus of the literature has largely been on developed markets. To our knowledge, there are no studies on the Market Integrated Latin America (MILA) and Association of Southeast Asian Nations (ASEAN) emerging stock markets that compare the predictive performance of the CaViaR and VaR estimations based on GARCH models.
3. Methodology
One of the most successful methodologies for market risk quantification based on modeling the entire distribution of returns is the VaR estimation employing alternative GARCH specifications under different distributional assumption (see Assaf, 2009; Mcmillan and Kambouroudis, 2009; Dimitrakopoulos et al., 2010). The objective of this methodology is to capture the stylized characteristics of financial data as heavy tails, asymmetry and volatility clustering. In this paper, we considered different GARCH specifications with several error distributions to capture these features and to take into account the asymmetric impacts of positive and negative shocks on volatility.
The previous approach relies on the specification of the variance equation, error distribution and assumption that the returns are i.i.d. However, Kuesteret al. (2006) noted that the optimal specification of the volatility dynamics is an impossible task and suggested that VaR estimations should be based on the quantile regression approach. With the purpose of modelling the quantiles of returns, we considered the four alternative CaViaR specifications proposed by Engle and Manganelli (2004).
The principal difference between these two approaches is that GARCH VaR estimations are based on modeling the entire distribution of returns and require distribution assumptions. Conversely, the CaViaR approach is focused on the quantile behavior instead of the distributions’ returns, i.e. it does not require any restrictive hypothesis for the innovation term. In addition, this approach quantifies the VaR using a dynamic quantile regression over time.
3.1 GARCH model
The Generalized Autoregressive Conditional Heteroskedasticity (GARCH) model was introduced by Bollerslev (1986) with the objective of capturing clusters of volatility in financial series. Due to its simplicity, the GARCH(1,1) model is a good fit for financial data (Bali and Theodossiou, 2007); therefore, we considered this model, which is described as follows:
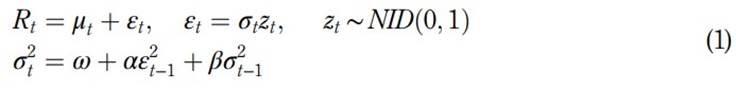
where Rt represents returns, μt represents the conditional mean, zt represents the innovation term and σ2 t represents the conditional variance with the parameter restrictions ω > 0; α and β ≥0 and α þ β < 1. In this paper, normal, skewed-normal, Student-t and skewed-Student-t distributions are considered for the innovation term.
3.1.1 Exponential GARCH model. Another popular GARCH model is the Exponential GARCH (EGARCH) model introduced by Nelson (1991) with the objective of taking into account asymmetric leverage volatility effects. In this model, no restrictions are placed on parameters α and β: The EGARCH(1,1) model is described as follows:

where γ is the asymmetric leverage coefficient that captures the size effect.
3.1.2 GJR-GARCH model. Another GARCH model is the GJR model introduced by Glosten et al. (1993) with the objective of also taking into account the potential larger impacts of asymmetric leverage volatility effects. The GJR(1,1) model is described as follows

where I (.)is an indicator function and γ is the asymmetric leverage coefficient that captures the volatility leverage effect.
3.2 CAViaR model
The Conditional Autoregressive Value at Risk (CaViaR) was introduced by Engle and Manganelli (2004) with the purpose of focusing on the regression quantile of the returns. This model quantifies the VaR using a quantile regression over time. We study the predictive performance of the four CaViaR specifications: the Symmetric Absolute Value, the Adaptive, the Asymmetric slope and the Indirect GARCH(1,1). The general CaViaR model is described as follows:
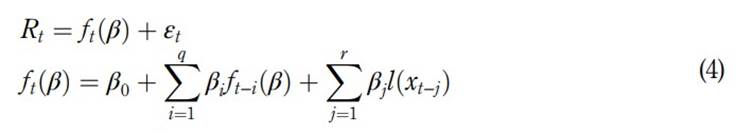
where f t (β) denotes the θ quantile of the distribution of the portfolio returns at time t formed at time t −1, x t is a vector of observable variables at time t, β θ = β is a p-vector of unknown parameters (p = q+ r+ 1) and l(.) is a function of a finite number of lagged values of the observable variables. The autoregressive term βi ft−i (β) ensures a smooth quantile regression over time, and l(xt−j) represents the relationship between ft(β) and the observable variables that are included in the information set.
In this specification, x t−j could be lagged exogenous information or lagged portfolio returns, and following Engle and Manganelli (2004), we considered lagged returns as a natural choice. The four CaViaR specifications proposed by Engle and Manganelli (2004) that we estimated were the following.
3.2.1 Adaptive specification

where G ∈ ℝ+: This adaptive specification has a unit coefficient on the lagged VaR and captures two cases: when the VaR is exceeded, its value should increase; in the opposite case, its value should decrease by a small margin. The parameter G could be estimated; however, to keep the model simple we followed Engle and Manganelli (2004) and we take G =10. 3.2.2 Symmetric absolute value (SAV)

Given that, in this specification, the coefficient on the lagged VaR is not restricted to be equal to one, this model is mean reverting, and it can be specified using a GARCH process with a standard deviation that is symmetrically distributed with i.i.d. errors.
3.2.3 Asymmetric slope specification

where (Rt −1)+ = max(Rt; 0) and (Rt −1) - = −min(Rt; 0). This model is mean reverting as well and, similarly to the SAV, can be specified using a GARCH process with a standard deviation that is asymmetrically distributed with i.i.d. errors. That is, this specification captures the fact that positive and negative returns have different impacts on the VaR. 3.2.4 Indirect GARCH(1,1)

This model is also mean reverting and symmetrically responds to past returns. Engle and Manganelli (2004) noted that this specification can be correctly modeled under the assumption that the underlying data process follows a true GARCH(1,1) with an i.i.d. error distribution. As in Engle and Manganelli (2004) (1), the estimation of the unknown parameters of the alternative CaViaR models is realized by regression quantiles using the approach suggested by Koenker and Bassett (1978).
3.3 Backtesting
An important issue in market risk is the accurate estimation of risk, given that the most widely adopted risk measure is the VaR and different VaR models lead to different risk measures. Therefore, it is of vital importance to evaluate the predictive performance of the VaR estimates. In this work, we employed the backtesting procedure, which is the most commonly used technique, to evaluate the accuracy (2) of VaR predictions. The backtesting approach employs statistical tests that analyze the predictive model performance using the accuracy and efficiency based on an established criterion. In this work, we evaluate the predictive performance of each model using the Unconditional Coverage (UC) test of Kupiec (1995), the Conditional Coverage (CC) test of Christoffersen (1998) and the Dynamic Quantile (DQ) test of Engle and Manganelli (2004). As is known, any backtesting test should validate whether the VaR estimate series are serially independent and identically distributed. Although the Conditional Coverage test of Christoffersen (1998) detects the presence of serial correlation, according to Engle and Manganelli (2004), this is a necessary but not sufficient condition to assess the performance of a quantile method. Therefore, we evaluate the predictive performance of each model through the tests that were mentioned before:
3.3.1 Unconditional coverage (UC) test. The UC test of Kupiec (1995) consists of determining whether the realized coverage rate equals the theoretical coverage rate. This test follows an asymptotic chi-square distribution with one degree of freedom and evaluates whether the expected proportion of violations is equal to α. The Kupiec likelihood ratio test statistic is given by the following:
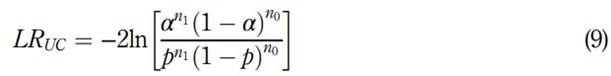
where T is the sample size, n1 is the number of VaR violations, n 0 = T −n 1 and p = n 1 /T is the percentage of violations.
3.3.2 Conditional coverage (CC) test. The conditional coverage (CC) test of Christoffersen (1998) requires a correct unconditional coverage and, furthermore, ensures that the result series is i.i.d. The Christoffersen conditional coverage test statistic follows an asymptotic chisquared distribution with two degrees of freedom and is given by the following:

where nij is the number of observations with value i followed by j, and π01 = n01/(n00 + n01).
3.3.3 Dynamic quantile (DQ) test. The dynamic quantile (DQ) test of Engle and Manganelli (2004) is based on a lineal regression in which the dependent variable is the sequence of violations and the independent variables are past violations or any other variables in the information set. This model is given by the following:

From equations (11) and (4), we can assume that the expectation and conditional expectation at period t −1 are zero. Engle and Manganelli (2004) affirmed that if Hitt(β0)has no correlation with its own lagged values and with ft(β0) and its expected value is zero, then there is no correlation among the hits and we able to obtain the correct fraction of exceptions. This test follows an asymptotic chi-squared distribution with q degrees of freedom (q is the lagged violations that are considered in the regression model). In this paper, the DQ test includes the predictive VaR and the Hit series as independent variables at a lag of q = 4
4. Empirical results
4.1 Data and descriptive statistics
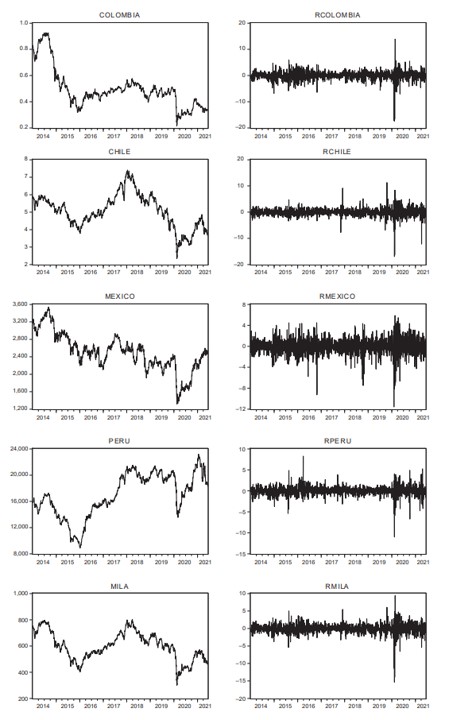
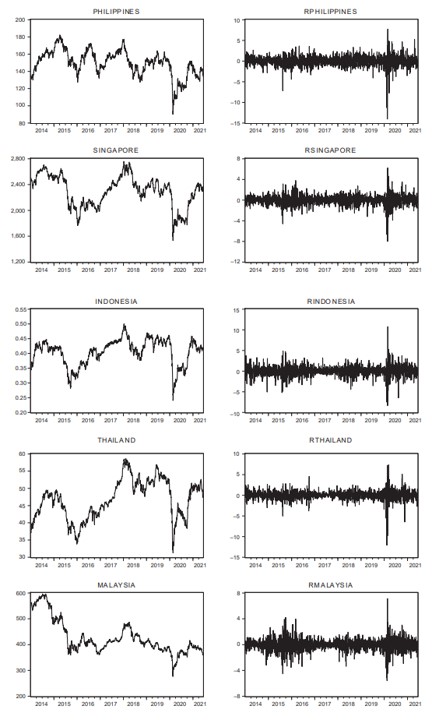
For the empirical analysis, we employed data from the MILA (Peru, Mexico, Colombia and Chile) and ASEAN-5 (Indonesia, Malaysia, Philippines, Singapore and Thailand) emerging stock markets. The respective stock market indices (SPBVL, MEXBOL, COLCAP, IPSA, JCI, FBMKLCI, PCOMP, STI and SET) and the MILA index were used as proxies for emerging markets (3). The daily closing prices were obtained from Bloomberg for the period from January 2nd, 2014 to July 15th, 2021; thus, the sample consisted of 1940 observations. With the objective to evaluate the predictive performance of the VaR approaches during a crisis period, we split the sample into an in-sample period of 1,425 observations and an out-ofsample period of 515 observations. Quantitative estimation was performed using the R software (version 3.5.2), and the reference currency is the US dollar.
The descriptive statistics of the entire period are presented in Table 1, Panel A for Latin American emerging markets and Panel B for Asian emerging markets.The hypothesis of normality is significantly rejected by the Jarque-Bera (J-B) test. The Ljung-Box (L-B) test on squared returns with 20 lags indicates a significant serial correlation. The ARCH Lagrange Multiplier (ARCH-LM) test reveals the presence of volatility clustering. Moreover, the augmented Dickey-Fuller (ADF) test with 20 lags based on regressions with an intercept and time trend rejects the presence of unit roots.
Table 1 Descriptive statistics of scaled (100x) daily logarithmic stock index returns
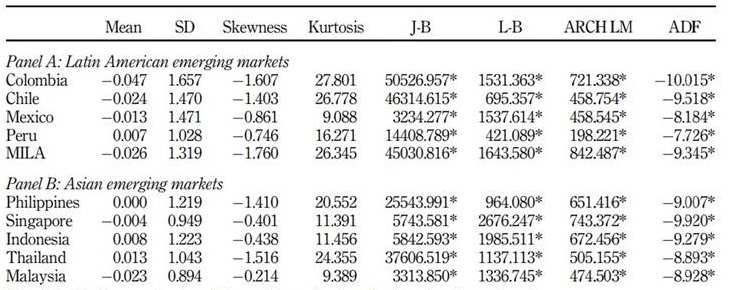
Note(s): * indicates rejection of the null hypothesis at the 1% significance level
Figures 1 and 2 show the daily closing spot price and the daily logarithmic stock index returns for the entire sample, respectively. It is observed that the indexes spot prices sharply decline in the first quarter of 2020, which was mainly caused by the worldwide pandemic crisis. Also should be noted that daily logarithmic stock indexes returns reveal volatility clustering. In summary, we can see a similar prices’ and returns’ behavior in these markets.
4.2 GARCH estimation parameters
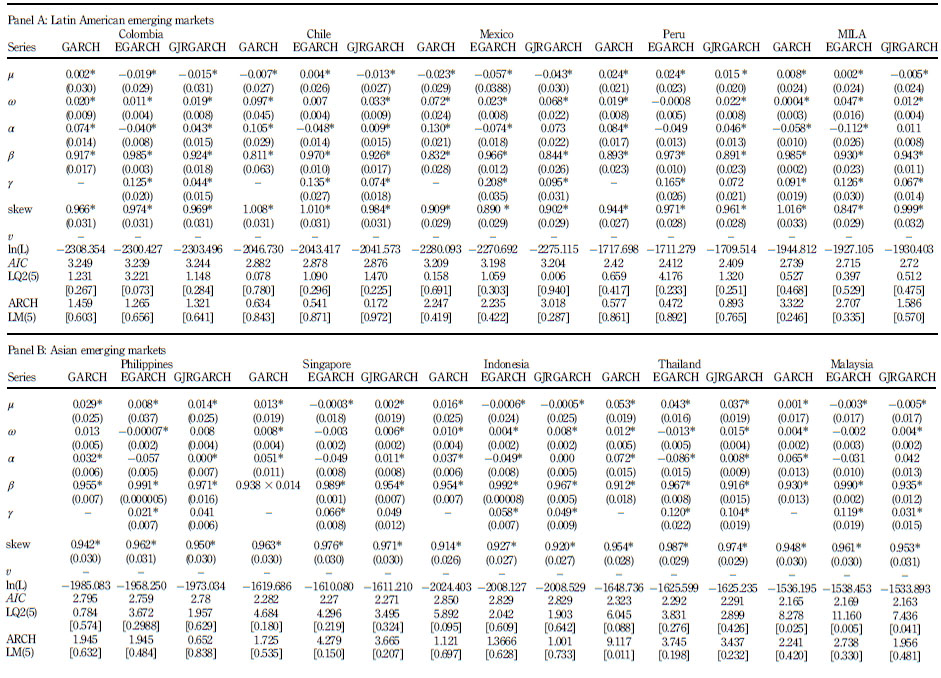
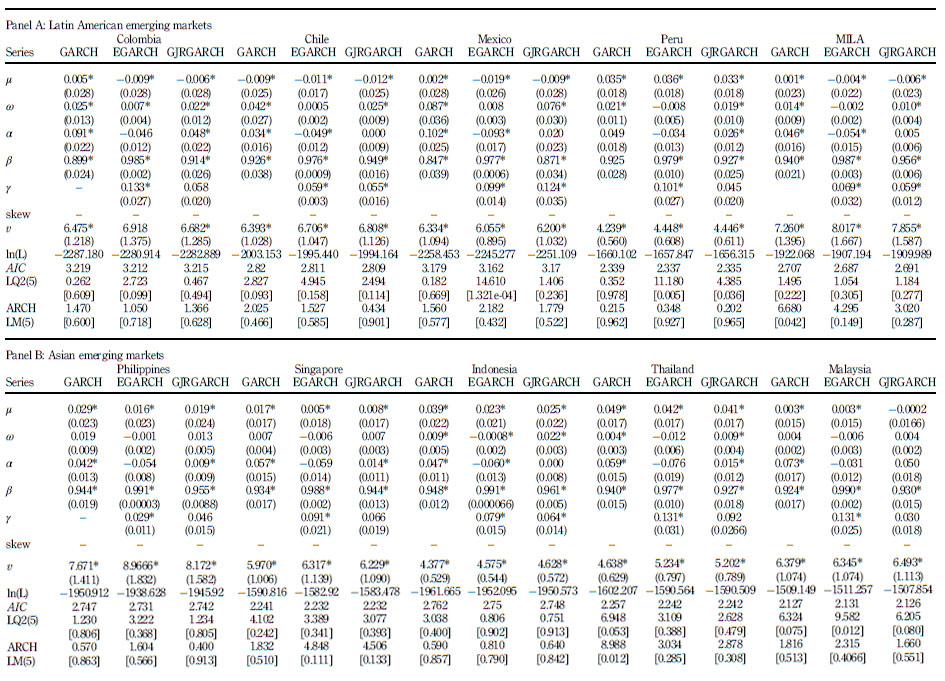
In this paper, we examine the market risk quantification of different VaR models using GARCH, EGARCH and GJR-GARCH under normal, skewed-normal, Student-t and skewedStudent-t distributional assumptions. The estimates of the parameter vector described in equations (1)-(3) are made using the MLE. Tables 2-5 report the in-sample parameter estimates for the GARCH models described in Section 2 under the different distribution assumption mention before.
From Tables 2-5, we can derive some conclusions. First, for the GARCH (1,1) model, the sums of parameters α and β are less than one, ensuring that the conditions for stationary covariance hold. For the EGARCH models, the asymmetric leverage coefficients γ are significant, indicating the presence of asymmetric leverage volatility effects. Second, the ν’s of the Student-t and skewed-Student-t distributions (Tables 4 and 5) are significant for the three GARCH models, revealing that the returns series are leptokurtic and heavy-tailed. Third, the LQ diagnostic test for squared residuals finds that there is no serial correlation in the squared standardized residuals, and the ARCH LM test finds the absence of ARCH effects in the standardized residuals. Finally, the AIC goodness of fit criterion indicates that the GARCH is the model that best captures the dynamics of the returns series, except for Malaysia with the EGARCH model selected. However, we should mention that this case is interesting because some coefficients are non-significant and for the GARCH model all coefficients are significant.
4.3 Evaluation of the VaR predictive performance
We sought to compare the predictive performance of the two approaches considered in this paper: VaR estimations based on different GARCH models under different error assumptions and the four CaViaR specifications proposed by Engle and Manganelli (2004). Thus, we used
accuracy to accomplish this, and this document adopted the backtesting procedure described in Section 2.
In particular, to assess the performance of each model, we employed an iterative algorithm to calculate the 1-day-ahead VaR. First, we estimate the in-sample VaR, and then, the estimation sample was rolled forward to include another day and the oldest observation was dropped to allow the estimation window’s size to remain the same. Finally, in each iteration, the VaR was forecasted and recorded.
The backtesting approach employs statistical tests that analyze the predictive models’ performance according to accuracy. In this work, we employed the unconditional coverage (UC) test of Kupiec (1995), the conditional coverage (CC) test of Christoffersen (1998) and the dynamic quantile (DQ) test of Engle and Manganelli (2004) that were described in Section 2. The backtesting results for the out-of-sample VaR at the 95 and 99% confidence levels are presented in (Table 2 , 3 , 4 y 5 ) Tables 6 and 7 , respectively. The last row of Panel A presents the percentage at
Table 2 Estimation results for different volatility models with normal error distributions
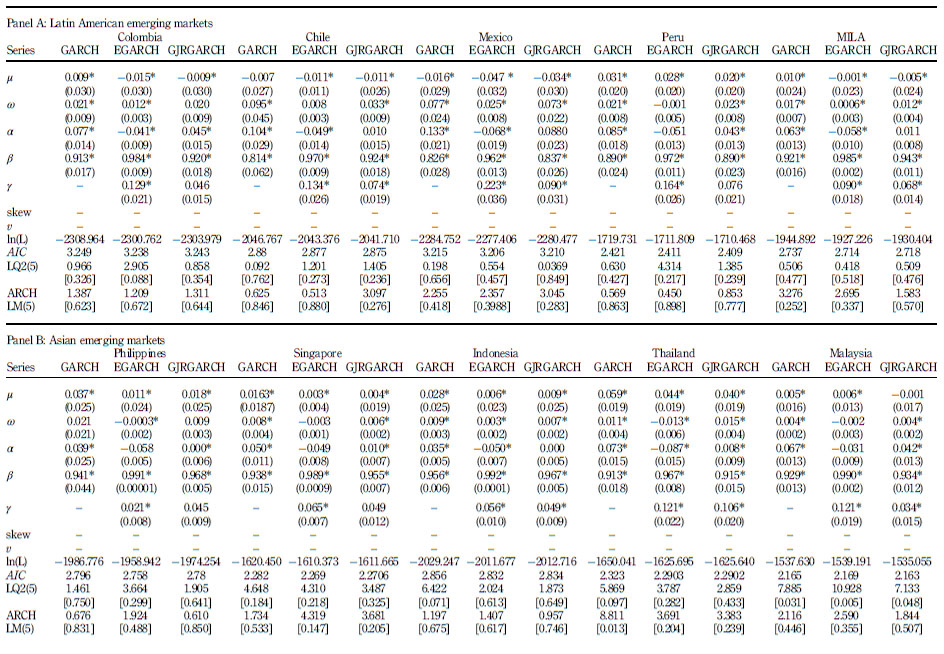
Note(s): ln(L) is the value of the maximized log-likelihood. AIC is the Akaike Information Criterion, LQ2(5) is the Ljung and Box statistics of order five computed on the standardized square residuals, ARCH LM is the ARCH Lagrange Multiplier test of order five. * indicates significance at the 1% significance level, standard errors are in parentheses and the numbers in brackets are p-values
Table 3 Estimation results for different volatility models with skewnormal error distributions
Note(s): ln(L) is the value of the maximized log-likelihood. AIC is the Akaike Information Criterion, LQ2(5) is the Ljung and Box statistics of order five computed on the standardized square residuals, ARCH LM is the ARCH Lagrange Multiplier test of order five. * indicates significance at the 1% significance level, standard errors are in parentheses and the numbers in brackets are p-values
Table 4 Estimation results for different volatility models with t-student error distributions
Note(s): ln(L) is the value of the maximized log-likelihood. AIC is the Akaike Information Criterion, LQ2(5) is the Ljung and Box statistics of order five computed on the standardized square residuals, ARCH LM is the ARCH Lagrange Multiplier test of order five. * indicates significance at the 1% significance level, standard errors are in parentheses and the numbers in brackets are p-values
Table 5 Estimation results for different volatility models with t-skewstudent error distributions
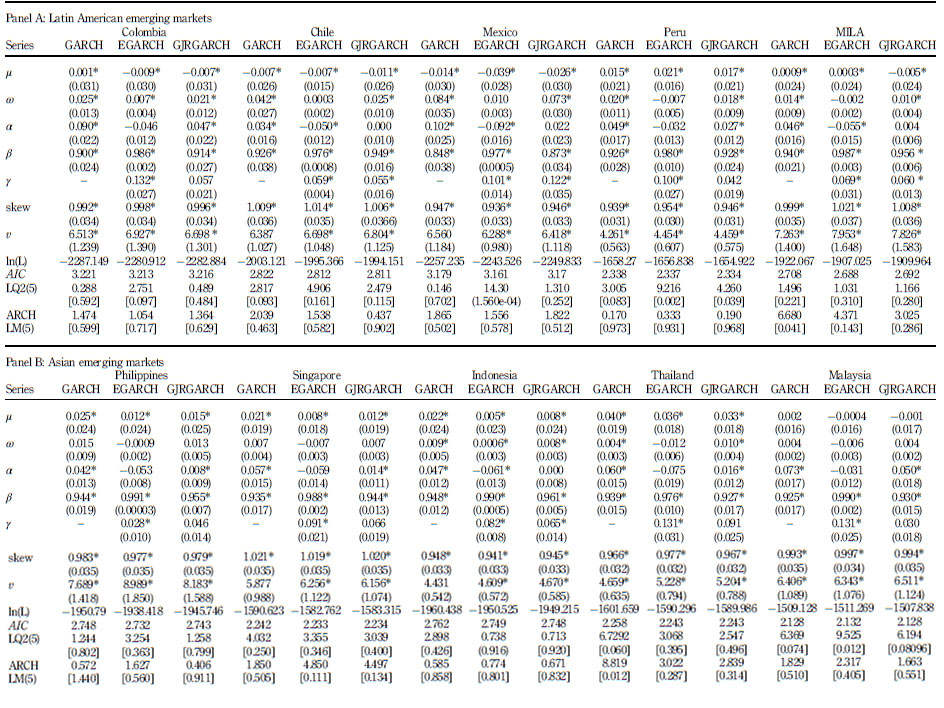
Note(s): ln(L) is the value of the maximized log-likelihood. AIC is the Akaike Information Criterion, LQ2(5) is the Ljung and Box statistics of order five computed on the standardized square residuals, ARCH LM is the ARCH Lagrange Multiplier test of order five. * indicates significance at the 1% significance level, standard errors are in parentheses and the numbers in brackets are p-values
Table 6 Backtesting results at 95% confidence level
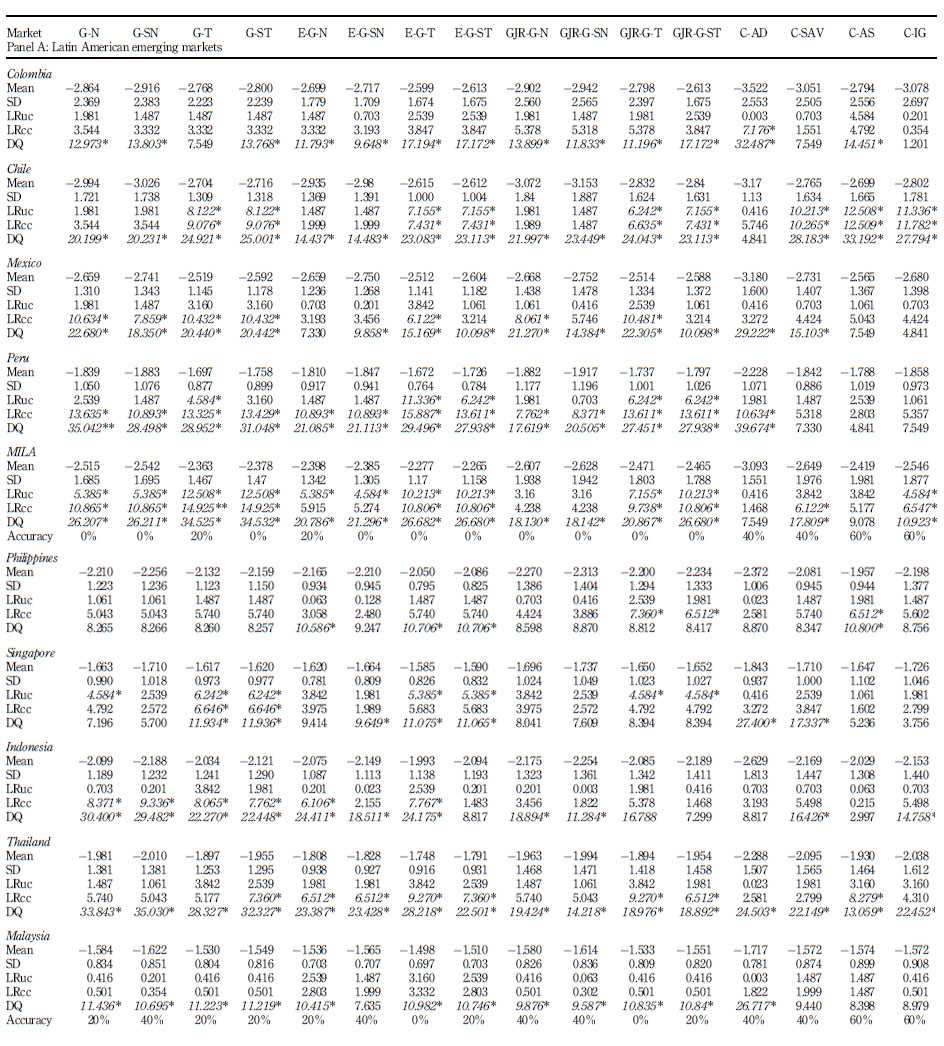
Note(s): LRuc is the unconditional coverage test of Kupiec (1995), LRcc is the conditional coverage test of Christoffersen (1998) and DQ is the dynamic quantile test of Engle and Manganelli (2004). The critical values of the LRuc, LRcc and DQ are 3.84, 5.99 and 9.49, respectively. * indicates that the model does not pass the coverage test at the 5% significance level
Table 7 Backtesting results at 99% confidence level
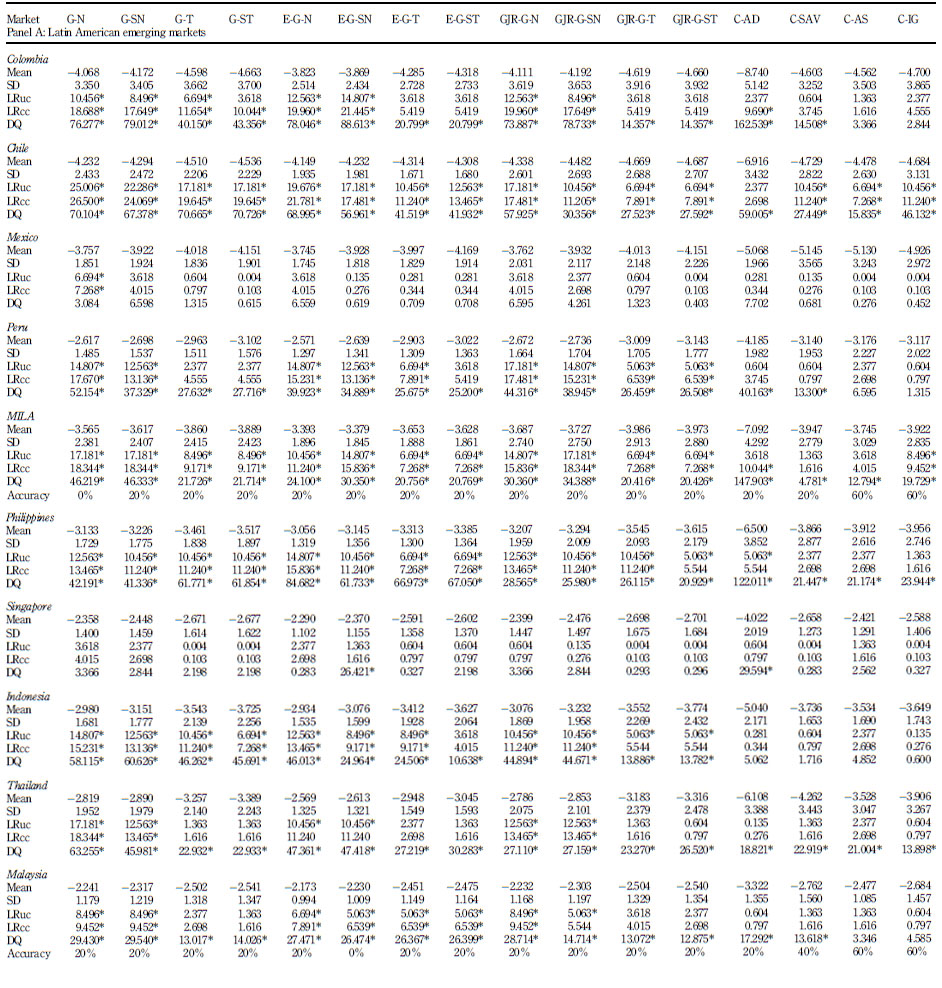
Note(s): LRuc is the unconditional coverage test of Kupiec (1995), LRcc is the conditional coverage test of Christoffersen (1998) and DQ is the dynamic quantile test of Engle and Manganelli (2004). The critical values of the LRuc, LRcc and DQ are 3.84, 5.99 and 9.49, respectively. * indicates that the model does not pass the coverage test at the 5% significance level
which a particular model passed the coverage of the three backtests at the 5% significance level for Latin American emerging markets.
For Latin American emerging markets, the backtesting results at the 95% confidence level suggest that the CaViaR-IG (denoted as C-IG) and CaViaR-AS (C-AS) have the best VaR predictive performance according to its accuracy (60%), followed by the CaViaR-AD (denoted as C-AD) and CaViaR-AS (C-AS) models with a 40% accuracy. For Asian emerging markets, we have a similar behavior for the four CaViaR specifications. At least for these series in this period, these results suggest that the models that were mentioned before are capable of capturing these stylized characteristics.
At the 99% confidence level, for both groups of emerging markets, the results presented in Table 7 suggest that the best predictive VaR model are the CaViaR-IG and the CaViaR-AS model according to its accuracy (60%). Finally, it is important to mention that the CaViaR-IG and the CaViaR-AS specifications are the only ones that passed the three backtests for both groups of emerging markets at both confidence levels. However, according to the results, the VaR predictive performances of the remaining models vary too much and are not robust with respect either to the confidence levels or the market.
From those results, we suggest that CaViaR models outperform GARCH models in terms of accuracy according to the three backtests, and this result can be justified as follows. The CaViaR approach is focused on the quantile behavior instead of the distributional returns. That is, the CaViaR approach quantifies the VaR using a dynamic quantile regression over time and does not require a restrictive hypothesis on the innovation term.
5. Conclusions
Model selection for market risk quantification for the MILA and ASEAN emerging stock markets is particularly important for portfolio diversification due to the integration of emerging markets with the rest of the world. It is important to mention that the MILA represents the biggest stock exchange in Latin America and that the ASEAN region accounted for 11% of global foreign direct investment inflows in 2014. Furthermore, according to the Asian Development Bank, this region is projected to average 7% annual growth by 2025.
This paper tests the accuracies of models that predict the VaR for the MILA and ASEAN emerging stock markets during financial crisis periods. In particular, we compare the predictive performance of two approaches: VaR estimations based on different GARCH models under different error assumptions and the four CaViaR specifications proposed by Engle and Manganelli (2004).
The empirical results show that the out-of-sample VaR forecast of the CAVIAR-IG and CaViaR-AS specifications outperforms the GARCH model and the other two CaViaR specifications according to their accuracies at all confidence levels. This evidence is based on the results of a backtesting approach that employed three statistical tests that analyzed the predictive performance of the models according to their accuracy.
The results of this study suggest the robustness of the CAVIAR-IG and CaViaR-AS models in out-of-sample VaR forecasting for the MILA and ASEAN emerging stock markets in crisis periods and have potential implications for market risk management. Since the evidence showed that CaViaR models improve the VaR performance forecast and provide more accurate VaR estimates, it is convenient that risk managers and investors who are active in the MILA and ASEAN emerging stock markets adopt the CaViaR quantile regression model to quantify market risk, these would be very useful in terms of portfolio and risk management.
Moreover, the recent worldwide pandemic crisis has increased price volatility and financial uncertainty. Such financial uncertainty has shown the necessity of improving the existing methods for quantifying market risk. The main findings of this study are that the CAVIAR-IG and CaViaR-AS models have shown significant success to quantify the risk during crisis periods, these results play an important role in order to design adequate risk management protocols to achieve greater resilience in financial markets.
Notes
1. They proved that these estimators are asymptotically efficient and consistent.
2. Accuracy means the degree of how close a measurement is to the accepted value based on an established criterion.
3. According to Dimitrakopoulos et al. (2010), these indices are widely recognized as the most comprehensive and reliable measures that cover the performance of the most active stocks in their respective stock markets.

