English (pdf)
 Article in xml format
 Article references
 Send this article by e-mail
 Cited by SciELO
  Similars in
SciELO
Similars in
SciELO 
 Permalink
Introduction
Closed-end funds (CEFs) are investment companies that issue a fixed number of shares and invest the resources pursuing the objective of the fund. Unlike more popular open-end funds, CEF shares (traded on a stock exchange) cannot be redeemed by investors at their net asset value (NAV). It is now widely acknowledged that CEF share prices trade at levels that are significantly different from the market value of the assets that the CEF invests in. This phenomenon is known as the closed-end fund puzzle. According to Roenfeldt and Tuttle (1973), even though some funds trade at a premium (i.e. share prices are higher than NAV per share), discounts of 10 and 20% are the norm for CEFs. In addition, premiums and discounts appear to have a life cycle. Based on Lee et al. (1991) this cycle has four parts: (1) CEFs start trading at a premium of almost 10%. By and large, the premium is related to setup costs that reduce NAV (but not share prices) (2) 120 days after the inception of the fund, discounts are close to 10%. From this moment on, discounts are more likely to occur than premiums (3) discounts are subject to great variability in time and (4) in a merger, liquidation or conversion of the CEF to an open-end fund, discounts narrow and converge to zero.
Market inefficiency implies that market participants can obtain abnormal returns by exploiting return predictability based on past returns or other variables. The extant literature has shown the inefficiency of the CEF market because of the assets that the CEF invests in, and the CEF itself should trade at equivalent prices (following the law of one price). Furthermore, given that the CEF is nothing more than a portfolio of assets, discounts are a clear violation of the additivity concept that implies that in a perfect market, the value of a group of assets must equal the sum of the individual assets that belong to the group. In this document, we explore another type of market inefficiency, whether deviations from fundamental value (i.e. whether funds trade at a discount or premium) can forecast future CEF returns. This would be a clear violation of market efficiency in its weak form (Fama, 1970).
This study focuses on a specific type of closed-end fund. We concentrate on closed-end country funds that invest in a single country. Among the different types of CEFs in the USA (municipal bond, taxable US bond, diversified US equity, sector and speciality, global and international, and single-country funds), single country funds are possibly more subject to systematic or non-systematic risk, noise trading and considerable information asymmetries. These three features make our study more interesting and justify our sample choice.
2. Literature review
Several papers have analysed the closed-end fund puzzle and put forward alternative explanations for the presence of discounts or premiums. The most common explanations are related to rational and behavioural factors.
Some studies support the rational explanation of market segmentation as a determinant of CEF premiums or discounts. Kim and Song (2010) find that the higher the investment barriers (both direct and indirect (e.g. political risk)) that foreign investors face, the higher the premium of closed-end country funds that trade in the USA. This positive relationship supports the idea that investors derive diversification gains when trading in CEFs (and thus are willing to pay share prices that exceed NAVs), and that CEFs are a way to bypass investment restrictions in the funds’ local or target markets (1). Davies et al. (2017) find a different effect of market segmentation on CEF prices and NAVs. They use a time-varying measure of market segmentation for the UK-traded closed-end country funds (that invest in emerging markets) and report that direct barriers to foreign investors are negatively related to both closed-end fund price and NAV returns. Overall, both NAV and prices tend to decline after the enforcement of barriers possibly due to the expectation of lower capital flows directed towards the segmented (country) market.
Davies et al. (2013) examine another rational explanation related to illiquidity. They study the impact of both fund and country illiquidity on the premium of UK closed-end country funds. Using a sample of funds that invest in either developed or developing markets, they find that fund illiquidity is not significant in explaining the premium (after considering several control variables). Interestingly, they also document that the premium and country illiquidity are positively related indicating that increasing (country) illiquidity augments the premium. This positive relationship implies that investors are willing to pay more for foreign markets that are deemed more illiquid but offer more upside potential.
An additional rational explanation to CEF discounts or premiums is related to the extent of arbitrage activity. Lee et al. (1990) analyse the two strategies an arbitrageur can implement when the CEF trades at a premium or discount. If the CEF trades at a premium, the arbitrageur can sell the fund short and go long on the underlying portfolio. In countries with restricted or segmented markets, this strategy is difficult and costly, and thus deviations from intrinsic value may be justifiable from a rational point of view. If the CEF trades at a discount, the strategy is straightforward: liquidate the fund or open-end it (so the discount vanishes). Nevertheless, taking over a fund is difficult given (among other reasons) the fierce resistance of fund managers. Yet, discounts may be justifiable from a rational perspective.
In more recent literature examining arbitrage and deviations from fundamental value, Alexander and Peterson (2017) find evidence that is consistent with an efficient market in which short-selling activity occurs often in the CEF market. Interestingly, short-selling occurs for funds that trade at a premium and even at a discount. Furthermore, premia and discounts tend to revert to fundamental values consistent with the idea that investors push prices towards equilibrium levels (e.g. premiums decline over the next five days after shortselling activities increase).
On the other hand, a behavioural explanation for the premiums or discounts in the CEF market is related to the presence of non-informed (or “noise”) investors that create an additional risk for rational (or fundamental) investors. The idea is that this risk (or noise trader risk) commands a price and could be a plausible explanation for the difference between NAV and share prices.
Lee et al. (1991) argue that irrational investors are more prevalent in the ownership of CEFs than in the ownership of the underlying assets of the funds. When irrational investors become pessimistic about the future, the market value of the CEF dwindles (below NAV), and prevents rational investors from buying the fund (at discount prices) due to noise trader risk.Thaler (2016) explains a case of noise trading in which irrational behaviour ends up affecting prices in the CEF market and creates a wedge between prices and intrinsic value. The Cuba CEF (the fund did not own Cuban stocks but US and Mexican equities) used to trade at a 10-15% discount to NAV. On December 18, 2014, share prices rose (so the fund started trading at a 70% premium, while NAV remained the same) after US President Obama lifted commercial restrictions on Cuba. Even though NAV remained constant, the (irrelevant) news of a change in US policy affected CEF prices. Even more puzzling was the fact that the premium lasted for several months.
3. Method
3.1 Data
We use monthly data in US dollars of 29 CEFs that invest in developed and emerging markets. These 29 funds trade in the USA and UK. We chose these two countries since funds trading in the US and UK had the most complete information. To be able to control by region we decided to include closed-end country funds given the fact that these funds invest either in one country or region. Historically, closed-end country funds have served as an instrument for investors to access foreign markets. Table 1 reveals that our CEFs invest in 12 countries. The country with the highest number of funds is Japan.
Our sample period spans from 1988 to 2010. We gathered information from the ClosedEnd Fund Association (CEFA) and Investec Bank and Asset Manager websites. We also collected information from Bloomberg. The two main variables of our study are RPX or the fund’s share price return and RNAV is equal to returns based on NAV changes. Both share prices and NAVs are adjusted for dividends and splits. Moreover, returns are continuously compounded. RPX and RNAV are calculated as follows:
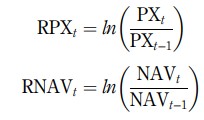
Table 1 List of funds
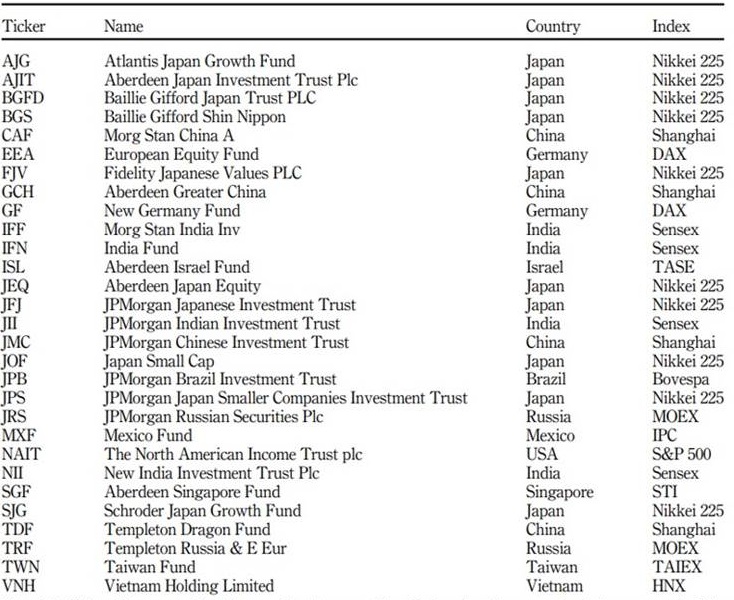
Note(s): This table reports the ticker and fund name of the 29 closed-end country funds in our sample. The second to last column shows the country of origin of the fund’s assets (or its local or target market). The last column reports the stock index used to proxy for local or target market returns
Source(s): Own elaboration
where, PX is the share market price of the fund, NAV is the net asset value of the fund, t stands for time, and ln for natural logarithm. We also estimate the fund’s premium (PR) or discount (when the variable is negative) as follows:
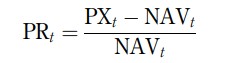
Table 2 reports mean values per fund for RPX, RNAV and PR. For most of the funds (20), the mean share price return is positive and fluctuates from 1.30% to 0.88% per month. In terms of asset returns, RNAV is also positive for most (23) of the CEFs and ranges from 1.09% to 0.82%. Most funds trade at a discount to NAV that averages 8.65%
Table 2 Mean values per fund-RPX, RNAV and PR
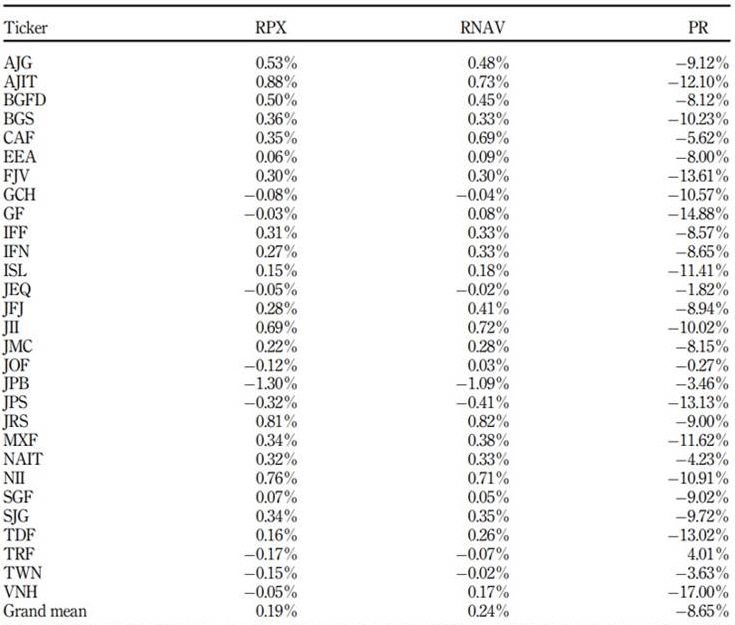
Note(s): Note(s): This table includes mean values of our main variables. RPX stands for share price return, RNAV for returns estimated from NAV (net asset value) changes, and PR for the premium (if positive) or discount (if negative). The last row reports the sample mean across all funds of our three main variables
Source(s): Own elaboration
3.2 Model and procedure
Our main empirical (econometric) tool is a vector autoregressive (VAR) model. In a VAR model, all variables are deemed endogenous since each variable is expressed as a linear function of its lagged values and lags of the remaining variables. This approach makes it possible to capture the co-movement and short-term dynamics of the variables included in the model. A VAR model is quite flexible, and for this type of model, it is not common to analyse the results per equation or individually (Arias and Torres, 2004). In short, we estimated two VAR models:
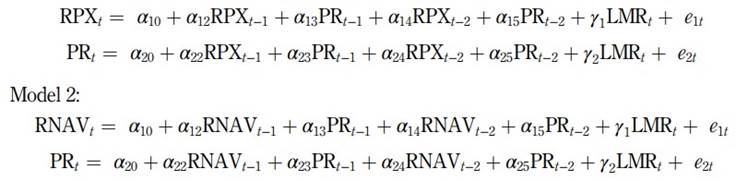
In Model 1, the return variable is related to share price, while in Model 2, returns are related to NAV. PR is the premium (or discount) and LMR (local-market return) is an exogenous control variable that stands for the market return of the country of origin of the CEF assets. Our models thus include both local variables and variables related to the CEF’s country of trading. These two models are estimated separately for each of the 29 CEF country funds in the sample.
We used the Akaike (1974) information criterion (AIC) to choose the optimal number of lags of the VAR models. For most of the funds (89.65% and 79.31% for models 1 and 2, respectively), the optimal number of lags was equal to two (purposely coinciding with our equations for the two VAR models) (see Table 3).
Table 3 Optimal number of lags of our VAR models
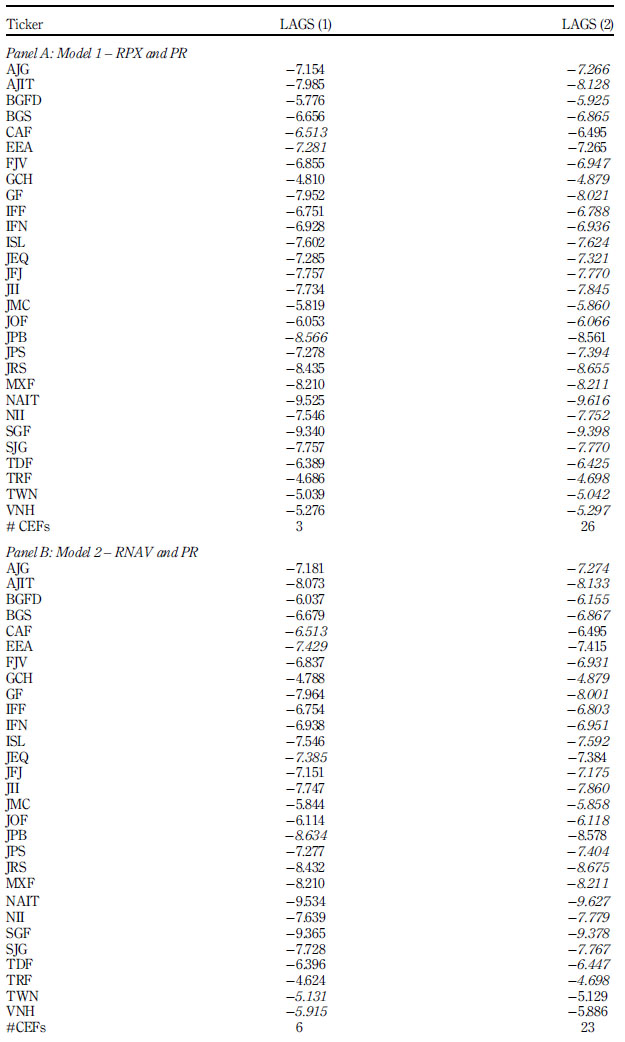
Note(s): This table reports Akaike information criterion (AIC) values for our vector autoregressive (VAR) models with one or two lags. For each fund, we report the minimum value of AIC in italic. In the last row, we count the number of funds in which the optimal number of lags is equal to one or two.
Source(s): Own elaboration
Once the optimal number of lags has been chosen and the problem of serial autocorrelation discarded (Lagrange-multiplier (LM) test results are available upon request), it is necessary to determine whether RPX, RNAV and PR are stationary. One of the usual requisites for a proper estimation of a VAR model is that the variables that enter the model should be stationary (Arias and Torres, 2004) (2). In this regard, when one establishes that the mean and variance is constant (i.e. the variable is stationary), it is possible to conclude that the relationship among variables is a short-term relationship, and if there is the predictive power of the premiums (or discounts) on returns, this predictive power should be in short time spans (remember the optimal lag length of two months).
Next, we ran Dickey-Fuller tests to check whether the series (RPX, RNAV and PR) presented a unit root. We then ran (for each of the funds) Granger causality tests - as is common in the literature - (see, for example, Pradhan et al., 2020) for the three series. The main purpose of causality tests is to determine whether there are some causal relationships among variables and, more specifically, whether lagged variables of (e.g.) PR help predict future values of RPX or RNAV. In short, Granger causality tests allow us to determine whether premiums/discounts show predictive power on returns.
We first ran causality tests for each CEF, and then we aggregate results for all funds to determine, for example, how often PR (Granger) causes RPX or RNAV.
Finally, we estimated impulse response functions. Our focus is to observe how a shock in time t of PR affects returns, thus determining the existence or not of return predictability, the prediction horizon and the direction (or sign) of the impact.
4. Results
Table 4 shows p-values of Dickey-Fuller tests for RPX and RNAV. Both variables are stationary (p-values of 0.000) for the 29 CEFs in the sample.
Table 4 Dickey-Fuller test results
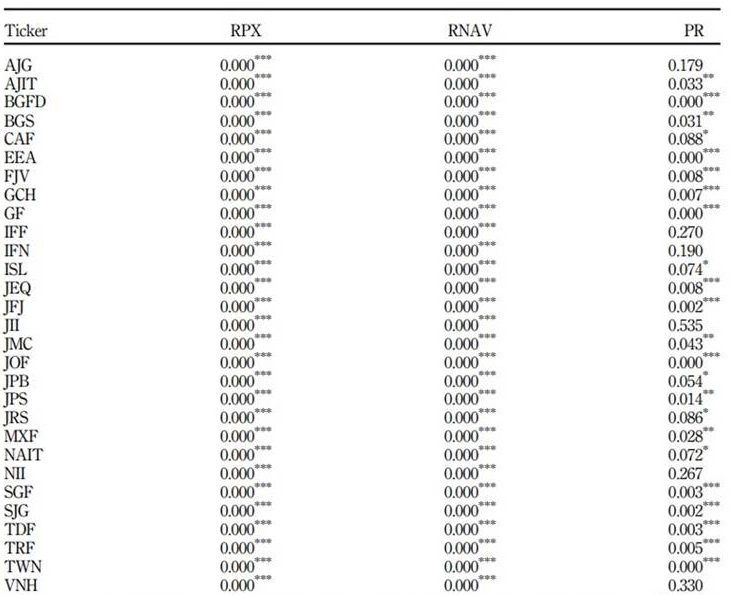
Note(s): This table reports MacKinnon p-values for Dickey–Fuller tests of our three main variables. ***,**, and * denote significance at the 0.01, 0.05, and 0.10 level
Source(s): Own elaboration
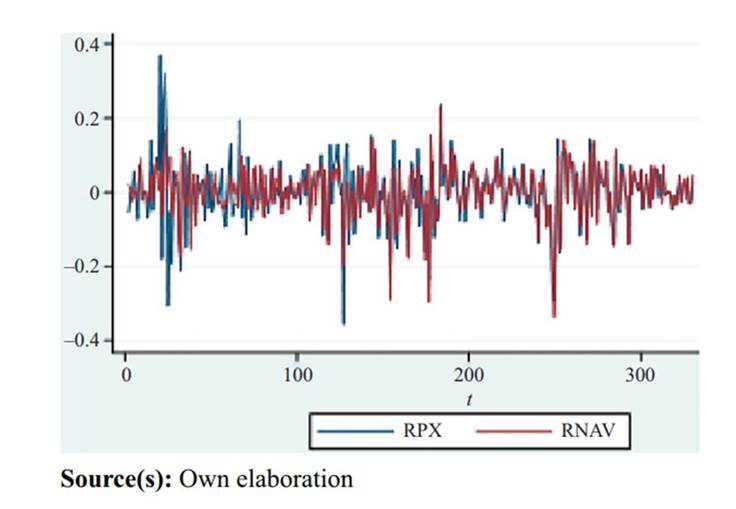
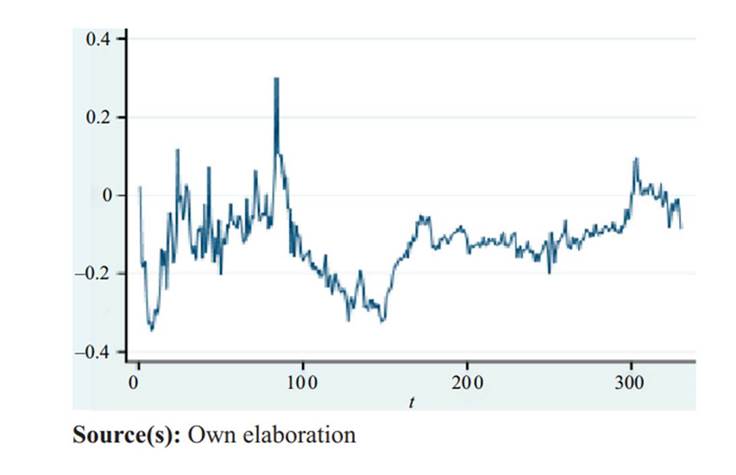
Figure 1 displays such stationary behaviour for the European Equity Fund (EEA). On the other hand, PR was stationary for 23 out of the 29 funds (or 79.31%) in the sample. Overall, even though deviations from fundamental value are mean-reverting, there is some evidence of persistent discounts for some funds. Figure 2 shows the mean-reverting behaviour of the premium (or discount) for MXF (Mexico Fund).
We ran the Dickey-Fuller test in first differences for the six non-stationary funds. After differencing, all the six PR series achieved stationarity.
Table 5 presents the results of Granger causality tests. In short, we can see that PR Granger causes RPX for 16 out of 29 funds in the sample. In other words, for 55.17% of the funds, we find evidence consistent with the idea that CEF premiums (or discounts) do carry predictive power on CEF returns. In sum, the market appears to be able to anticipate a fund’s future returns using information contained in the premiums (or discounts). This sort of predictability runs against market efficiency (in its weak form). It might be that the deviations from fundamental value capture systematic risk (from a rational perspective), or that deviations reflect behavioural factors (e.g. noise trader risk) that end up manifesting in RPX. We leave the interesting issue of disentangling which type of risk is priced (whether rational or behavioural) for future research.
We also observed that PR Granger causes RNAV for only six (out of 29) funds. In all, we can assert that although premiums or discounts carry some predict power on NAV returns, the predictive power is quite weak (covering only 20.69% of our sample). This result was somewhat expected since NAV returns are more closely related to the performance of fund assets or to managerial abilities to extract returns from those assets
Table 5 Granger causality test results
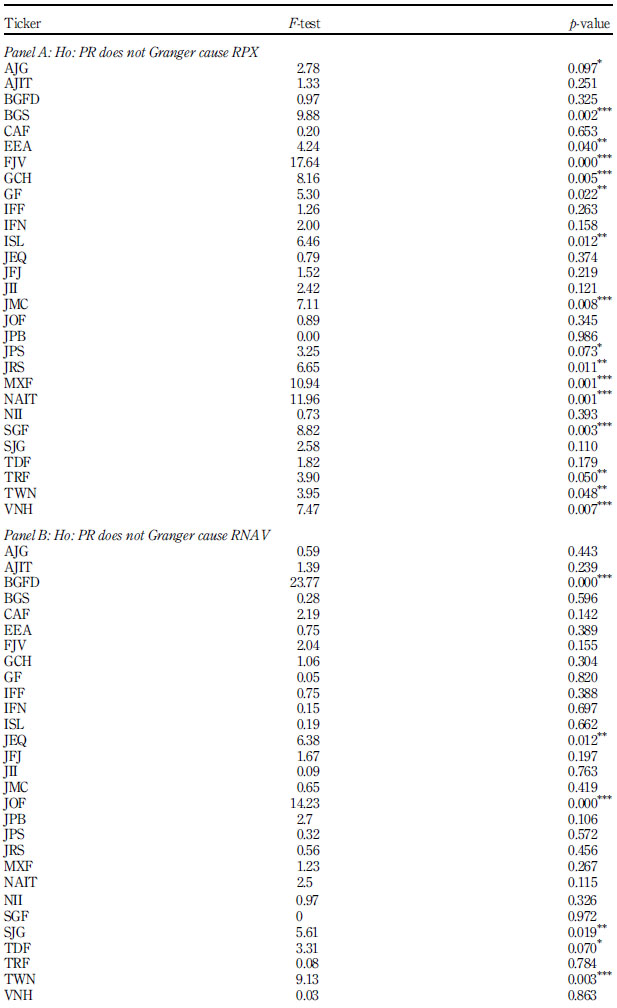
Note(s): This table reports F-tests and MacKinnon p-values for Granger causality tests for two (see panels A and B, respectively) null hypotheses (Ho). ***, **, and * denote significance at the 0.01, 0.05, and 0.10 levels, respectively. Source(s): Own elaboration
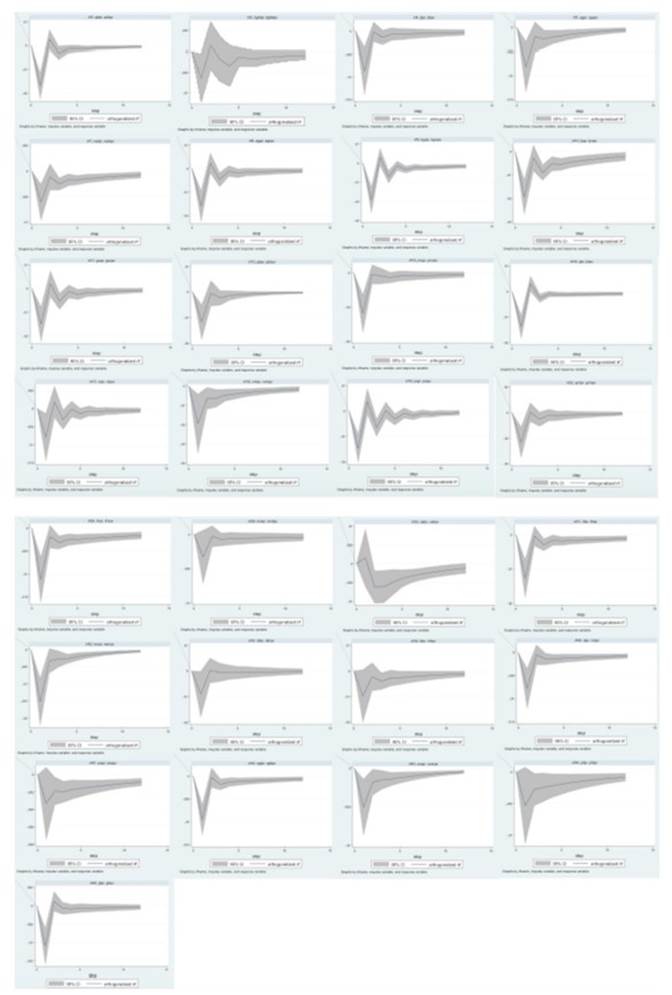
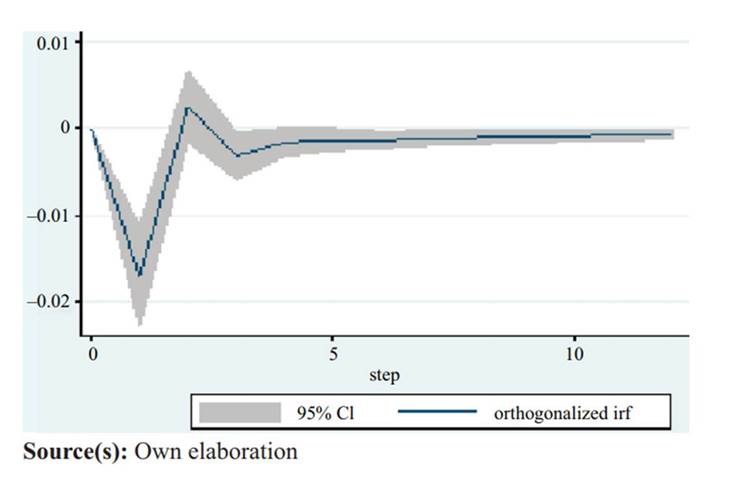
Appendix 1 presents graphical results for our impulse response function analyses. We study the behaviour of RPX following a shock on PR. With a 5% significance level, we can conclude that there is statistically significant evidence for 23 funds that increase in the premium (or decreases in the discount), negatively impact the future returns of the fund for a short while and then return to their initial level. Figure 3 shows this type of behaviour (i.e. an initial negative impact followed by a non-significant effect (i.e. the confidence interval includes zero) on RPX after a premium (positive) shock) for Aberdeen Japan Investment Trust (AJIT). This finding of negative (positive) returns following discount decreases (increases) is consistent with the idea of mean-reversion in CEF share returns, and also with Swaminathan (1996), Kim and Song (2010), and Jones and Stroup (2010) since CEFs with higher discounts tend to have a higher risk exposure, and their local or target markets are more likely to present higher direct and indirect barriers for investment such as capital controls, political and liquidity risk, macroeconomic instability and information asymmetries among local and foreign investors. In all, if risk exposure dwindles, the premium should increase (or the discount should fall), and consequently, future returns should drop.
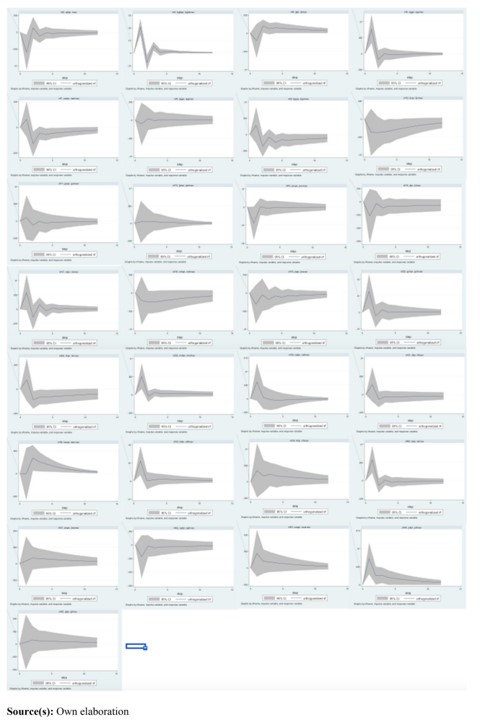
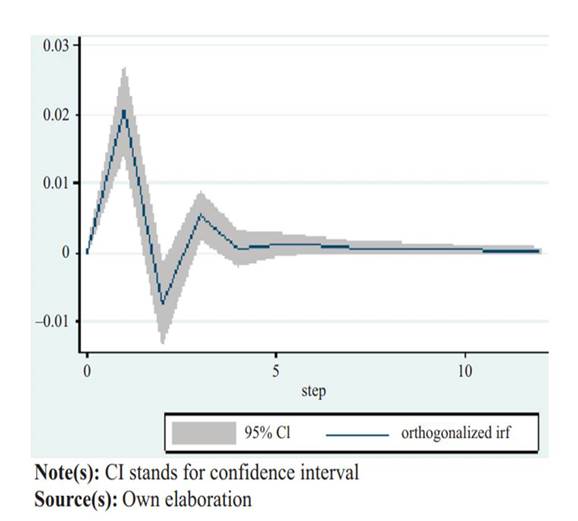
Appendix 2 shows the impulse response function graphs to analyse how shocks on premiums or discounts affect NAV returns. By and large, the graphs show mixed and somewhat inconclusive results. We found statistically significant evidence for seven funds that show that increases in premiums translate into positive impacts on RNAV. Following a premium shock, RNAVs increase and then return to their initial state. This type of behaviour is depicted in Figure 4 for the “Baillie Gifford Japan Trust (BGFD)”.
One of the funds presents an opposite behaviour since premium increases lead to NAV returns decreases. For the remaining 21 funds, we were unable to detect the direction of movement given the fact that impulse response functions turned out to be statistically insignificant.
In addition, our results in the two appendices point to the idea that NAV returns are less responsive to shocks than PX returns (evidence in this direction was also found by Frankel and Schmukler (2000)).
5. Discussion and conclusions
This paper analyses the predictive power of premiums (or discounts) on the future share price and net assets returns of a sample of closed-end funds. We find that premiums do have predictive power, and that this is stronger for share price returns than for NAV returns. In essence, we find that the market can anticipate future behaviour because growing premiums forecast declining share price returns for one or two periods ahead. Furthermore, we find that the power of the market to anticipate NAV returns, although weak, is far from inexistent. In this regard, we observe that (with a 5% significance level) in more than 24% of the funds, growing premiums forecast higher NAV returns one or two months ahead. This finding warrants further research since one would expect NAV returns to be more closely related to the performance of the assets that the fund holds than to the fund’s share price performance.
All in all, our results are broadly consistent with the idea of a certain degree of inefficiency in the CEF market because returns are somewhat predictable using information contained in the premiums or discounts. From a rational standpoint deviations from fundamental value capture information on the different types of risks an investor faces, such as direct and indirect investment barriers, capital controls, political and liquidity risk, macroeconomic instability, and information asymmetries between local and foreign investors. Nevertheless, deviations from fundamental value can also be related to behavioural factors such as the existence of non-informed or noise traders that impound a higher level of risk in the CEF market. We leave the interesting issue of distinguishing which type of risk is priced (whether rational or behavioural) for closed-end country funds and including transaction costs in our analyses. In addition to this, implementing a generalized method of moments (GMM) estimation approach (as in Mroua and Trabelsi, 2020) is also in our research agenda. Other worthwhile future research endeavours include the disentanglement of the effect of the 2008 global financial crisis in our results, and like Levy-Yeyati and Ubide (2000), an examination of the divergence of share price and NAVs during crises.
Notes
1. Fletcher (2018) takes the perspective of a UK investor and finds that when short selling is allowed, significant diversification benefits rise when including international CEFs in the opportunity set. When short selling is not possible, the diversification benefits of CEFs fall sharply.
2. Nonetheless, Enders (2014) argues that there is debate whether variables in a VAR model should be stationary or not.