


 Inglês (pdf)
 Artigo em XML
 Referências do artigo
 Enviar este artigo por email
 Citado por SciELO
  Similares em
SciELO
Similares em
SciELO 
 Permalink
Introduction
The stock markets are crucial in the optimal allocation and mobilization of financial resources to support economic activities (Carp, 2012). In the past, the stock markets were adversely affected by several financial crises (Bouri, 2015; Umar et al., 2021b), and investors suffered massive losses. Investors are always searching for alternate assets/safe haven that can diversify the risk of stocks portfolios during crises episodes. Gold is considered as the safehaven investment against the equities during the huge uncertainty phases of the markets (Baur and McDermott, 2010). Therefore, it is important to examine the gold-stock nexus during the crisis’s episodes to provide valuable insights to the investors and portfolio managers regarding diversification opportunities, hedging and portfolio allocation (Arouri et al., 2015).
Our research intends to investigate the mean and volatility links across gold assets and rising Latin American (LA) equity markets during various sample periods, including the fullsample period, the US financial crisis (UFC) and the Chinese equity market crash (CSMC). These linkages answer the important research question of whether gold can diversify the equity risk of LA equity markets during different sample periods. This study also computes the optimal portfolio-weights and hedge-ratios for gold and stock-based portfolios to provide information about optimal portfolio allocation, downside risk reduction and hedging during the crisis periods (Hammoudeh et al., 2014; Andreasson et al., 2016).
Several studies have explored the gold-stock nexus during the UFC (Arouri et al., 2015; Junttila et al., 2018; Yousaf et al., 2020a, 2021); however, studies are scant in the context of CSMC. The Chinese equity market crashed in 2015 (Han and Liang, 2017; Yousaf and Hassan, 2019), the CSI-300 index dropped 34% in just 20 days at the start of the crisis. The Chinese equity market lost around 50% of the pre-crash market value and affected many emerging markets, including the emerging LA equity markets (1). Trade and financial integration are directly associated with each other, and China is the major trading partner of LA economies, therefore the CSMC can influence the LA equity markets (Mata and Mora, 2016; Yousaf et al., 2020b).
The contribution of the current study is threefold. Firstly, as per our best understanding and published evidence, it is the first research that examines the return and volatility spillover between gold and LA equity markets during crisis periods, especially in the CSMC. However, literature provides the evidence of various studies that examines return/volatility transmission between world stock markets and gold (Badshah et al., 2013; Arouri et al., 2015; Gao and Zhang, 2016; Balcilar et al., 2018; Kang and Yoon, 2019; Jiang et al., 2019; Akkoc and Civcir, 2019; Adewuyi et al., 2019). Because none of the aforementioned research investigates the return/volatility relationships between gold and LA equity markets during the CSMC, therefore this study fills this literature gap.
Second, we estimate the spillovers employing the VAR-BEKK-GARCH model. This model is utilized in different studies for the analysis of return and volatility spillovers (Chen et al., 2020; Yu et al., 2020; Ahmed and Huo, 2021). Several studies also use the Wavelet approach and Diebold and Yilmaz approach for spillovers analysis (Umar et al., 2021a, Umar et al., 2021c; Al-Yahyaee et al., 2019). The competitive models (i.e. DCC-GARCH and VAR-GARCH) suffer from convergence issues (Zhang and Choudhry, 2017; Yousaf and Ali, 2021). Moreover, the VARBEKK-GARCH model can estimate the conditional volatilities, covariances, time-varying correlation, which are utilized to compute hedge ratios using optimal weights. Finally, this research also augments the literature by providing the hedge ratios and optimal weights for the gold-stock pairs. The remainder of the paper is structured as follows: Section 2 describes the data and methodology. Section 3 provides the findings of this study. Finally, Section 4 concludes the whole research.
2. Literature review
A large amount of research has been conducted around the world to study the gold-stock nexus. Smith (2001) investigates the link between gold and the US equity market and reports a significant unidirectional causal impact from US equity returns to gold returns. Lawrence (2003) investigates the association between S&P 500 index, gold and other commodities. He finds that gold returns are weakly associated with S&P 500 returns as compared to the association between S&P 500 and other commodities. Mishra et al. (2010) investigate the volatility of gold price and Indian equity market returns and confirm a bidirectional relationship. Choi and Hammoudeh (2010) empirically find that gold and S&P 500 index have a very low correlation.
Miyazaki and Hamori (2013) study the links between the equity and gold markets. They find that unidirectional return spillover from equity to gold but report no evidence of volatility spillover between equity to the gold market. Before the crisis, bidirectional causality exists while unidirectional causality in mean and variance exists from equity to gold market after the crisis. In addition to that, Thuraisamy et al. (2013) examine the volatility spillover effect between fourteen Asian equity markets to the two commodities gold futures and crude oil markets. The study finds that spillover results of mature and immature markets are different from each other. In mature markets like Japan, volatility effects are transmitted to gold future and crude oil markets from the Japanese equity market. In comparison, the volatility effects are transferred from commodity futures to the equity markets in immature economies. Moreover, there is a presence of a bidirectional volatility transmission during the financial crisis.
During the global financial crisis, Arouri et al. (2015) discover a strong presence of return and volatility spillovers between gold and Chinese equity markets. While studying the relationship between gold and stock price of BRICS economies, Raza et al. (2016) confirm that the contribution of gold prices to the equity returns is positive. Furthermore, they argued that the relationship is negative for gold and equity markets of Malaysia, Chile, Thailand, Indonesia and Mexico. In line with the studies mentioned above, Bekiros et al. (2017) confirm the diversifier role of gold for BRICS stock markets.
Vardar et al. (2018) confirm that volatility is transmitted from developed and emerging equity markets to the gold market. Moreover, Shakil et al. (2018), through an autoregressive distributed lag model (ARDL), discovered that gold is useful as a portfolio hedge because it is not affected by the consumer price index. They found that external factors as the financial crisis may be harmful to the consumer price index. Thus, adding a percentage of gold to the investment portfolio may reduce the risk level. Using data from the Turkish equity market, Akkoc and Civcir (2019) discovered a significant unidirectional volatility transmission from gold and oil. Al-Yahyaee et al. (2019) find that the precious metals provide more diversification opportunities against the GCC stocks than the energy markets. While studying the Indian equity market, Maitra and Dawar (2019) report that the unidirectional return spillover from the commodity to the Indian equity market. Singhal et al. (2019) find that international gold prices have a substantial positive impact on Mexican equity prices.
Yamaka and Maneejuk (2020) find a stronger integration between gold and Asian stocks markets during the UFC than pre- and post-crisis. While examining the quantile connectedness between BRICS equity markets and gold, Naeem et al. (2020) confirm the diversifier role of gold against the BRICS equity markets. He et al. (2020) look at the linkages between gold and the US and the China equity markets and report that the US and Chinese equity markets are the net recipients of volatility effects from the gold market. Moreover, the gold market volatility positively (negatively) influences the volatility of the US (China).
Morema and Bonga-Bonga (2020) provide evidence of bidirectional volatility spillover between South African equity markets, gold and oil. Hung and Vo (2021) report the strong connectedness between oil, gold and equity markets during COVID-19 compared to the prepandemic period. Mensi et al. (2021) investigate the asymmetric spillovers between the oil, gold and Chinese equity market and find that the negative return spillover dominates the positive return spillovers. Moreover, the connectedness between these markets varies during UFC, oil-price crash and the pandemic period. According to the aforementioned literature, none of the studies have explored the return and volatility transmissions between the gold and LA equity markets during crises; consequently, this study substantially contributes to the current body of knowledge by filling up the gaps described above.
3. Data and methodology
3.1 Data
To examine the gold-stock nexus, this study uses daily data from January 2000 to June 2018. Following MSCI emerging market index, this study sample consisted of four emerging LA equity markets: Brazil, Mexico, Chile and Peru. The data is further divided into two subsamples (1) the UFC - which starts in August 2007 and ends in July 2010) and (2) the CSMC - which starts in June 2015 and ends in May 2018. The three-year span is used for each crisis, as used by Yousaf and Hassan (2019). On non-trading days, the index value is assumed to be the same as the previous trading day. The data pertaining to equity indices have been extracted from the Data Stream database. To examine spillover between gold and equity returns, the data of daily London gold spot prices (in the US dollars per troy ounce) has been taken from the London Bullion Market Association homepage (Santillan Salgado et al., 2018).
3.2 Methodology
To estimate return and volatility spillover through the VAR-BEKK-GARCH model, the empirical method consists of two parts. In the first part, we use vector autoregression (VAR) for the estimations of return spillovers. In the second part, we apply the BEKK-GARCH model to estimate volatility spillovers, suggested by Engle and Kroner (1995). For return spillovers, below are the specifications of the condition mean equation:

R t = (R x t , R y t )’ is the vector of returns on the stock index (S) and gold (G) at time t, respectively. ∅is the 2 3 2 matrix of parameters, which estimate the impact of own lagged and cross return spillovers between S and G series. e t =(e S t , e G t ) is the vector of error terms of the mean equations for S and G series at time t. ηt = (η S t , η G t )’ 0 indicates a sequence of identically and independently distributed random errors.
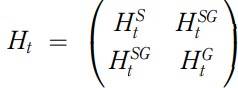
indicates the variance- covariance matrix of the S and G return series. Besides, Ht 1/2 is the 2 X 2 symmetric positive definite matrix.
For volatility spillovers, the full BEKK-GARCH (1,1) is employed, which requires positive definiteness restrictions for Ht; is given by:

here C is a lower triangular matrix, whereas theA, B and D are the square-matrices, described as follows:
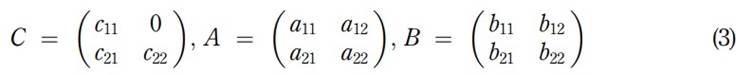
In the above equation, the order of variables is the Stock (1) and Gold (2) for our analysis. The ARCH and GARCH effects are represented by the matrix A and B, respectively. More specifically, a12 means that the shock spillover from equity to gold market, and b12 indicates the volatility transmission from the equity to the gold market.
The output of the VAR-BEKK-GARCH model is used to compute the optimal portfolio weights and the subsequent hedge ratios. Consistent with the study of Kroner and Ng (1998) the optimal portfolio weight of stock (S) and gold (G) is computed as follows:
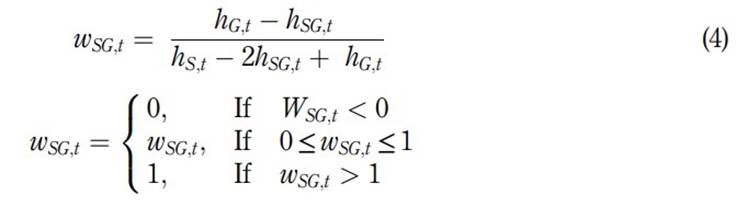
Considering $1 portfolio of stock and gold, wSG;t represents the weight of stock and 1−wSG;t is the weight of gold. hsg;t represents the conditional covariance between equity and gold, hs;t and hg;t indicate the conditional variance of equity and gold, respectively. Following specifications are used to estimate hedge ratio, proposed by Kroner and Sultan (1993):
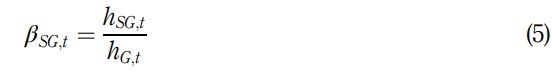
β sg;t de notes the hedge ratio. A long position in stock can be hedged with a short position in the gold assets.
4. Empirical results
4.1 Descriptive analysis
Table 1 shows the full-sample descriptive statistics of gold and equity indices. The complete sample period results reveal that the mean return of the Peru (Mexico) equity market is the highest (lowest). The standard deviation of returns is the highest (lowest) for Brazil (Chile) equity market. The Chile and Peru equity markets provide reasonable returns with comparatively lower risks. Furthermore, the outcome also discloses that the Skewness of all indices is negative, and kurtosis is above 3. Based on Jarque-Bera statistics, the normality hypothesis cannot be rejected for all series. Moreover, the finding provides evidence of the presence of autocorrelation for all series. Lastly, all series exhibit strong evidence of the ARCH effect; therefore, we can apply GARCH models. To ascertain the stationarity of the series, the Augmented Dickey-Fuller (ADF) test and Phillip-Perron test are applied, and results of the unit root test are reported in Table 2. Each test is applied three times, with “no constant and trend”, “constant” and “constant and trend”. The findings depict that all series are significant while applying ADF and Phillip-Perron test; thus, there is no evidence of stationarity in any series.
Table 1 Summary statis
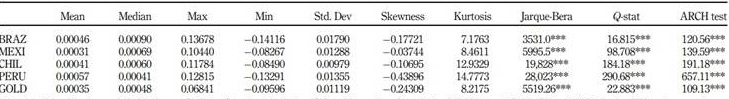
Note(s): Note(s): “Max-Maximum, Min-Minimum, Std. Dev-Standard deviation, Q Stat-Ljung–Box Q statistics. BRAZ, Brazil; CHIL, Chile; MEXI, Mexico. Values in parentheses are the p-values. *** indicate the statistical significance at 10% respectively”
Source(s): Own elaboration
Table 2 Unit root tests
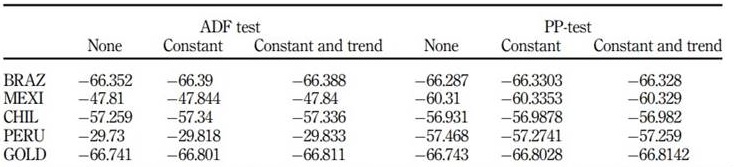
Note(s): “ADF-Augmented Dickey–Fuller test. PP test-Phillips–Perron test. BRAZ, Brazil; CHIL, Chile; MEXI, Mexico”
Source(s): Own elaboration
4.2 Results of spillover b/w gold assets and Latin American equity markets
4.2.1 Full-sample results.
Table 3 shows the results of the spillovers between gold and LA equity markets. The lagged returns are significant in Chile, Mexico and Peru equity markets, implying that the historical returns help determine the current returns in these three markets. As far as the gold market is concerned, past returns do not influence the current returns. The outcome reveals unidirectional return spillover from Brazil, Chile and Peru equity markets to the gold market.
Table 3 Estimates of bivariate VAR-BEKK-GARCH for gold assets and Latin American markets during full sample period
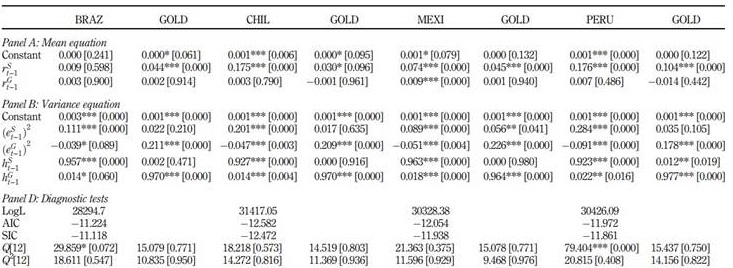
Note(s): “AIC and SIC criteria are used to identify the number of lags for VAR.Q(12) and Q2(12) are the Ljung–Box Q statistics of order 12 for autocorrelation applied to the standardized and squared standardized residuals respectively. BRAZ, Brazil; CHIL, Chile; MEXI, Mexico. For brevity, one constant coefficient of variance equation is not reported. p-values are shown in the parentheses. * , **, *** indicate the statistical significance at 1, 5 and 10% respectively"
Source(s): Own elaboration
Refer to the variance equation, the lagged shocks and volatility have a significant influence on the recent conditional volatility, and results are consistent across all indices. The impact of the series own past volatility is higher than that of series own past shocks in equity markets of LA, suggesting that past volatility is a more important predictor of the current volatility in equity markets. Furthermore, the past own shocks and volatility of gold have a significant impact on its conditional volatility. In addition to that, the lagged shocks of the gold market significantly and negatively affect all equity markets. Interestingly, the past shocks of the Mexican equity market also influence the volatility of gold markets. It proposes that the past shocks of Mexico are important in forecasting the gold market. The results confirm unidirectional volatility spillover from the gold to Chile, Brazil and Mexico stock markets, suggesting that the gold market volatility is useful in forecasting the volatility of Brazil, Chile and Mexico equity markets. However, the bidirectional volatility transmission is observed between gold and the Peru equity markets, proposing that both markets are highly connected, and their portfolio provides no diversification.
4.2.2 US financial crisis period results.
For the sample period of UFC, the results of returns and volatility linkages are reported in Table 4. The past returns of Chile and Peru significantly influence their current returns, showing the forecasting power of Chile and Peru’s past returns. In contrast, the lagged gold returns do not affect the current gold returns. The result reports unidirectional return spillover from the Brazil and Peru equity markets to the gold market, suggesting that these equity markets are useful in forecasting the gold market.
Table 4 Estimates of bivariate VAR-BEKK-GARCH for gold assets and Latin American equity markets during US financial crisis
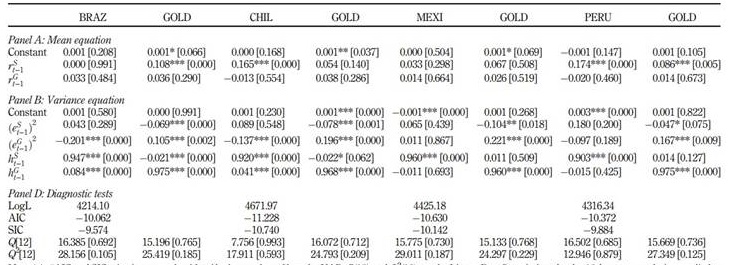
Note(s): “AIC and SIC criteria are used to identify the number of lags for VAR. Q(12) and Q2(12) are the Ljung–Box Q statistics of order 12 for autocorrelation applied to the standardized and squared standardized residuals respectively. BRAZ, Brazil; CHIL, Chile; MEXI, Mexico. For brevity, one constant coefficient of variance equation is not reported. p-values are shown in the parentheses. * , **, *** indicate the statistical significance at 1, 5 and 10% respectively”
Source(s): Own elaboration
The lagged volatility(shocks) has a (in)significant effect on the contemporaneous volatility in the equity markets, and the findings are consistent across all equity indices, suggesting that the past volatility of LA equity markets is an important determinant of their current volatility. In contrast, the current volatility of gold is significantly influenced by its lagged shocks and volatility, suggesting that past shocks and volatility are significant in determining the current volatility of the gold market during the UFC. The results indicate bidirectional volatility transmission between equity markets of Brazil and Chile and the gold, therefore highlighting that the portfolios of gold and these two equity markets provide no opportunities for diversifications. However, the volatility linkages are not significant between the gold and equity markets of Mexico and Peru. The findings outline that the maximum benefits of diversification can be derived by adding gold in the undiversified portfolios of Mexico and Peru during the UFC.
4.2.3 Chinese equity market crash results. Table 5 displays the results of return and volatility linkages between gold and LA equity markets in the CSMC. Their past returns have a significant influence on the current returns of Peru, Chile and Mexico equity markets. In contrast, the lagged gold returns are not significant, indicating that past returns of gold are not useful in forecasting current gold returns. The cross-market return spillover is unidirectional only from gold to the Mexican equity market, suggesting that returns of the Mexican equity market can be predicted using the gold market during the CSMC.
Table 5 Estimates of bivariate VAR-BEKK-GARCH for gold assets and Latin American equity markets during Chinese equity market crash
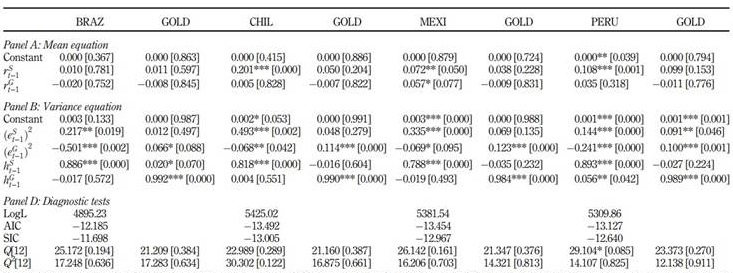
Note(s): “The number of lags for VAR is decided using AIC and SIC criteria. The Ljung–Box Q statistics of order 12 for autocorrelation are represented by Q(12) and Q2(12) and are applied to the standardized and squared standardized residuals respectively. BRAZ, Brazil; CHIL, Chile; MEXI, Mexico. For brevity, one constant coefficient 7of variance equation is not reported. p-values are shown in the parentheses. Statistical significance at 1, 5 and 10% is indicated by * , **, *** respectively"
Source(s): Own elaboration
Refers to the variance equation, past shocks and volatility have a significant effect on the current volatility in all the equity markets. Additionally, current conditional volatility is also influenced by past volatility and shock in the gold market. The findings of the research signify the important role of past volatility as the determinant of current volatility during the CSMC. The cross-market shock spillover is unidirectional from the gold to Brazil, Chile and Mexico equity markets, whereas bidirectional between the gold and Peru equity market during the CSMC. The cross-market volatility spillover is unidirectional from Brazil to gold, and gold to Peru during the CSMC. Moreover, the volatility linkages are not significant between the gold and equity markets of Chile and Mexico, therefore investors are suggested to add gold in their equity portfolios of Chile and Mexico during the CSMC in order to obtain maximum benefits of diversification.
4.3 Optimal weights and hedge ratios Hedge ratios and optimal weights across all pairs are reported in Table 6. In the full-sample period, for BRAZ/GOLD(CHIL/GOLD) pair, the optimal weight is 0.29(0.59), indicating that, for a $1 portfolio, investors should invest 29(59) cents in the Brazilian (Chile) equity market and the remaining amount in gold. For the pairs of MEXI/GOLD and PERU/GOLD, it is suggested to allocate 48 cents in the Mexico and Peru equity markets and the remaining 52 cents in the gold market during the full-sample period.
Table 6 Optimal weights and hedge ratios for the Latin American equity markets and gold
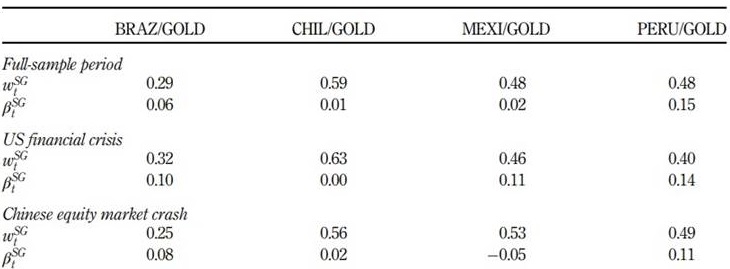
Note(s): wSG t and βSG t indicates the optimal weights and optimal hedge ratios respectively
Source(s): Own elaboration
The optimal weights for BRAZ/GOLD and CHIL/GOLD pairs are higher during the UFC than CSMC. For the gold-stock portfolio, it is suggested that investors decrease (increase) the weight of gold for the equity portfolios of Brazil and Chile during the UFC (the CSMC). In contrast, the optimal weights are higher for the MEXI/GOLD and PERU/GOLD pairs during the CSMC compared to the UFC, proposing that, for the portfolio of gold-stock, the portfolio managers increase (decrease) the weight of gold during the UFC (the CSMC).
For the full-sample, the hedge ratio is 0.06 for the BRAZ/GOLD pair, suggesting that a $1 long position in Brazilian stocks can be hedged with the short position of 6 cents in the gold during the full-sample period. During the full-sample period and the UFC, the lowest hedging ratio is observed in the pair of CHIL/GOLD, therefore the cheapest hedging strategy is the CHIL/GOLD. However, the highest hedging ratio is reported for the PERU/GOLD pair, therefore the expensive hedging strategy is the PERU/GOLD during the full-sample period and the UFC. In contrast, during the CSMC, the cheapest hedging strategy is the MEXI/GOLD and the expensive hedging strategy is the PERU/GOLD. Overall, these optimal weights and hedge ratios vary across the sample periods, requiring investors to adjust their portfolio allocation and hedging strategy, specifically during the crisis period to get maximum benefits from their portfolios of gold and LA equity markets.
5. Conclusion
The current study attempts to analyze the mean and volatility linkages across the gold market and the LA equity markets. Apart from full-sample analysis, we further split the data into two different subsamples: the CSMC and the UFC. The optimal portfolio weights and hedge ratios are also computed for the gold market and stock markets.
The results show that the return spillovers for gold-stock pairs vary across stock markets and crisis periods. The cross-market volatility transmission is unidirectional from Brazil, Chile and Mexico to the gold market, whereas bidirectional between the gold and Peru stock market during the full-sample period. During the UFC, the volatility transmission is bidirectional between the gold and stock markets of Brazil and Chile, suggesting that the portfolios of gold and these two equity markets provide no opportunities for diversifications. However, the volatility linkages are not significant between the gold and equity markets of Mexico and Peru, suggesting the addition of add gold in the undiversified portfolios of Mexico and Peru stocks to get the maximum benefit of diversification during the UFC. During the Chinese crash, the volatility spillover is unidirectional from Brazil to gold, and gold to Peru, whereas the volatility spillovers are not significant between gold and stock markets of Chile and Mexico, suggesting that investors can diversify their portfolio of Chile and Mexico stocks by adding gold during the Chinese crash.
Overall, the optimal weights suggest that, for the gold and LA equity-based portfolios, investors must allocate at least one-third of their investment in gold, irrespective of any sample period. Based on optimal weights, it is suggested that investors should decrease (increase) their investment in gold for the equity portfolios of Brazil and Chile during the UFC (the Chinese crash). For the portfolio of gold stock, the portfolio managers should increase (decrease) their investment in the gold for the equity portfolios of Peru and Mexico during the UFC (the Chinese crash). Refers to the hedging ratios, the cheapest hedging strategy is CHIL/ GOLD during the full-sample period and the UFC. In contrast, the cheapest hedging strategy is MEXI/GOLD during the Chinese crash.
Based on spillovers results, we provide valuable information to portfolio managers and investors regarding the diversification opportunities. Moreover, the optimal weights suggest the portfolio allocation to investors and portfolio managers. We inform the investors about the cheapest hedging strategies during the different financial crises. Finally, the significant spillover from gold to the stock market provides useful information to policymakers regarding formulating policies in such a way that can make the local market resilient to shock from the outside (gold) markets. Overall, these findings provide useful insights to portfolio managers, investors and policymakers regarding portfolio diversification, asset allocation, asset pricing, hedging and risk management, especially during a crisis.
For future studies, we suggest the investigation of the spillover between the gold and the Latin American Integrated Market (MILA), relevant stock market studied due to the Pacific Alliance (Vergara Garavito and Chion, 2021). Moreover, these spillovers between gold and MILA, due to the Pacific Alliance development can be compared with the spillover between gold and Brazil. Apart from this, our study just focuses on the UFC and the CSMC, therefore it is also suggested to examine these spillovers during the COVID-19 pandemic.
Note 1.
https://money.cnn.com/2015/07/09/news/economy/warning-sign-latin-america-economy/index.html

