


 Inglés (pdf)
 Articulo en XML
 Referencias del artículo
 Enviar articulo por email
 Citado por SciELO
  Similares en
SciELO
Similares en
SciELO 
 Permalink
Introduction
Stock markets attract the attention of economists, financiers and rulers around the world due to the benefits that their activity provides to the real economy because they serve as an instrument for mobilizing savings toward investment and as a mechanism for allocating resources in the economy (Gupta-Bhattacharya et al., 2014). Within the stock market, investment in equity assets stands out for the possibility of achieving a return higher than most investments in the market while companies are allowed to resort to financing sources with lower cost (Ibrahim, 2011). Equity assets are characterized by a high level of volatility in their returns which makes them difficult to forecast. This is how numerous studies have concluded that the prediction of prices for this type of asset is a very difficult task to achieve due to the characteristics of nonlinearity and non-stationarity of prices (Farias et al., 2017). This means that historical volatility does not have a constant relationship with the so-called implied volatility that tries to determine the variability of the price of the asset in the future (Narwal et al., 2018).
There are two general strategies for equity assets investment analysis: fundamental analysis and traditional technical analysis (henceforth referred to as TA). These strategies have very different approaches and are generally considered independently. However, despite their differences, they have the common purpose of trying to predict prices and returns on assets. Fundamental analysis focuses on the study of the intrinsic value of the assets based on the establishment of the value of the underlying companies, for which it considers the study of all the elements of the economy, the industry and the company in particular (Kumar et al., 2013). The profitability of this strategy is achieved by holding the portfolio and the liquidation of assets when they reach the expected valuation level, which occurs when the market price approaches its intrinsic value. On the other hand, TA uses historical data of the prices and the volumes traded to find signs that indicate the possible future behavior of the price to obtain returns through the holding of assets for short periods of time (usually assets characterized by a high level of volatility) to take advantage of sudden rises or falls in the price (Murphy, 1999).
On the other hand, TA directs its interest in trying to identify patterns in historical prices that allow predicting possible behaviors in the short term under the premise that, any aspect that may have an impact on the price either of the company, the market, the economy, or the political situations or psychological aspects of investors, has already been incorporated into it. The categories TA is divided into are graphical analysis and analysis through indicators, which are used by investors individually or jointly to make decisions about the position to be assumed with an asset at a given time. Graphical analysis is oriented toward the study of the figures that trace historical price data and, therefore, the effort of the analysts is focused on finding and interpreting those forms to determine patterns that show the expected behavior in the immediate future (Anggono and Herlanto, 2019).
For many studious scholars in financial markets, TA has evolved in recent years moving from graphic analysis with predominance on visual interpretation and high subjectivity load, to the use of sophisticated statistical and computational tools (Metghalchi and Garza, 2013). These advanced analysis tools include moving averages, the relative strength index (RSI), Bollinger bands (BB), the moving average convergence/divergence (MACD), the stochastic process and momentum indicators, as well as another important number of indicators (Gold, 2015) which help to analyze the momentum of the price trend to identify weaknesses that indicate a possible change in the trend into the future. Among the different indicators of TA, one of the most used by traders worldwide is the MACD (Agudelo Aguirre et al., 2020). MACD is constructed by three lines: one is the so-called MACD line, which is calculated as a difference of two exponential moving averages (EMAs) of the price of the asset with a standard data number of 26 and 12, a second line that conforms to the EMA of nine MACD line data and a third fixed horizontal line with the value of zero (Ivanovski et al., 2017). Although these parameters are used in general for the construction of the indicator to be applied in different types of investment, there are studies such as the one carried out by Wang and Kim (2018) that determine that the validity and sensitivity of the MACD have a strong relationship with the selection of the parameters which could produce a higher or a lower return, depending on the behavior of the asset pricing.
In recent years, in addition to the traditional TA (referred hereto as the analysis performed under typical parameter values, as discussed later in this study, and under non-automatization or any other computerized mean), some parallel approaches have taken importance in the financial analysis of investments in the stock market. This is how computational tools have been applied to the TA using indicators to achieve greater efficiency and objectivity in the analysis. Among the most notable computational tools used for analysis are genetic algorithms (GA) (Holland, 1975), neural networks, diffuse logic and Markov. The need to resort to computational models is due to the nonlinearity and complexity of the financial system, which is composed of a series of interrelated subsystems and exposed to various particular and systemic risks. Therefore, in comparison to deterministic models, the application of computational models has facilitated the design and implementation of investment strategies and has allowed greater efficiency in results (Dubinskas and Urbsiene, 2017).
The line of research followed in this study was focused on the application of GA into a technical setup for improved returns from investment (compared to other traditional analyses namely TA and B&H). GA belongs to, along with evolutionary programming, evolutionary strategies and genetic programming (GP), the four historical paradigms of evolutionary computation (Abdel-Basset et al., 2018). All these methods are classified as metaphor-based metaheuristics, that is, algorithms that simulate natural phenomena such as biological evolution, human behavior, etc. (Abdel-Basset et al., 2018). Into the context of artificial intelligence, heuristic refers to those aspects dealing with the use of knowledge for portraying the dynamic performance of tasks. In other words, it is said heuristic to refer to an intelligent method for doing a task, which is not resulting from rigorous and exhaustive analysis, but from the expertise about that specific task (Sorensen, 2015).
GA mimics the natural evolution by an efficient exploration of the search space under presumptions of survival of the fittest to find increasingly fitter and better-adapted individuals (Jacobsen and Kanber, 2016). During this process, the most fitting individuals to renovate the population are crossed and those least fitted are then eliminated. At the end of the process, the solution to the optimization problem is found to be the most apt (fittest) chromosome (Metaxiotis and Psarras, 2004). GA is particularly helpful to solve problems when they are constantly changing, and requiring an adaptive solution, as occurs for prices in stock markets. When looking at stock prices, accurate predictions can be a challenging task as a result of its high variability across time. An algorithm built for accurate stock market predictions might work accurately on doing so one week, but might not make accurate predictions the following one, as a result of the forever shifting patterns and trends (Jacobsen and Kanber, 2016). The purpose of this study is to determine whether the use of GA, applied to the investment strategy of TA through the MACD indicator, allows achieving higher yields to those that would be obtained through the use of the same technical indicator applied under traditional methods and, at the same time, determining if it is possible to exceed the return that would be obtained with the B&H investment strategy.
2. Literature review
Neural network methods are generally regarded as forming the first wave of a breakthrough in machine learning since the 1980s (Hsieh, 2009). Forecasting of the NASDAQ stock exchange rate has been studied applying artificial intelligent systems. Moghaddam et al. (2016) investigated the daily NASDAQ rate by artificial neural networks (ANN) on short-term historical stock prices and the day of the week as inputs. The constructed model used a multilayer perceptron (MLP) network with 20-40-20 neurons, and the historical data were split into three subsets (training set 60%, validation set 20% and testing set 20%). In the study, sixteen networks with different architectures were generated, trained and tested. Regression coefficients of training and validation sets, as well as total data, were calculated and only the coefficient value of validation was considered for the selection of the optimized architecture of the network. Their results showed that optimized networks from historical datasets into an ANN approach, is possible with reasonable prediction abilities.
Rosillo et al. (2013) carried out an investment study on Telefonica shares of the Madrid Stock Exchange applying GA to MACD, RSI, momentum and stochastic indicators during different time ranges between 1986 and 2009 and obtaining diverse returns with the use of each indicator. In the case of MACD, measurements were made in eight periods of time with results between ()38.66% and (þ)34.42%, whose final consolidation reached 2.48% per year, a positive but not very significant figure considering the estimated period of time. GAbased approaches through the use of MACD indicator have also been applied to transactions of oil futures.
Performance of other common indicators such as RSI has also been studied along with MACD into GA-based schemes. Terence et al. (2014) conducted a study with the application of GA through the MACD and RSI indicators with data from some of the world’s leading indices (Milan Comit General, DAX -Deutscher Aktien Index-, S&P 500, Dow Jones Industrial -DJI- and Nikkei 225). The results were satisfactory in the Milan and S&P 500 indices, achieving higher yields than the B&H strategy with a remarkable return of 1.39% for ten days in the Milan index, and with unsatisfactory results in the other indices, especially in the DAX, where a negative return of 0.944% was obtained, compared with the return of 0.249% under the B&H strategy during the same period. These two indicators were also studied into a neural network framework for stock prediction by Sezer et al. (2017). The authors proposed a neural networkbased stock price prediction and trading system using RSI and MACD to predict Dow Jones 30 Stocks. The study indicated that selection of the most appropriate technical indicators and by the neural network modeling, in most of the cases, can be achieved comparable results against the B&H strategy. Additionally, the study revealed that the overall trading performance could be enhanced by fine-tuning the technical indicators and/or optimization strategy.
Agudelo Aguirre et al. (2020) studied a GA-based strategy involving the MACD indicator for the investment of variable income assets. The GA strategy was performed on two different validation periods and searched for optima parameter values of buy/sell signals. The findings suggested that a higher return on investment compared to TA and B&H (>4%) is possible by optimizing parameters from implemented GA into the TA.
As shown in this section, an ever-increasing body of literature shows that the incorporation of metaheuristics and particular GA for the reliable prediction of indices in stock markets is a promising undertaking. Overall, this review emphasizes on the potential economic benefits (increased returns) resulting from the inclusion of an automated trading strategy based on GA coupled with the most popular technical indicators such as MACD. Optima parameters derived from optimization algorithms documented in the literature review support our conviction that a comparable approach based on GA and applied to investments in variable income may result in return-rewarding and establish an effective alternative for addressing this type of investment against traditional approaches of technical analysis and B&H.
3. Methodology
To carry out the comparative analysis under a TA strategy and GA, the acquisition of 1.000 units of the asset is considered for each of the cases, at the market price on the date of the first signal. Henceforth, the admissible sell and buy signals are made according to the signals received at the market prices on each of the corresponding dates (for buys in each case the investment of the total accumulated value has been considered, as a result of the previous sell of the asset. This until reaching the last sell signal when the investment value is settled to determine the gain (in monetary units) and the percentage return both, in nominal terms during the time the investment was made and in an annual effective rate. In the case of analysis of the investment under the B&H strategy, the investment in 1.000 asset units has also been assumed but only one buy date and one sell date have been considered. These corresponded to the date on which the first buy signal and the last sell signal were received regardless of whether these signals were received under the TA strategy or GA.
The TA strategy has been carried out under a visual graphic analysis applying the standard oscillator parameters (26, 12 and 9 data for the corresponding moving averages) while for the GA strategy, the purpose has been defined as finding construction parameters for the MACD indices that offer better adjustment and allow achieving the highest possible return on investment. For the analysis of GA and TA, market order parameters known as stop loss and take profit were also considered which, combined with the buy and sell signals generated by the oscillator, contributed to greater efficiency in the results.
3.1 Data
The NASDAQ stock indices (NASDAQ Composite) were used to develop this study. Researchers collected data through Thomson Reuters-Refinitiv Eikon Financial Service under license. The measurement of the closing price quotation, highest price and lowest price reached by the index daily, was delimited between 01-01-2013 and 12-31-2017. From the NASDAQ indices data quotation sample, 50% has been used to carry out the algorithm training process (between 1-01-2013 and 06-30-2015), while the remaining 50% of the data (between 07-1-2015 and 12-31-2017) has been used to advance in the validation process. For the genetic algorithm development, this study made use of the software Python (free software).
3.2 Construction of the standard MACD indicator
The standard MACD indicator, which applies to the TA investment strategy, followed the methodology according to Faijareon and Sornil (2019) and Redelinghuys (2019). The indicator was calculated from two lines, composed of EMA
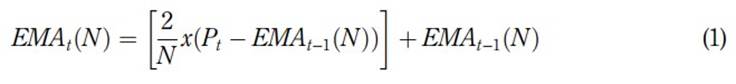
where EMAt is the EMA at time t, N is the number of data considered for the calculation of EMA and P is the price of the asset at time t.
One of these lines is called MACD line, built with the difference between two EMAs of 12 and 26 historical quotation data of the analyzed financial asset:
MACD = EMA 12 - EMA 26 (2)
While the other line, called MACD signal, is constructed with the moving average of 9 data from the MACD line:
MACDsignal = EMA9 of MACD (3)
3.3 Application of GA to find the trading rules
The basic parameters considered for the development of this study have been based on the following elements, which are defined in the modeling process for each of the genes that make up the chromosome: θ1, θ2, SMAn (θ1 θ2) (number of data that make up the moving average of the MACD signal), LB and LS, and definition of automatic stop loss and take profit parameters to enter or exit the corresponding position.
The analysis was divided into two stages: the first stage of training and the second stage of validation, according to Bauto et al. (2018). For the first stage, 50% of the historical data of the financial asset analyzed was used, while the remaining 50% was used for the validation process, which allowed confirming whether the strategy addressed was appropriate to be used for predictive purposes on the behavior of the price (Zhang and Maringer, 2016). GA was developed considering the configuration of chromosomes composed of a total of 31 bits, distributed in 9 genes of varied magnitude, as reported by Agudelo Aguirre et al. (2020). The definition of each gen, as well as the general chromosome structure with the assembled genes are shown in Table 1. The genetic procedure followed in this study is shown in Figure 1, according to Fu et al. (2013) and Drezner and Drezner (2020).
4. Results
The trading rules found in the training stage for the buy and sell of the NASDAQ financial asset allowed a series of transactions to be made based on the signals received during the validation period (Table 2)
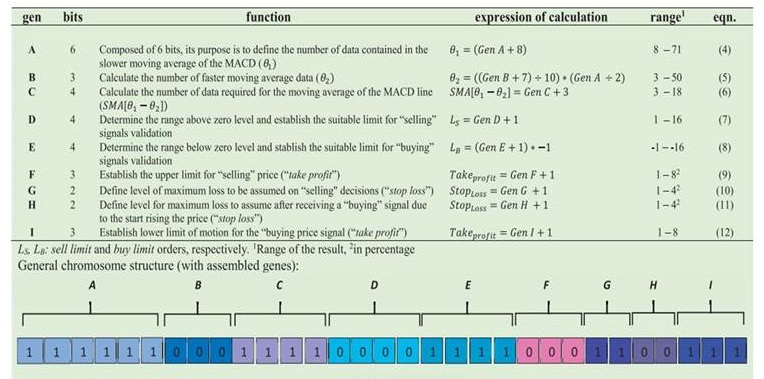
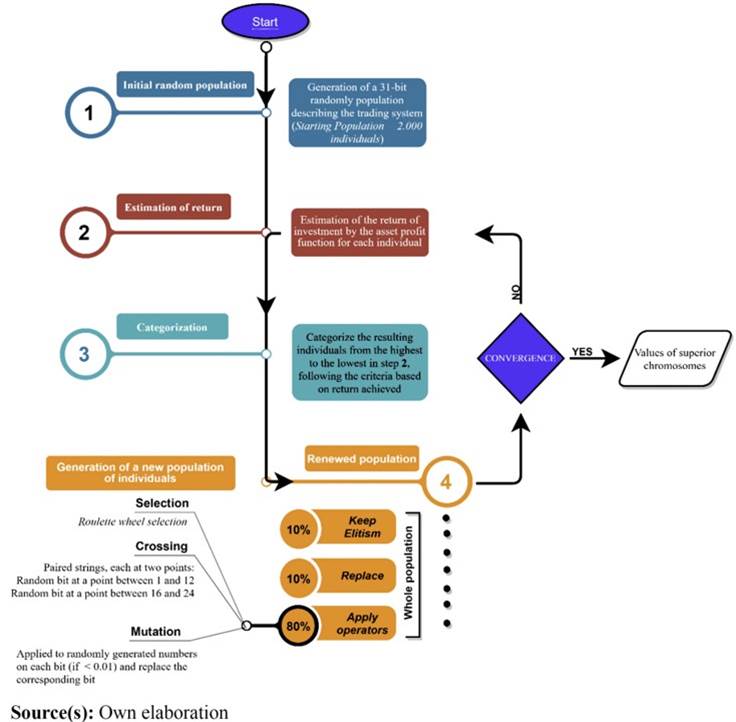
Table 2 Transactions for the GA approach and parameters defined as trading rules
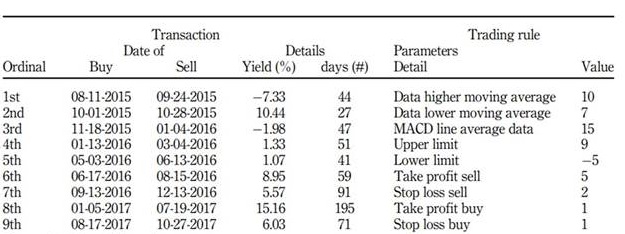
Source(s): Own elaboration
During the analysis period, nine (9) buy signals were received with their corresponding sell signals and different periods of investment tenure in time ranges between 27 and 195 days. The difference was also presented in the nominal yields of each of these holding ranges, showing values from 7.33%, to 15.16%. The trading rules found by GA during the training period are presented in Table 2.
Although the parameters of the traditional MACD indicator are only three, (higher moving, lower moving and MACD line, Table 2), the use of GA in this study allowed for obtaining two additional parameters, that is, the upper limit and lower limit (Table 2). These limits determined the validity or invalidity of the buy or sell signals that are received, giving greater security by eliminating signals when the price trend change is not yet very marked. The values of the two additional parameters, in this case, were upper limit equal to 9 and lower limit of 5, as shown in Table 2. These limits determined that a sell signal will only be considered as such when the crossing of the MACD lines and MACD signal above the value 9 of the indicator occurs, while a buy signal will only be valid when the crossing occurs at a lower point to the value 5.
The stop loss and take profit parameters (6-9 in Table 2) also contributed to achieving the results under GA, because they determine an additional range of movement to the price of the financial asset after receiving the corresponding buy or sell signals, which allows the possibility that the price of the financial asset falls up to 1% more after receiving a buy signal and before the transaction is completed, or that the price rises to 5% more, after receiving a sell signal and before completing the corresponding sale.
Figure 2 shows the results of the application of the three investment strategies simultaneously (TA, GA and B&H) during the period of validation of GA (between 07-01-2015 and 12-31-2017) from the trading rules found in the GA training period.
Figure 2 also shows that on 08-11-2015 the investment begins under the three analyzed strategies, with an equal amount of money for each of them (USD 5.036.790). When the investment is completed, on 10-27-2017, a higher cumulative value of GA (USD 7.658.339) is achieved compared to the other two investment strategies (USD 6.701.263 for the B&H strategy and USD 5.776.270 for the TA strategy), as shown in Figure 2.
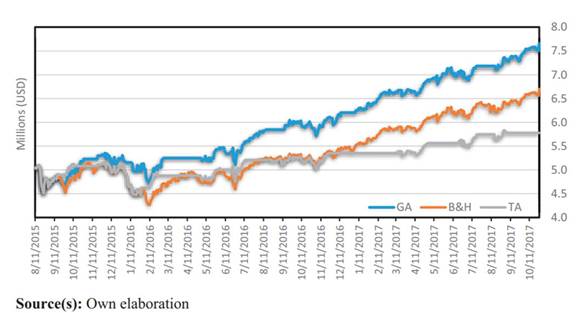
For GA and the TA strategy in some sections of the lines that reflect their trend, horizontal ranges are present where there is no valuation or devaluation of the investment, because it corresponds to the periods in which sell of the asset was made. The money from that sell is kept until a new buy is made to undergo fluctuations in the price of the asset reflected in the upward and downward movements of the accumulated value of the investment.
In general, as time progresses, the number of buying and selling transactions for GA and the TA strategy increases, which allows the accumulated value of the investment to differ from the trend of the B&H strategy. Similarly, the TA strategy presented a greater number of transactions (10 buy signals and 10 sell signals) concerning GA (9 buy signals and 9 sell signals). This because the TA strategy displayed greater sensitivity to upward movements and the fall in the price of the NASDAQ. This, in turn, causes that, with small increases in the price of the asset, sell signals are produced and additional valuations (achieved by the continuity of the increase), are not taken advantage of as happened on 11-25-2016 and 05-2- 2017 when sell signals were generated under the TA strategy. However, after slight falls, the price of the asset maintained its upward trend.
The initial value and the accumulated final value of the investment in each of the strategies are shown in Table 3, figures that lead to determining the nominal return during the period of analysis of each of them, as well as their equivalence in terms of annual effective rate, in order to have a comparable figure, not only among the three strategies analyzed but also with an investment in any other asset that can serve as a reference. Thus, 17.13% is
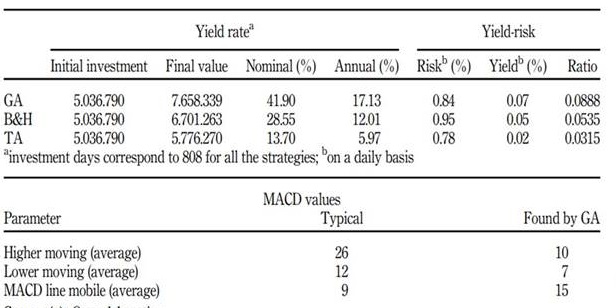
achieved for GA, a figure that exceeds B&H and TA strategies by more than 5 and 11%, respectively.
Although the parameter of greatest interest to an investor is the return on investment, either in cumulative value or in percentage terms, the analysis of the current financial investment requires simultaneous consideration of the return and risk assumed with each investment. For this reason, the yield/risk ratio is important as an approximation to the socalled Sharpe Ratio, which determines the reward the investor receives for the risk he or she assumes. In this sense, a higher value as a product of the return/risk ratio represents a higher compensation per unit of assumed risk, as is the case of GA, which has a difference of 0.0345 and 0.0565 compared to the B&H and TA investment strategies, respectively (Table 3).
5. Discussion and conclusions
As one of the pioneer studies in the field of training technical rules by GA, the GP-based approach followed by Allen and Karjalainen (1999) contrasted substantially with our findings. First, in Allen and Karjalainen’s study, no technical indicator was chosen ad hoc or exogenously specified a priori. Even though, a wider timeframe of historical data (1928-1995) was studied in Allen and Karjalainen (1999, data undergoing a stock market crash (known as Black Monday on October 19, 1987) was also included. It is still doubted if those learned trading rules could depict not only market reactions during the crash (S&P 500 index lost 20.5%), but more importantly ups and downs before and afterward. Evidence of this is given by the Snipper Market Timing (1987) Report. However, we believe that the inability of learned training rules to account to a certain extent for such severe downturns around the 1987 market crash could be a contributing factor to the lack of consistency in excess returns in Allen and Karjalainen (1999. Since trading rules found used daily data, the impact of these downturns in the market in 1987 could probably have major impacts on the learning process to finally result in excess returns inconsistencies in the out-of-sample test, as shown by their findings.
A broader insight into the NASDAQ Composite index overall performance helps us to visualize possible implications of why NASDAQ’s good performance in price activity may be favorable for the algorithm learning process, as this shows the foremost reliance on historical price trends. NASDAQ index with nearly 60 years (of commenced operations) has outperformed the S&P 500 ten times (cumulative returns of 258% against 94% of S&P 500) over the last two decades alone (Slen, 2019). The historical prices under our study comprised data in the timeframe 2013-2017 when most of the divergence in cumulative gains between the two indexes has occurred, that is, since the beginning of 2015 up to date (Slen, 2019). Besides, NASDAQ volatility minus S&P 500 volatility in the period of analysis has reported being (þ) 2.61% (and þ3.30% up to 2019) on average with excess returns (þ) 5.91% higher on average for NASDAQ in the same period (and þ5.59% up to 2019) compared to S&P 500, according to Slen, (2019). This can be taken as that NASDAQ particularity of having 400 fewer companies seems to have the ability to take on more exposure to those in the index against those in S&P 500, and consequently, driving to higher volatility for the NASDAQ index. The fact that higher volatility as factually observed in the NASDAQ index certainly entails a good trait for price activity in the index (considering that volatility is computed by taking the standard deviation of daily returns and an indication of up/down price movements) may help also to explain at some extent the superior and consistent returns in our study even after transactional costs compared to findings in Allen and Karjalainen (1999).
Giving support in the first instance to our results on the profitability of learned trading rules over B&H strategies, the study by Martın et al. (2018) on the generation of trading rules based on technical indicators for the S&P 500 through a methodology based on the refinements of GA showed that the B&H can reasonably be beaten by the implemented GP strategy. However, Martın et al. (2018) study time-dependency of the algorithm performances was also evidenced. The referred dependency trait from the use of the GAbased approaches showed generated rules in the range 78-90.5% in cases of either improving or beating the B&H. Given the relatively short timeframe of our dataset for analysis (2013- 2017) compared to that analyzed in Martın et al. (2018), we may infer that more than the timedependency commonly observed in Martın et al. (2018) the outperformance of the index during the timeframe of our study may presumably play a determinant role in the algorithm learning process and supported the effects on maximizing our function (returns), and consequently, had a positive impact mostly on the GA-based approach over the alternatives B&H and technical only. the outperformance of the index during the timeframe of our study may presumably play a determinant role in the algorithm learning process and supported the effects on maximizing our function (returns), and consequently, had a positive impact mostly on the GA-based approach over the alternatives B&H and technical only. Furthermore, the extent of any time-dependency (if any) could probably not be entirely unveiled because of the constrained dataset length under our study compared with Martın et al. (2018) study.
Our results show evidence of outstanding performance in excess returns from learned trading rules following the GA-based strategy compared with returns from B&H and TA and these have raised some questions. First, is it possible for the studied GA-based approach of learning trading rules to achieve excess returns (beating the B&H and the TA) after transactional costs when applied in a well-structured stock index such as NASDAQ 100? We strongly believe that in the case of having any impact of the length of our dataset (five years) on the learning process of the algorithm, this timeframe would be representative of the outperformance over the last two decades of the NASDAQ 100 index studied. However, based on a particular outperforming stock index (NASDAQ 100) during the timeframe of analysis (as stated above and supported by Slen, 2019), certainly the fine-tuning of the parameters in the technical indicator (best values) by the GA algorithm that led to maximize returns seemed also advantageous over a traditional TA, and this in turning over the B&H strategy indicating that the GA positively amplified the improved tuning achieved by the TA. This opens doors for other studies on extended timeframes, perhaps including the US bear market of 2007-2009 with pronounced ups and downs and more mixed historical datasets for the learning process be able to capture any imbalance in stock price trends. To answer the original question, the findings suggest that it is feasibly possible the fine-tuning of technical parameters for profitable trading under GA-based strategies.
Second, are the learned trading rules based on GA using the MACD with its parameters at the best values for positive excess returns applicable with generality? Certainly, there are other limiting factors apart from the ones mentioned above for any assumption of generality. The fact that maximizing the objective function returns comes from a maximization process implies that the indicator parameters found in our study are not necessarily optimal. Although a larger dataset may be imperative for the genetic algorithm-based approach to deepen the learning of the resulting trading rules, we cannot conclude if the learned trading rules in our study will still perform the same way and providing comparable outcomes, and finally, be fool proof for unspecific market application. However, this work may be a foundation for future studies on evolving trading rules by GA using expanded timeframes of analysis in emerging market indexes where the learning process of trading rules can be exploited by capturing the higher volatility and consequent higher expected returns typically associated with those markets (Kohers et al., 2006).
Third, is the technical indicator a meaningful choice into the technical-based (GA and technical only) setup for a profitable outcome? If considering the potential traits of trendfollowing indicators, these types of indicators are good at gauging the strength of the trends, and ultimately, give a confident indication of which direction the momentum of the trend is. For a market with strong trends (of outperformance during the timeframe of analysis like in our case with NASDAQ 100), trend-following indicators (e.g. MACD, TA) seem to work at their best and may more widely be exploited into the GA.
The findings of our study intrinsically possess the characteristic disadvantages of GA.
The solution found for maximized returns (from optimized parameters) represents only nearoptimal results. Verifying optimality for these results (from a GA-based approach) is particularly difficult as the solution would not be computationally feasible using conventional techniques. This aspect would help answer the question of whether our GA approach is flawless itself and stand out as a benchmark. On the other hand, another questioning arises regarding performance comparisons between our approach applied to developed and well-established stock markets as those in the US (benchmark) and those in the least mature markets like in Latin America and Asia. Our study demonstrated that GA were payoff-driven by substantially improving returns over the “benchmark” B&H, and this opens the door to research in different directions.
First, look at how the algorithmic framework adapts to local market conditions (e.g. high volatility and transactional costs) despite the increasing internationalization of markets is necessary. However, given the decreased availability of information in these markets and the sometimes-questionable quality of the information, it is unquestionable that implementation of GA strategies on emerging markets would lead to contribute to enhanced prediction power to investors locally. Second, the unknown (if so) interdependency between data and procedure would be interesting to be investigated to determine whether the high accuracy of the GA method is independent of the procedures regarding the way the data were split for training and validation purposes.

