Inglês (pdf)
 Artigo em XML
 Referências do artigo
 Enviar este artigo por email
 Citado por SciELO
  Similares em
SciELO
Similares em
SciELO 
 Permalink
Introduction
It is well known that currency substitution — or partial dollarization — is a recurring problem in Latin America (LA) nations and that the greater the degree of a shift away from domestic to foreign currencies, the more sensitive a country's monetary aggregates are to sudden movements in exchange rates, productivity and interest rates (Prock et al., 2003). In fact, currency substitution is a form of dollarization and can even be the door to giving up the national currency (Calvo and Vegh, 1992). In this sense, official dollarization is an extreme — fixed-exchange rate — monetary regime, in which the dollarized country formally renounces the issuance of national banknotes and coins and adopts the currency of another country (usually the dollar) as a means of payment and unit of account. Furthermore, official or partial dollarization is a consequence of political, economic considerations (such as hyperinflation), currency instability and strong trade links with a specific country (Mengesha and Holmes, 2013).
Likewise, this system represents an even stronger commitment because of the difficulty of regaining control of monetary policy and establishing a new exchange rate. Basically, in a dollarized country there is no exchange rate and there cannot, therefore, be an exchange rate crisis (Bird, 2004). For this reason, dollarization provides a much more credible mechanism, compared to other alternatives to fixed exchange rate regimes, especially in developing economies that lack internal discipline and have institutional weaknesses (Alesina et al., 2002). In addition to gaining credibility, positive features of a dollarized system include lowering information costs, providing a cushion for sharp relative price changes (Calvo, 2001a); mitigating the exchange rate risk, country risk and interest rates, and promoting the convergence between domestic inflation and that of the US (Dornbusch, 2001; Edwards, 2011; Larrain and Tavares, 2003); fostering bilateral trade between the dollarized countries and the US; and improving credit rating and access to international markets by reducing debt restrictions (Levy-Yeyati and Sturzenegger, 2002). Besides, the costs involved in this arrangement are the loss of seigniorage; vulnerability to external shocks by loss of the ability to manage exchange rate policy and monetary policy; the inability to establish cyclical policies; nominal price and wage rigidities that limit the reduction of production costs; and the absence of a lender of last resort (Calvo, 2001b; Schmitt-Grohé and Uribe, 2001).
On the other hand, although dollarization can lead to macroeconomic stability, several studies have also shown harmful effects at an economic level. Edwards and Magendzo (2003, 2006) found that (1) dollarized countries have experienced a slightly lower growth rate compared to countries that maintain their own currency — this difference is statistically significant (albeit small) — and (2) the output volatility has been significantly higher in dollarized economies. Therefore, even though dollarization — as well as other fixed-rate systems — provides an anchor for inflation, it does not guarantee the resolution of deeper structural and institutional problems (Hochreiter and Siklos, 2002).
Moreover, although several economists (Alesina et al., 2002; Calvo and Mishkin, 2003) raised the possibility at the beginning of the 21st century that LA countries might adopt dollarization as a measure to reduce macroeconomic imbalances and exchange rate volatility, after the dollarization in Ecuador and El Salvador, no other LA country has adopted this regime. Nonetheless, because of hyperinflation and macroeconomic imbalances in certain LA nations, the dollarization debate has resurfaced in recent years. Venezuela has faced an economic debacle for around 15 years: inflation exceeded 1.000.000% in 2018, along with higher projections, persistent fiscal deficits, scarcity of goods, unemployment close to 50%, economic dependence on the oil sector, the dramatic migration of the Venezuelan population, continuous currency devaluations and proliferation of a black money market. Urdaneta et al. (2019) show that after the implementation of exchange controls in 2003, the demand for money in foreign currency has grown well above the demand for money in national currency, which is indicative of dollarization.
Argentina is another country that is dealing with a serious economic crisis. Since 2015, the Argentinian economy has contracted by approximately 4%. Since 2010, it has faced recurrent government budget deficits, and its external debt is now over 60% of gross domestic product (GDP). Moreover, the Argentine peso has lost two-thirds of its value since 2018, and the inflation rate is close to 50%. In this sense, even though dollarization is not the most appropriate monetary system because it implies important rigidities, this arrangement may work well in countries with a long history of imbalances and instability (Edwards, 2011). Therefore, a key question is whether these economies should adopt an official dollarization system, considering that partial dollarization can lead to an acceleration of inflation in both the short run and long run and put more pressure on the exchange rate (Mengesha and Holmes, 2015).
Consequently, this paper reassesses the feasibility of adopting an extreme fixed exchange regime in LA countries using the framework of the optimal currency areas (OCA) theory, considering that, in fact, dollarization is an incomplete monetary union. We use a structural vector autoregressive (SVAR) model to identify what type of structural shock — country-specific, regional or global — prevails in LA economies. For this purpose, the US output is used to represent the global output and determine how the shocks of the US influence the output trajectory of each LA nation. The higher the influence of the US product, the lower the costs of adopting the US dollar. This strategy allows us to determine whether an economy could adopt the dollar as a currency. The structure of the paper is as follows. In the second section, the literature studies related to dollarization and the OCA theory are revised. The third section details the methodology, model and data used. The fourth section describes the most important results. In the fifth section, different estimates are made to ensure the robustness of the results. The sixth section is a discussion section on the main results. Finally, the main conclusions of the study are presented.
Dollarization, the incomplete monetary union: a literature review
Fixed exchange-rate regimes — such as currency boards or dollarization — also involve a de facto monetary union. Robert Mundell, who developed the OCA theory, defined a monetary area either as a region in which a single currency prevails or as one in which different regions with their own currency relate their currencies to each other through a fixed exchange rate. The benefits and costs of dollarization are like those assumed by the creation of a monetary area. However, both currency boards and dollarization are considered to be incomplete currency unions because both monetary systems are unilateral decisions (Hochreiter and Siklos, 2002; Vernengo, 2006). While dollarization only involves the replacement of the local currency with the US dollar, a complete monetary union is a much more complex process, in which political and economic coordination is required in addition to institution-building by countries interested in introducing a single currency (De Grauwe, 2012; Hochreiter et al., 2002).
Traditionally one of the factors determining the suitability of the creation of a monetary area is the business cycle synchronization between economies. If the business cycles of the members of a monetary area are synchronized, the cost of losing the monetary policy is lower, as country members can use a common monetary policy to deal with external shocks (Alesina et al., 2002; Frankel and Rose, 1997). Therefore, even though dollarization corresponds to an incomplete monetary union, the business cycle synchronization criterion can also be used to assess the feasibility of adopting this monetary agreement — in the case of LA countries, the degree of business cycle synchronization between a candidate economy to adopt the dollar and the US. In an empirical examination of dollarization versus regional currency union as options for the economies of East Asia, South America and Central America, Larrain and Tavares (2003) concluded that dollarization may be an option for Central American countries but neither dollarization nor a regional currency would be a good decision for South American (SA) economies. Canova (2005) found that US monetary shocks generate large and negative responses to LA macroeconomic variables regardless of the exchange rate regime. Kandil (2009) demonstrated that trade openness and financial linkages are important transmission channels of US business cycles in various heterogeneous LA countries. Gong and Kim (2018) determined that global financial linkages play the most important role in explaining regional business cycle synchronization in both East Asia and LA nations. In addition, although the integration — through business cycle synchronization analysis — between the US and other LA nations would seem to have increased in the last two decades, Miles (2017) found evidence that Ecuador and El Salvador appear to be the countries that are least integrated with the US.
Methodology
According to Bayoumi and Eichengreen (1993), highly correlated or symmetrical supply shocks within a region indicate that a group of countries are good candidates for a monetary union — regardless of whether they are formal or incomplete monetary unions. Nonetheless, one criticism of this methodology is that it is not possible to distinguish between different types of disturbances; that is, between domestic (or country-specific), regional and global shocks (GSs). Later, Chow and Kim (2003) emphasized that the prevalence of each type of shock determines the appropriate monetary system a country should adopt. That is, if either domestic shocks (DSs) prevail in a country, or if the country's output trajectory is explained by this kind of shock, this country should maintain its own currency. Whereas if regional or GSs prevail, the adoption of a foreign currency would be justified. Thus, if regional shocks (RSs) predominate in a group of economies, they may adopt a regional monetary agreement. And, if GSs prevail in an economy, it is possible to justify a global monetary system or a global currency (such as the US dollar or the euro) (Chow and Kim (2003; Regmi et al., 2015; Zhao and Kim, 2009). Regmi et al. (2015) emphasize that when GS prevails, and if it is represented by US output, it would indicate that the countries' exchange rate arrangements should lean toward the US dollar.
To distinguish between different types of disturbances, we use the methodology applied by Chow and Kim (2003) and based on the approach of Blanchard and Quah (1989), and King et al. (1987). Where domestic output ყ d faces three types of shocks: global, regional and domestic ( ꭒ g , ꭒ r and ꭒ d ):

Where β i (L)=β i0 +β i1 L+β i2 L 2 +… is a polynomial function of the lag operator (L). The model of equation (1) is determined by three variables: the global (y g ), regional (y r ) and domestic (y d ) output. The three types of structural shocks are represented in matrix form, as follows:
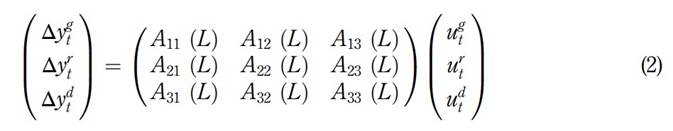
Where
and the matrix representation is Δy t =A(L)u t . The model assumes that domestic, regional and global structural shocks are not correlated, and that the variance is unitary. This is V ar (u t )=I. In addition, Chow and Kim (2003)established restrictions based on the characteristics of small and open economies for the identification of each type of innovation: (1) DS have no effect on the regional and global output in the long term, and (2) RS do not cause changes in the global output in the long term. These constraints integrated into the model imply that some matrix A(L) coefficients are equal to zero (i.e. these estimates are omitted). In this case, the coefficients A 12 (1) = A 13 (1)= A 23 (1) = 0.
Through this process, it is possible to identify GS, RS and DS and their prevalence for a specific country. The SVAR models have been used in studies related to the suitability of different economies to maintain their own currency, integrate a monetary area or adopt a more global arrangement in East Asia (Chow and Kim, 2003),South Asia (Regmi et al., 2015)and the CFA franc zone (Zhao and Kim, 2009).
Data
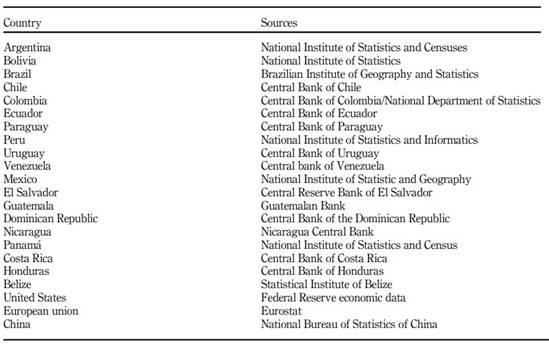
In this paper, the output is represented by GDP (in constant prices). The data correspond to two blocs of countries: SA (first bloc) and Central America and the Caribbean (CAC) (second bloc). The nine countries that form the SA bloc are Argentina, Bolivia, Chile, Colombia, Ecuador, Paraguay, Peru, Uruguay and Venezuela. The CAC bloc consists of eight countries: Guatemala, Costa Rica, Honduras, Belize, Panama, El Salvador, Nicaragua and the Dominican Republic — these countries account for 82.88% of the total output in CAC. Previous studies have used countries with significant economic and political weight within specific regions for the representation of the regional output. For this research, we use Brazil's output as a proxy variable of the regional output. This choice is justified by the fact that the Brazilian economy is the largest in the SA region (approximately 50% of the total regional output). As for the CAC countries, Mexico's output is used as a proxy variable for the regional output. The US output is used to represent the global output and then determine how the shocks of the US influence the output trajectory of each country analysed. This strategy allows us to determine whether an economy could adopt the dollar as a currency.
The sample has been divided into four groups. The first two groups correspond to data with an annual frequency between 1960 and 2000 for both economic blocs and were obtained from the IMF Outlook. The second two groups correspond to quarterly data, between 2001 and 2018, obtained from the official sources (see Table A1 in the Appendix) of each country for both economic blocs (1). The purpose of splitting the database into two periods is to verify whether there were changes in the importance of shocks over time. Quarterly data have been seasonally adjusted using the 13ARIMA-SEATS method.
Results
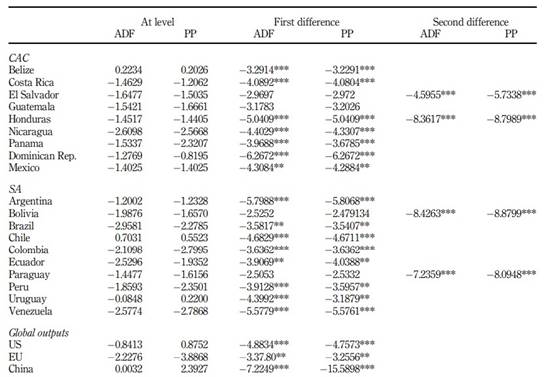
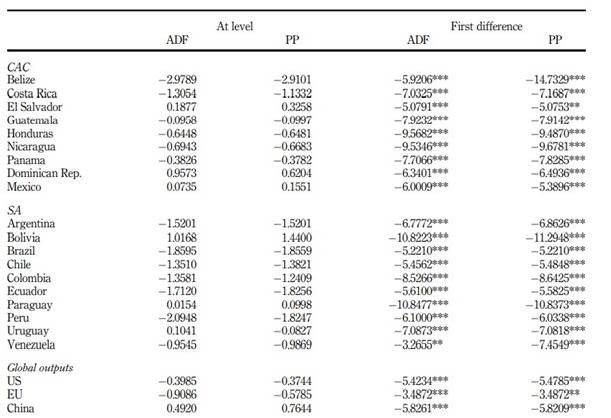
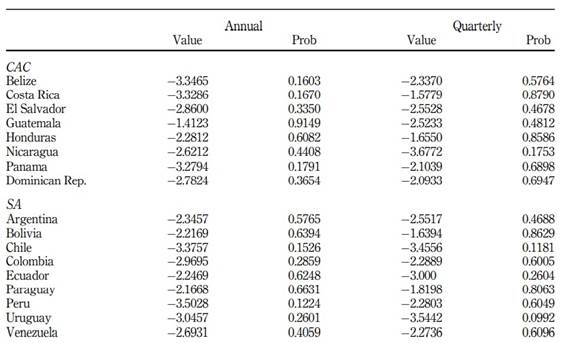
Before running the estimates, we first tested the seasonality of the variables and the possibility of cointegration. Tables A2 and A3 (see Appendix) report the results of unit root and Table A4 (see Appendix), the cointegration tests. Both the augmented Dickey-Fuller (DF) tests and the Phillips-Perron (PP) unit root test are used. The results indicate that all variables (in logarithm) are non-stationary at a level. Following the cointegration tests based on the method proposed by (Engle et al., 1987), we determine that the logarithm of global, regional and local outputs are non-cointegrated. Given the assumption that all variables are non-stationary and non-cointegrated with each other, we use a reduced-form model which consists of the difference of the logarithm of domestic, regional and global output and is explained by the first lag of each of these variables (2, 3) The autocorrelation in residuals has been verified (4) Consequently, all estimations satisfy the stability conditions.
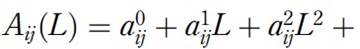
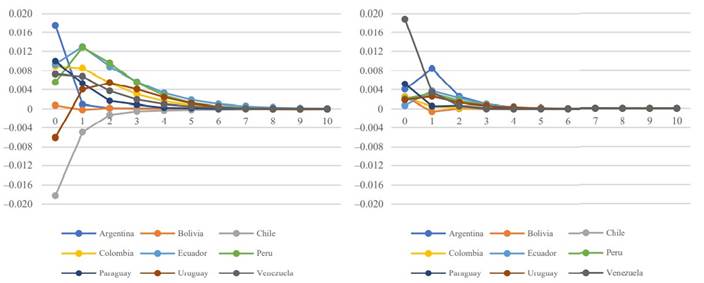
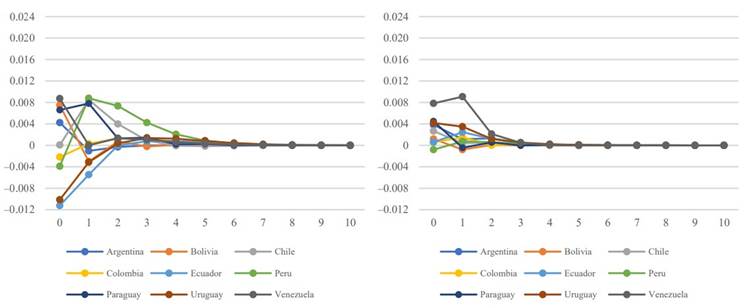
First, we analysed the results of the impulse-response function for each type of shock (see Figures 1, 2, 3, 4, 5 and 6). The results allow us to determine a clear pattern: the sensitivity to each type of shock (local, regional and global) decreased for both groups of countries. With respect to GS, since 2001 both economic blocs have had less sensitivity (and greater symmetry) of their domestic product regarding the US shocks. However, it should be noted that Venezuela's output has maintained a greater sensitivity to shocks from the US.
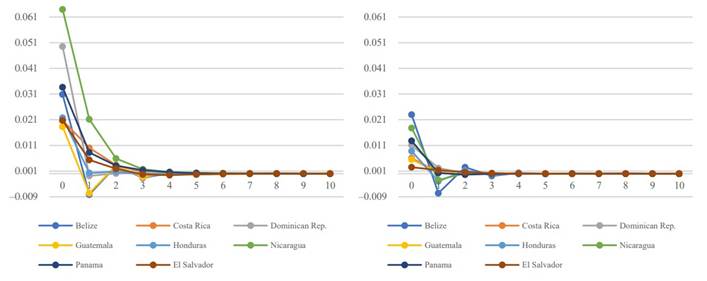
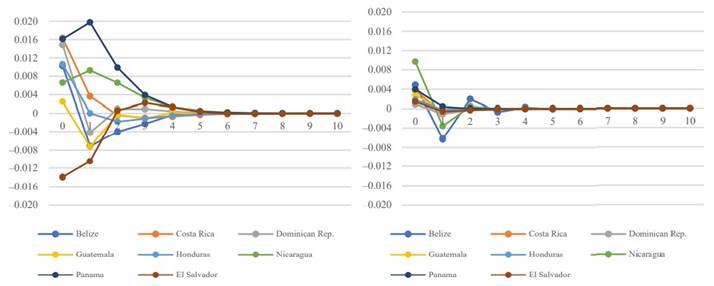
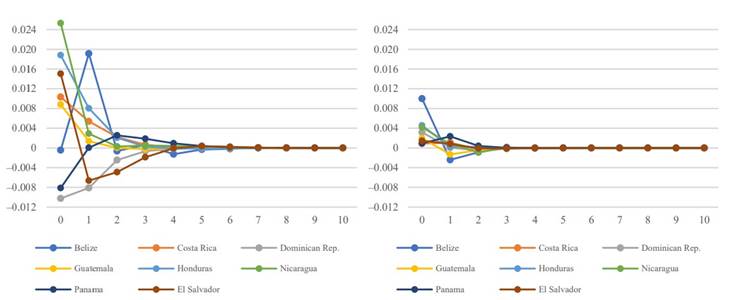
Figure 3 Response of domestic output to a regional shock in CAC, 1960-2000 (left), 2001-2018 (right)
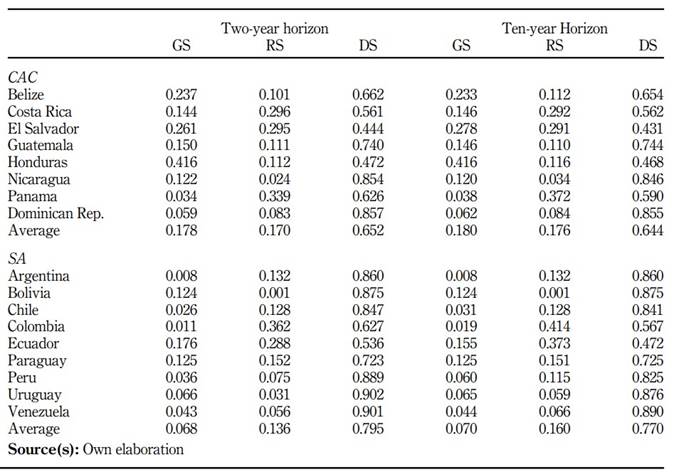
After obtaining the impulse response functions, we have estimated the variance decomposition for the prediction error for both the annual and quarterly data. The variance decomposition allows us to obtain a measure of the level of the prediction error of the output of each country as a response to each type of shock (global, regional and domestic). Regarding the annual data between 1960 and 2000, we have made predictions for a two-year (short-term) and a ten-year (medium-term) horizon (see Table 1). In the case of CAC countries, the deviation of the output of each country is explained mainly — on average, 65.2% — by country-specific shocks, whereas RS and GS explain, on average, 17 and 17.8%, respectively. The countries influenced most by the US shocks are Honduras, El Salvador and Belize. These data allow establishing that these three countries, and especially Honduras, were in a better position to adopt dollarization between 1960-2000. It is relevant that the output deviations of Panama, a dollarized economy since 1904, were barely explained (3.4%) by the US shocks. The average contribution of RS was 17.8%. For the SA countries, the output deviation is explained mainly by DS, with an average of 79.5%. On average, GS (represented by the US output) accounted for only 6.8% of deviations in this group of countries; the country that was influenced the most by GS is Ecuador, a dollarized economy since 2000.
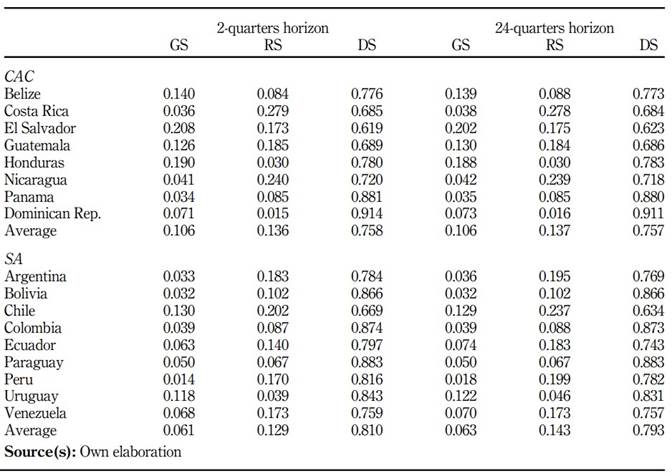
Regarding the quarterly data corresponding to 2001-2018, we have made predictions over a time horizon of two-quarters (short-term) and 24 quarters (medium-term) (see Table 2). According to the results obtained, in both economic blocs, the importance of DS has increased, whereas the influence of US shocks has declined in most cases. Despite the economic dominance of the US in both regions, the GS explains only approximately 10% of the output variation in CAC countries and 6% of that in SA countries. At the country level, the economies that are more affected by GS are Honduras, El Salvador and Chile. Interestingly, Ecuador and Panama (dollarized countries) show a low impact of US shocks in the short term and in the medium term.
Robustness
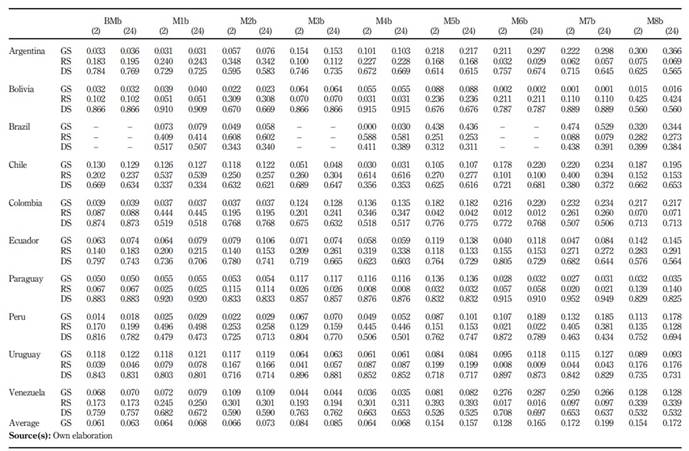
To ensure the robustness of the results, in this section, we estimate different models — only for the quarterly data — by changing the configuration of the variables that represent the regional and global output and comparing them with the results of the benchmark model (BM). We use the output of the European Union (EU) and China (designated CHN in Table 3) as alternatives to the US output. For the regional output variable, we use a representative economy in the M3 and M6 models, the sum of the output of the three most stable economies (5) for M1, M4 and M7 models, and the sum of the output of all countries included in the sample (6) for M2, M5 and M8 models. All alternative configurations are summarized in Table 3.
Table 3 Alternative models’ configuration
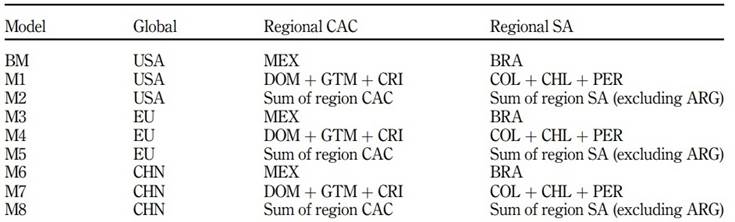
Note(s): In the case of South America, when the regional output is added up, Argentina’s output is excluded from the configurations because there are no data available for the years between 2001 and 2003. The output of China is deflated by the consumer price index
Source(s): Own elaboration.
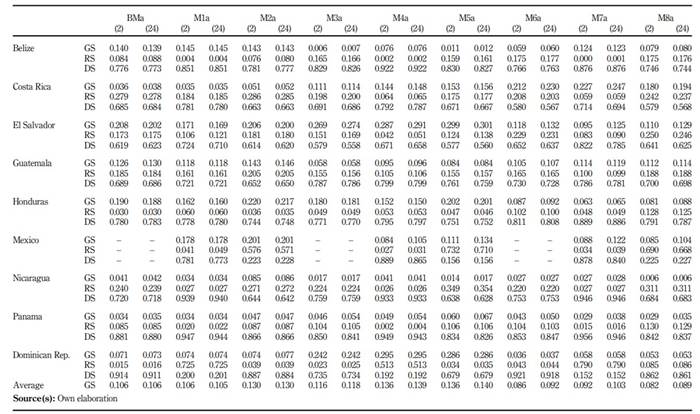
Tables 4 and 5 present the results of alternative models. Overall, the results show interesting patterns. First, CAC and SA countries exhibit a similar impact of the US output compared to the BM. Second, alternative models that use a different configuration for the global output reveal that both regions are influenced to a greater extent by China and the EU, compared to that shown by the US. In CAC nations, China accounts for, on average, 9.2% (M7a) of the product prediction error of these countries, whereas, in SA, China's output explains, on average, 17.2% (M7b). These levels are higher than the degree of explanation shown by the US output in both regions. The decline of the influence of the US economy in the trajectory of the GDP of LA countries can be explained by the rise of the commercial linkages of these economies with China and the EU. Actually, China's demand has delivered significantly higher growth rates to Latin American and Caribbean countries’ exporters over the last decade and a half (Hou, 2019).
Discussion and final considerations
Although before dollarization in Ecuador international financial institutions and academic opinion had generally opposed this monetary system, after Ecuador's apparent early success, the initial negative opinion changed substantially and stimulated a deeper academic debate (Bird, 2004). Ecuador's experience showed the economic stabilization capacity of the dollarization system. The main macroeconomic indicators of Ecuador have evolved favourably. Inflation has been reduced to single-digit rates, unemployment has had moderate levels, sovereign risk has been at lower levels, compared to the time of monetary autonomy, gross capital formation has grown faster and institutional strengthening. This last point is essential to avoid financial crises. An improvement in institutional quality is an important factor to reduce the banking system risk, even more in highly liquid and concentrated banking systems (Canh et al., 2021).
However, despite the stabilization capacity of dollarization, after the adoption of the dollar in Ecuador and El Salvador, no other LA country adopted this regime and the focus on this monetary agreement has gone fading through the years. Certainly, the fact that the United States Federal Reserve does not consider the needs of dollarized economies for the design of its monetary policy constitutes an important barrier for other economies to opt for this monetary regime. Even more so in scenarios in which the US economic cycle is less and less related to dollarized economies, increasing the costs of giving up monetary autonomy according to the OCA theory. In this sense, one of the most relevant results is that contribution of the US shocks in Ecuador and Panama have been reduced even after the dollarization in these countries, despite the theory predicting otherwise. According to Frankel (1999), and Frankel and Rose (2001), the business cycle synchronization of countries that form a monetary union should increase after the adoption of a common currency, given the implementation of common policies and the improvement of intraregional trade. However, for Krugman (1991), trade integration could result in increased specialization in goods and services where economies have comparative advantages.
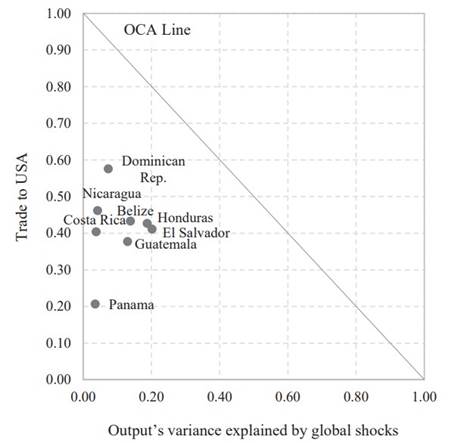
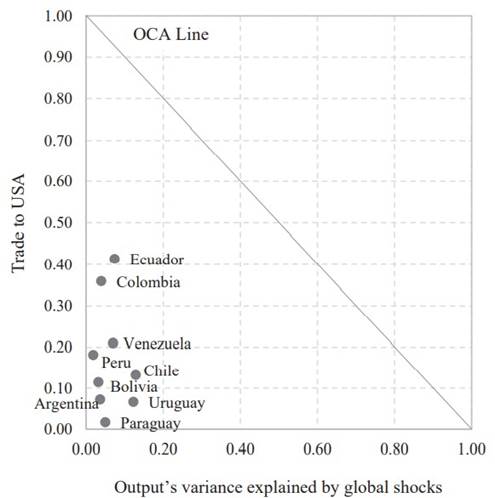
On the other hand, the OCA theory emphasizes that the benefits of adopting a common currency are directly proportional to the level of intraregional trade; and if business cycles of the members of a monetary area are synchronized, the cost of losing the monetary policy is lower, as it is possible to use a common monetary policy. Following De Grauwe and Mongelli (2005), and Padilla and Rodríguez García-Brazales (2021), Figures 7 and 8 represent the relationship between the potential costs and benefits of adopting dollarization for each region. The costs are represented by the decomposition of variance for the prediction error of the GS obtained from the BM model and the benefits by the percentage of exports from each country to the US. The higher the influence of the US product, the lower the costs of adopting the US dollar. The OCA line (downward sloping) shows the combinations between asymmetry (costs) and the trade to the USA (benefits). The slope of the OCA line is negative because the costs produced by a lower symmetry can be offset by the benefits produced by an increase in trade between the economies that share the same currency. Consequently, the points to the right of the OCA line represent countries where the benefits of dollarizing their economies outweigh the costs. In general, the CAC economies are closer to optimality than are those in the SA group of economies. Surprisingly, Panama is the CAC country that is furthest from optimality. In the case of SA countries, Ecuador and Colombia are better located due to their strong commercial links with the US. Finally, Argentina and Venezuela, countries with deep macroeconomic imbalances, are far from the right side of the OCA line. Therefore, both countries would have little incentive to dollarize their economies. However, it is unrealistic to think that Venezuela will dollarize its economy. The political tensions and the economic sanctions imposed by the US on Venezuela, which include the freezing of the assets of the Venezuelan government in the United States and a commercial blockade, are the main obstacles for Venezuela to adopt the dollar as its official currency.
Conclusions
Our findings show that for the first period (1960-2000, with annual frequency), the deviation of the output of each country is explained mainly by country-specific shocks for CAC countries. The countries more affected by the US shocks are Honduras, El Salvador and Belize. For the SA countries, the output deviation was also explained mainly by country-specific shocks; Ecuador's GDP trajectory was the most affected by the US shocks. According to the results of the second period (2001-2018, quarterly frequency), both in SA and CAC, the importance of country-specific shocks has increased, whereas the influence of US shocks has declined in most cases compared to results of the first period. Specifically, in the CAC countries, the decomposition of the variance of US shocks fell from an average of 17.8%, during the period 1960-2000, to 10.6% for 2001-2018 according to the BM, while in SA countries the decomposition of the variance went from an average of 6.8%, during the period 1960-2000, to 6.1% for 2001-2018. Alternative models show that both regions (CAC and SA) are influenced to a greater extent by China and the EU shocks, compared to the US shocks.
Interestingly, one of the most relevant results is that the influence of the US shocks in Ecuador and Panama has been reduced even after the dollarization in these countries, despite the OCA theory predicting otherwise (Frankel, 1999; Frankel and Rose, 1997, 2001). Finally, the estimates for Venezuela and Argentina show that the importance of US shocks in the trajectory of their GDP is low. Therefore, the cost of adopting the US dollar as the official currency would be high. Certainly, the fact that the United States Federal Reserve does not consider the needs of dollarized economies for the design of its monetary policy constitutes an important barrier for other economies to opt for this monetary regime. Even more so in scenarios in which the US business cycle is less and less related to dollarized economies, increasing the costs of giving up monetary autonomy.
Notes
1. Except for Argentina, whose data were collected starting from the first quarter of 2004; El Salvador, from the first quarter of 2001 until the third quarter of 2017; and Venezuela, from the first quarter of 2001 until the third quarter of 2018.
2. The quarterly series panel includes a crisis dummy variable between the second quarter of 2008 and the first quarter of 2009.
3. The number of lags is determined by the Akaike Information Criterion and the Schwarz Criteria.
4. For the annual output series of Guatemala, El Salvador, Bolivia and Paraguay, the second difference had to be applied to avoid unit root problems presented in the first differences.
5. For CAC countries: Dominican Republic, Guatemala and Costa Rica. For SA countries: Colombia, Chile and Peru.
6. In the case of South America, when the regional outputs are added up, Argentina's output is excluded because data are unavailable from 2001 to 2003.