


 Inglés (pdf)
 Articulo en XML
 Referencias del artículo
 Enviar articulo por email
 Citado por SciELO
  Similares en
SciELO
Similares en
SciELO 
 Permalink
Introduction
The importance of tourism growth (TOUR) in the generation of economic growth has been extensively recognized by academics and policymakers base the increase in their macroeconomic data on the expansion and development of these findings (Manrai et al., 2018; Flores-Muñoz et al., 2019; Nguyen et al., 2020; Polemis et al., 2021). Since the work by Balaguer and Cantavella-Jorda (2002), was the first one to formally refer to the tourism-led growth hypothesis (TLGH), a plethora of authors has investigated that discipline (1). Remained on the same strand but searching this academic question from a different angle. This research studies the connection between the total factor productivity (TFP) index and TOUR in Latin American Countries (LACs). To do this, we employ a data set of 16 LACs during the period 1995-2017 evaluating the time-varying causality of Ajmi et al. (2015). Our underlying idea is that the TFP index can be a more effective variable in preference to economic growth to interpret the relationship between economic development and TOUR. Furthermore, a bulk of relevant literature used economic growth (Du et al., 2016; Mérida and Golpe, 2016; Tang and Abosedra, 2016; Chiu and Yeh, 2017; Li et al., 2018) with only two studies which used TFP (Liu and Tsai, 2018; Tzeremes, 2021).
In particular, from the beginning of growth economics and the pioneering Solow model (Solow, 1956) TFP has been deemed an intriguing milestone to explicate long-run amelioration. TFP depicts a compound of labor and capital productivity, which explains the rise of technological development. Thus, TFP has classically been considered a vital tool of technological development (Letta and Tol, 2018; Vella, 2018; Nguyen et al., 2021a, b). According to Solow (1956), endogenous growth and neoclassical framework can measure economic growth. Moreover, TFP accounts for the degree of technological development, as a result, it has a direct impact on economic growth but as an exogenous factor. Lastly, based on endogenous growth theories, TFP is a crucial element of economic growth via technological change which is a vital component of TFP (Romer, 1986; Lucas, 1988; Tzeremes and Tzeremes, 2021). Thus, either neoclassical or endogenous growth models state that the TFP index may increase economic growth in the long run period.
We choose to study LACs for many reasons. Initially, there is not much research on the tourism and growth nexus (2). LACs are a tourist attraction in many aspects. Natural tourist resources encompass famous beaches, lush jungles and great biodiversity. Brazil is at the top of the biodiversity ranking (with more than 3,000 species). Mexico and Costa Rica are included in the top 10 best natural tourism destinations. Moreover, Argentina, Colombia and Peru belong to the top 50 cultural tourism destinations. Apart from natural and cultural tourism, LACs are medical tourism attractions. Brazil is known for plastic surgery and Cuba for cancer treatments. Religious tourism is one more motivation to visit LACs. For example, the Basilica of Our Lady of Guadalupe in Mexico and the National Sanctuary of Our Lady of Aparecida in Brazil are popular destinations with more than 10 million visitors every year. Lastly, LACs are famous for business-economic tourism, Brazil and Mexico are developing economies and Panama and Puerto Rico are enormously open to international trade (Netto et al., 2015).
This research contributes in several ways. First, it sheds light on the relationship between TFP and TOUR for LACs analyzing the role played by the productivity of TOUR. In contrast to previous studies that only focus on the effect of economic growth on tourism development (Du et al., 2016; Mérida and Golpe, 2016; Tang and Abosedra, 2016 and Chiu and Yeh, 2017, among others), we pay attention to TOUR, which may arise from increased productivity. Second, we applied the time-varying causality which captures time effects instead of the classical Granger causality (Ajmi et al., 2015). Finally, for the first time, we illustrate the relationship between these two variables for LACs and we emerge the shape of the curve for each country.
The rest of the paper is organized as follows: Section 2 reports the literature review and the method is described in Section 3. Then, Section 4 presents formally the results and lastly, in Sections 5 and 6 the discussion and conclusions are exhibited.
Literature review
The tourism literature of LAC shows how the growth of the tourism sector can potentiate relationship economic growth as well as its advantages. Tourism led growth hypothesis is confirmed for most of the academic research. Specifically.
For Colombia, Brida et al. (2009) utilizing the Johansen cointegration test and a vector error correction (VEC) model proved the hypothesis that tourism led to growth. Again, for Colombia, and with the same econometric models but this time for the five most popular tourist destinations, Brida and Monterubbianesi (2010) verified the validity of TLGH. Likewise, findings for Chile, yet an extra Granger causality test (Toda-Yamamoto) is used by Brida and Risso (2009) to confirm the TLGH. Not surprisingly, outcomes for Brazil (Brida et al., 2011) and Mexico (Sánchez Carrera et al., 2008). Croes and Vanegas (2008) investigated the validity of TLGH for Nicaragua by implementing the Johansen cointegration test and the traditional Granger causality model. Also, the authors used an extra variable, poverty reduction, and they showed a long-run connection between the three variables. About Granger causality results, a unidirectional causality running from tourism to growth and poverty reduction is revealed, whilst a two-way causality between growth and poverty reduction is suggested. Brida et al. (2010) analyzed the connection between tourism-economic growths in Uruguay and divulged the hypothesis that tourism provokes economic growth. Moreover, they employed the tourism receipts from Argentina (exchange rate) since Argentinean tourists constitute most arrivals in Uruguay. The results demonstrated the validity of the hypothesis that export-led economic growth.
The panel data method was applied by Fayissa et al. (2011) to explore the impact of TOUR on economic growth. In particular, they built a multivariable framework implementing a fixed-random effect, a generalized method of moments estimator and a panel quantile fashion on a panel data of 18 LACs. The findings disclosed the general hypothesis which exists that TOUR induces a positive rise in economic growth. Finally, Lionetti and González (2012) documented the influence of TOUR on trade leveraging cointegration and vector autoregressive procedures for Argentina, Chile, the Dominican Republic, Mexico, Nicaragua and Venezuela. Neither Granger causality nor long-run linkage are depicted for the six LAC, yet when it comes to the short-run association is verified for Chile, Dominican Republic, Nicaragua and Venezuela. Nonetheless and interesting to observe is the mutual connection between these countries for the two variables.
However, all previous evidence shows that TOUR causes economic growth employing cointegration or traditional Granger causality models. Our study, first, implements TFP (economic development) rather than economic growth and second, we exhibit that previous studies have mostly relied on the standard Granger causality test to explore the dynamic link between the variables under examination.
Method
Data and variables
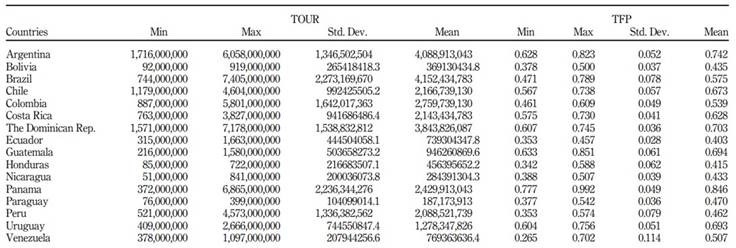
We used the annual data of 16 LACs comprising the period 1995-2018 (3);. The sample of LACs was confirmed by Argentina, Bolivia, Brazil, Chile, Colombia, Costa Rica, the Dominican Republic, Ecuador, Guatemala, Honduras, Nicaragua, Panama, Paraguay, Peru, Uruguay and Venezuela. The sample contained two variables, the TFP index and TOUR. The data set of TFP was taken from the Penn World Table-v9.1 (Feenstra et al., 2015), while the data set from TOUR was received from World Development Indicator (4). Table 1 shows the descriptive statistics of the variables.
3.2 Research model and analytical procedure
According to Granger (1969, 1988), a classical vector autoregressive (VAR) framework can be described only with two variables (ϕ, λ) The relationship between these two variables is renowned as the Granger causality test. Indisputably, a vast number of scientific works applied this model in many academic disciplines. The structure of the model is:
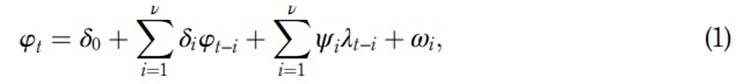
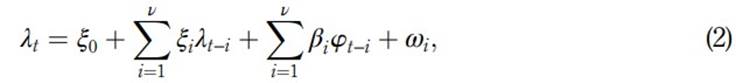
in our case ϕ and λ are the variables TOUR and TFP. In this model, Dahlhaus et al. (1999) developed a framework with a local stationarity process. Additionally, based on the same process, Sato et al. (2007) constructed a time-varying VAR model (dynamic VAR model) which involves a time smooth variation. This dynamic VAR fashion can be described as follows:
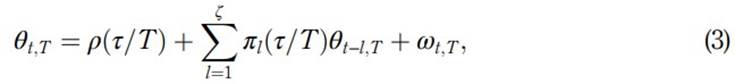
where θ t,T and p(Ƭ/T) stand for the variables TOUR and TFP, π l (Ƭ/T) denotes the autoregressive coefficients while shows the white noise error terms. Recently, a transformed model of equation (3) was established by Ajmi et al. (2015). The authors accomplished this transformation by applying the M- and B-splines functions (5);. Especially, using this new calculation (M- and B-splines functions) via a multiple linear regression model, Ajmi et al. (2015) re-estimated the model of equation (3) and the computational model can be defined as follows:
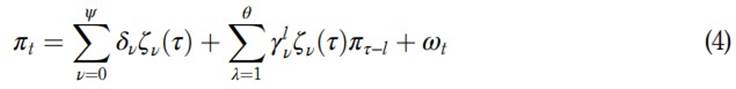
where δ ν denotes the vectors while ϒ l ν shows the B-splines coefficients. Moreover, according to Ajmi et al. (2015), the Granger causality test can be applied through the Wald test and then by applying the Wald test to the coefficients we can get the time-varying causality. Specifically, if the coefficients of the B-splines are statistically significant then we can conclude that the outcomes of the Granger causality are time-varying otherwise the results are constant. Finally, because this model is bivariate, and it reduces the number of observations, we suppose the lag order is equal to one (for more details, see Sato et al., 2007; Ajmi et al., 2015).
Lastly, as a robustness check, we can use welfare-relevant TFP levels at current PPPs instead of TFP levels at current PPPs. The welfare-relevant TFP level of a country's infinitely lived representative consumer is summarized, in first order, by TFP and by the capital stock per capita. To calculate this welfare-relevant TFP, a measure of real domestic absorption is needed which includes consumption as well as investment (Feenstra et al., 2015) (6)
Results
Table 2 begins by considering the unit root tests and more precisely two stationarity tests, Phillips and Perron (1988) and the Augmented Dickey-Fuller generalized least squares (DF-GLS) test constructed by Elliott et al. (1996). Our results show that no country has a unit root at level whilst when it comes to the first difference both variables for all countries disclose stationarity at order (1).
Table 2 Unit root tests results
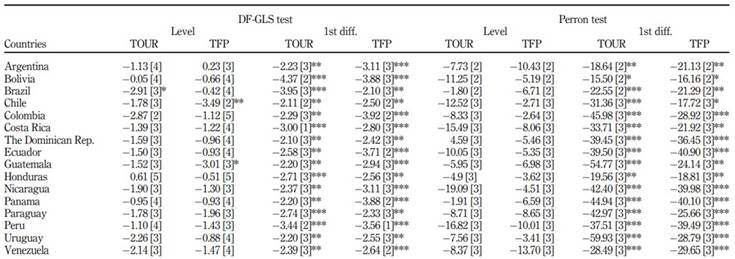
Note(s): ***, ** and * denote significant at 1%, 5% and 10% level. Numbers in square Brackets are selected lags
Source(s): Own elaboration
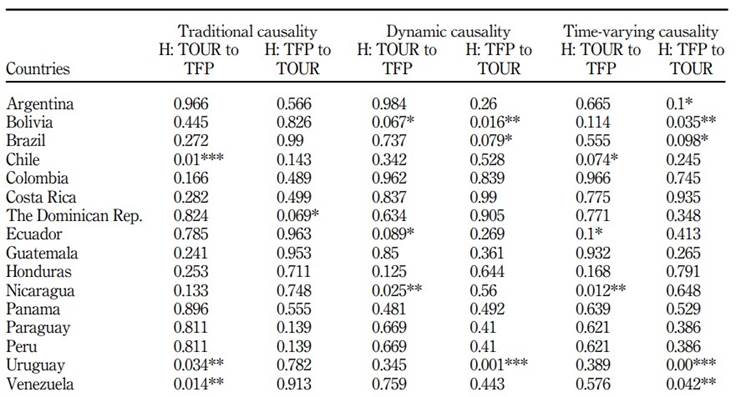
Concerning the findings of the causalities, the results are reported in Table 3. We will start our analyses with the classical Granger causality test. Particularly, watching the relationship between TFP and TOUR, we can observe only one unidirectional causality running from the TFP and TOUR (for the Dominican Republic) and three countries (Chile, Uruguay and Venezuela) with the opposite linkage. Moreover, we can notice that most of the results indicate the neutrality hypothesis among the variables for Argentina, Bolivia, Brazil, Colombia, Costa Rica, Ecuador, Guatemala, Honduras, Nicaragua, Panama, Paraguay and Peru whilst surprisingly we do not have a bidirectional relationship. Regarding the dynamic Granger causality, we can observe only one two-way causality (for Bolivia) and two cases of dynamic causalities running from the TOUR to TFP linkage (for Ecuador and Nicaragua), whilst the opposite causality is obtained for Brazil and Uruguay. In addition, as we mentioned in traditional Granger causality findings, most of the outcomes unveil the neutrality hypothesis among the covariates for Argentina, Chile, Colombia, Costa Rica, The Dominican Republic, Guatemala, Honduras, Panama, Paraguay, Peru and Venezuela. Lastly, observing the findings for the time-varying Granger causality framework, we can notice that the one-way causality from TFP to TOUR is obtained for Argentina, Bolivia, Brazil, Uruguay and Venezuela, while the reverse linkage is confirmed for Chile, Ecuador and Nicaragua. Furthermore, the neutrality hypothesis is divulged for Colombia, Costa Rica, the Dominican Republic, Guatemala, Honduras, Panama, Paraguay and Peru, while the two-way connection is not revealed. Although there is no study, to the best of our knowledge, which employed the TFP index (the majority used economic growth) to explore the linkage between TFP and TOUR, on one hand, these findings are in tandem with Brida and Risso (2009) for Chile and Croes and Vanegas (2008) for Nicaragua. On the other hand, our results are not in line with Brida et al. (2011) for Brazil, with Brida and Monterubbianesi (2010) and Brida et al. (2009) for Colombia, with Brida et al. (2010) for Uruguay and finally, with Lionetti and González (2012) for Argentina, Chile, the Dominican Republic, Nicaragua and Venezuela.
Discussion
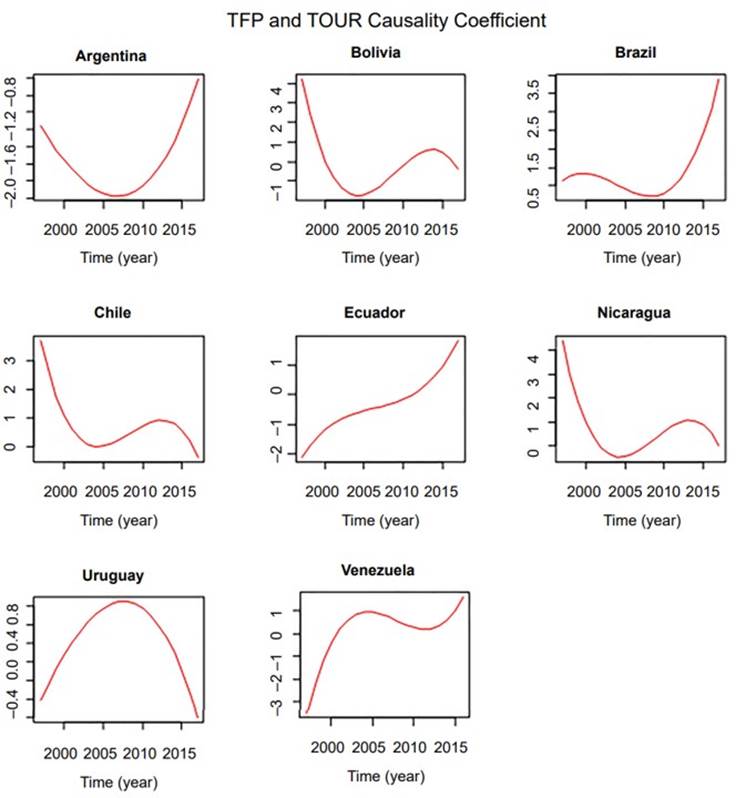
Since we get the statistically significant pairs of time-varying causality, we check the form of the curve for each country. As we stressed above, we used only the statistically significant pairs of time-varying causality between the two variables. Therefore, and according to Table 3, we consider eight countries: Argentina, Bolivia, Brazil, Chile, Nicaragua, Uruguay and Venezuela. The findings are pictured in Figure 1. Particularly, interesting to observe is that the validity of the U-shaped curve is confirmed solely for Argentina, inverted U-shaped curve for Uruguay while the rest of the countries depict N-shaped or inverted N-shaped curve.
5.1 Theoretical implications
The plot of U-shaped curve means that TOUR increased in Argentina since the TFP increased. Uruguay shows an inverted U-shaped curve, this sign implies when TFP increases at the same time TOUR decrease up to a point in time the threshold stage of TFP is came and then tourism is decreasing. Concerning the N-shaped form for Brazil, Ecuador and Venezuela, this sign insinuates that when TFP grows, tourism initial move upward, afterward decrease when the left turning point and lastly increase since it reaches the right turning point. In addition, the N-shaped curve depicts the positive statistically significant effect of the TFP on TOUR in the long run. Lastly and regarding the inverted N-shaped curve indicated in Nicaragua, Chile and Bolivia, this sign implies that when the TFP grows, tourism initial move downward, afterward rises when the left turning point and lastly decreases since it reaches the right turning point. In addition, the N-shaped curve depicts the positive statistically significant effect of the TFP on tourism growth in the long-run.
In respect of the policy perspective, our study contains evidence with clear implications for LACs. TFP and tourism policies should be coordinated because they affect each other. TOUR seems to have effects on TFP while it is also affected by it. Therefore, the intensity of TFP long-run impacts is found powerful for most countries. It implies that policymakers should attach more importance to TFP in terms of TOUR policies. Additionally, the outcomes offer a convincing case, and under certain circumstances as an exceptional case, for the use of policy instruments such as targeted investment, marketing and the support of tourism organizations focused on driving a tourism-led-based productivity and/or tourism programs and projects. With respect to the labor and capital productivity angle, policymakers (countries) collaborating with tourist companies, can adopt pre-employment knowledge, supplying employees with tourism-linked skills and training. Hiring people with competent abilities and experience in tourist companies is useful for accumulating human capital and ameliorating the increase in tourist productivity. Moreover, the tourism-linked substructure is probably to be upgraded, assisting the accessibility of tourist locations. Hence, countries may determine a crucial key by directly investing in the substructure. Furthermore, given the actuality that growth in productivity might come from technological advancements and a competitive environment, countries could offer subsidies to the tourism industry and stipulate tourism-related environmental standards to support the espousal of advanced technology and to promote a regular tourism market.
5.3 Future research agenda
Finally, academics could improve our empirical contribution with additional research on the association between the TFP and TOUR nexus by applying different econometric tools (such as quantile causality or quantile regression) or/and encompassing extra variables (exchange rate, trade or globalization, among others).
Conclusions
There are many studies in the tourism literature examining the link between economic growth and TOUR with different methodologies and time periods. However, the focus is more on economic growth and not economic development. Our study, first, employed TFP (economic development) rather than economic growth and second, we show that previous studies have mostly relied on the standard Granger causality test to examine the dynamic link between the variables under examination. Although the standard form of Granger causality has the advantage of dependence on the stochastic behavior of series instead of the specific structural model, it is not able to capture the time-varying nature of causal nexus among the variables. Another challenging issue regarding the application of the standard Granger causality framework for examining the dynamic linkages of the variables is the assumption of the parameter's stability. The test assumes that the parameters of the econometric model remain fixed over time. However, these issues could be moderated by a more stable Granger causality pattern. Hence, this research studies the connection between the TFP index and TOUR in LACs. To do this, we employ a data set of 16 LACs during the period 1995-2017 evaluating the time-varying causality of Ajmi et al. (2015). The nonlinear connection between these variables is confirmed for six countries. Precisely, studying the outcomes of the time-varying Granger causality, we can mention that the one-way causality from TFP to TOUR is obtained for Argentina, Bolivia, Brazil, Uruguay and Venezuela, while the opposite linkage is confirmed for Chile, Ecuador and Nicaragua. Finally, we investigated the graphs of the “curve causality”, and as it is demonstrated, our findings endorse the validity of the U-shaped curve for Argentina, inverted U-shaped curve for Uruguay, N-shaped curve for Brazil, Ecuador and Venezuela and inverted N-shaped curve for Bolivia, Chile and Nicaragua.
Notes
1. For an extensive literature review see, Pablo-Romero and Molina (2013) and Brida et al. (2016).
2. We discovered only two studies (Fayissa et al., 2011; Lionetti and González, 2012) which proved the tourism and growth nexus.
3. The period for Venezuela is from 1995 to 2016 due to the availability of the dataset.
4. http://datatopics.worldbank.org/world-development-indicators/
5. M- and B-splines functions are nominated by Eilers and Marx (1996).
6. We implemented welfare relevant TFP level instead of TFP and the results are almost the same with slight differences. (These results are available upon request).

