


 Inglés (pdf)
 Articulo en XML
 Referencias del artículo
 Enviar articulo por email
 Citado por SciELO
  Similares en
SciELO
Similares en
SciELO 
 Permalink
Nomenclature
ADF Augmented Dickey-Fuller
ARDL Auto-regressive Distributed Lag
BEKK Baba, Engle, Kraft and Kroner (1990) model
BRL Brazilian Real
BTC Bitcoin (Decentralized digital currency)
CNY Renminbi (Official currency of the People's Republic of China)
CUSUM Cumulative Sum
BRICS Brazil, Russia, India, China, and South Africa
DEM Deutsche Mark
ETH Ethereum
GARCH Generalized Autoregressive Conditional Heteroskedasticity
GBP Great Britain Pound
GSADF Generalized Supremum Augmented Dickey-Fuller
INR Indian Rupee
JPY Japanese Yen
MXN Mexican Peso
RTADF Right Tail Augmented Dickey-Fuller
RUB Russian Rubble/Rouble
SADF Supremum Augmented Dickey-Fuller
TRY Turkish Liras
US United States of America
USD United States Dollars
XRP Digital asset/currency created by Ripple
ZAR South African Rand
Introduction
Just like the production of essential goods and services are subject to human needs, the prices of essential commodities are largely associated with the dynamics of their supply and demand. İn essence, the availability and/or prices of the essential goods and services are associated with the dynamics related to economic uncertainties, natural events or disasters and market-related factors (Balcilar et al., 2016; Alola et al., 2019; Akadiri et al., 2020; Onifade et al., 2020; Akdag et al., 2021). Moreover, the monetary policies applied to one of the currency pairs or the macroeconomic consequences that may affect the currency, thus shaping the price trend of the currency pair. Most of the time, speculative balloons can lead to high pricing of commodities, securities and other financial items, thus causing the relevant financial value to exceed the basic value. In essence, this causes markets and investors to react faster than rising prices among other reasons. As a result of the extinction of the bubbles in question, it then prompts a rise in price situation against the markets and investors.
To date, world history has witnessed a handful of financial crises and the price bubbles that caused these crises (Kindleberger and Aliber, 2005). Chronologically, the most important price bubbles in the history of finance include the: Tulip Mania (1,636), Mississippi Bubble (1720), Great Depression (1929), Internet Bubble (2001), the Global Financial Crisis (GFC) of 2008-2010 and the Real Estate Bubble and Mortgage Crisis. For instance, the Tulip Mania is one of the most important examples of the price bubble as it is the first manipulative movement in history. In the European region, Tulip Mania especially influenced the Netherlands in 1,623, when the price of Tulip bulbs rose to 1,000 guineas, average annual wage was 150 guinea. Additionally, in February 1,637, resulting of the tulip bulb in Amsterdam, the price of a bourgeois house could be recorded to be about 5,200 guineas (Mazgir, 2007).
As a follow-up to the Tulip Mania, everyone was affected by the tulip bulbs, which led to a sharp rise in prices at the beginning of a great mania. Thus, because of the extinction of the bubble in prices, it reportedly caused a crisis that will continue to be remembered throughout Europe. In history, another important financial crisis caused by the price bubble is the 2008 GFC (Alola, 2020; Alola and Uzuner, 2020; Balcilar et al., 2020). Price bubbles, which became a very important issue in the aftermath of the 2008 global crisis, have become a popular research topic in the financial and academic circles. Especially the bubbles in housing prices and the extinction of these bubbles were seen as the main cause of the crisis. In the financial literature, firstly, the price bubbles in housing prices were emphasized, followed by the existence of the price bubble for the securities’ markets, cryptocurrencies, commodities and many different financial assets.
In the study by Phillips and Yu (2011), it opined that the bubbles are expressed as an increasing situation, moving away from the rapid and real values formed in asset prices. In the literature, many different financial and investment instruments related to the price bubbles are being investigated. While the study of price bubbles has been conducted for several economies across the globe including Evans (1986) for the United States of America (US) and the United Kingdom (UK), Wu (1995) for the US, UK, Germany and Japan, Case and Shiller (2003) for the US, Fernández-Kranz and Hon (2006) for Spain, Cheung et al. (2015) for digital or cryptocurrency, Kristoufek (2015) for digital or cryptocurrency, Landgraf (2016) in asset prices, Shi (2017) for asset markets, Fabozzi and Xiao (2019) for the US real estate market and Narta et al. (2018) in the Singaporean and Indonesian stock markets; the case of Turkey has been considered in the works of Altay (2008), Bozoklu and Zeren (2013), Afşar and Dogan (2018), and Uzuner et al. (2017). İn regard to the Brazil, Russia, India, China, and South Africa (BRICS) countries, the banking sector indicators such as the size of the financial intermediaries, domestic credit to the private sector and credit to deposit ratio are vital to the economic stability of the bloc countries (Guru and Yadav, 2019).
While the efforts to test the existence of price bubbles in financial assets increased rapidly (Deviren et al., 2014), different models are being employed to test the asset. For variance tests such as LeRoy and Porter (1981) and Shiller (1981), the first of the models aiming to detect price balloons, were used. Thereafter, other approaches such as Diba and Grossman (1988) and Hamilton and Whiteman (1985) have been explored. In the 2000s, Chow and cumulative sum (CUSUM) tests applied in Homm and Breitung's (2012) study became popular. Tests such as SADF and GASDF, which were first shown in the Phillips et al. (2011) study and developed by Phillips et al. (2015), are frequently mentioned in the price bubble test recently.
In this study, Supremum Augmented Dickey-Fuller (SADF) and Generalized Supremum Augmented Dickey-Fuller (GSADF) tests were applied to test the presence of price bubbles in BRICS member countries alongside Turkey while using the United States Dollar the indexed exchange rates. The group of countries: South Africa, India, Brazil, Russia and China, accounts for 40% of the world's population and accounts for 60% of the world's mineral reserves. The justification for examining the case of the BRICS economies is not limited to the fact that the BRICS's share of global output is forecasted at one-third by 2030 (or 45% of the world's gross domestic product (GDP) by about 2030 in price purchase parity term), the bloc occupies about 30% of the global territory, the BRICS accounts for about 17% of world trade and yielding about 4 trillion USD worth of foreign reserves (South African Government, 2021). This study considered the BRICS countries because they are commonly regarded as the world's leading developing economies. As originally noted by O'Neill (2001), the leading four (Brazil, India, Russia and China) are reportedly at a similar stage of advanced economic development. Thus, the current study considers Turkey alongside the BRICS economies because the significant improvement in the Turkish economy in recent years and that the Turkish Lira has remained one of the most vulnerable and volatile currencies among the leading developing states (E-7). Although, as one of the largest European Union (EU) neighbours, the Turkish currency reportedly lost almost half of its value in the last quarter of 2021, thereby causing, more devastating economic disruption.
Considering the importance of the BRICS economies as highlighted above, it is important to mention that the current study attempts to expand the financial literature for the BRICS countries from the following perspectives. As a first approach, the hypotheses for the existence of the price bubbles in the exchange rates of the BRICS and Turkish economies are tested. In a follow-up approach, the respective dates for the existing bubbles are also revealed, thus highlighting the severity of the occurrence of price bubbles and the associated events. By doing so, relevant policy recommendations for the examined economies are implied from the outlined results.
The remainder of this study is organized as follows: The next section presents the review of related literature that is presented in Section 2. Section 3 provides the data and methodological approach of the study. Subsequently, Section 4 focuses on the interpretation of empirical results. Finally, Section 5 renders the concluding remarks.
Literature review
In reviewing contextual studies, we outline both the theoretical and empirical related studies.
Theoretical insight
Following the use of the word “efficient market”, subsequent development of the phrase by the proponent has resulted in more theoretical discussion, thus the context of the Efficient Market Hypothesis in the literature (Fama, 1970). Given that an efficient market is associated with information that is often incorporated in market prices, the asset values are conditioned on the associated information. Thus, there is rationality in market prices while the unexpected changes associated with a change in price are unpredictable because of the relatively new information. Then, the unpredictability vis-a-vis irrationality account for the “random walk” theory is associated with asset prices, thus causing the characterization of the efficient market as weak form, semi-strong form and strong form (Clarke et al., 2001). According to the early studies of Shiller (1980), and Kindleberger and Aliber (2005), the deviation of market price from market fundamentals which is responsible for the market irrationality is a leading factor for large historical bubbles. Subsequently, price bubbles in assets such as stocks, house prices and exchange rates have been widely covered in several studies (Blanchard and Watson, 1982; Wu, 1995; El Montasser et al., 2016).
2.2 Review of empirical studies
In this section, a literature review is conducted in two different directions. The first part of the literature focuses on price balloons that may be associated with exchange rates, while the second part focuses on the studies that test price balloons that may occur in cryptocurrencies. Meanwhile, prior to the observance of bubbles, several underlying factors are associated with the market prices of assets such as the stocks, the real estate industry and other financial valuations (Huy et al., 2020a, 2020b, 2021).
In the Evans (1986) study, the existence of price bubbles for the Great Britain Pound (GBP)/USD exchange rate in the period 1981-1984 was tested. As a result of the findings, there is significant evidence of the price bubble for the GBP/USD exchange rate. Thus, the result claimed that the bubbles formed during the period 1981-1984 are associated with irrational expectations. Additionally, in the study of Wu (1995), price bubbles in exchange rates were tested by employing the Kalman filter method. However, they failed to establish a price bubble for GBP, USD and Deutsche Mark (DEM)/Japanese Yen (JPY). Meanwhile, Case and Shiller (2003) stated that bubbles in asset prices are caused by the rise of prices arising from the expectation of future price increases; while Jirasakuldech et al. (2006) also found the existence of a price bubble in exchange rates. As a result of the application of the co-integration analysis, Jirasakuldech et al. (2006) found evidence of a price bubble in US Dollar indexed exchange rates such as British Pound, Canadian Krone, Japanese Yen and South African Rand.
Furthermore, Mayer (2011) stated that if asset prices are volatile during the conjuncture period, they expectedly increase more than in the uptrend period and fall faster than expected in the downturn period, thus indicating the presence of a bubble in asset prices. In another study, Bettendorf and Chen (2013) tested the existence of a price bubble in the exchange rate. By employing the unit root tests approach, Bettendorf and Chen (2013) established the existence of speculative bubbles in the Sterling-Dollar exchange rate. Moreover, the existence of price bubbles was tested in the exchange rate price movements by El Montasser et al. (2016). The study employed the right-tailed unit root SADF and GSADF tests. Consequently, the result indicates that the price bubble for the Renminbi (CNY)/USD exchange rate was in the form of an explosion in 2005. Similarly, the study by Hu and Oxley (2017) examined the existence of price bubbles in exchange rates by applying the GSADF test. The study concluded that there is a price bubble in the USD/Mexican Peso (MXN) exchange rate over the period 1994-1995.
From the perspective of cryptocurrency, statistical evidence has also revealed that there are deviations from the basic value of prices for cryptocurrency such as the Bitcoin (BTC), thus suggesting the existence of bubbles in cryptocurrencies (Dowd, 2014; Cheah and Fry, 2015). For instance, Cheah and Fry, 2015) employed econometric tools to establish that the fundamental value of BTC is zero and its prices contain a considerable speculative component, thus suggesting that BTC markets are susceptible to bubbles. Similarly, Cheung et al. (2015), tested the existence of a price bubble for cryptocurrency by using the GSADF test approach and found that there are three large price bubbles for cryptocurrency. While Ceylan et al. (2018) affirmed the existence of price bubbles in most cryptocurrencies by using the GSADF test, Mete et al. (2019) used the SADF and GSADF tests and found that BTC, Ethereum (ETH) and ripple (XRP) all showed evidence of a speculative bubble.
Moreover, for the specific case of the BRICS countries, Mroua and Trabelsi (2020) examined the causal dynamics among the common financial indicators (the exchange rate and stock market indices). By utilizing the panel approaches of the generalized method of moments and the autoregressive distributed lag (ARDL) methods, the study revealed that exchange rate changes exert a significant effect on the previous and existing volatility of the BRICS stock indices. Additionally, with the ARDL approach, Mroua and Trabelsi (2020) found that movement in exchange rate exerts a significant short- and long-term effect on the stocks market indices for BRICS. For other similar developing countries, the dynamics associated with the financial markets have been investigated in the literature (Hung, 2019; Alola, 2020, 2021). For instance, Hung (2019) employed the vector autoregression with a bivariate GARCH-BEKK model approach to reveal that the Chinese market's volatility significantly affects other markets of concern. Importantly, the result offered that the stock markets were obviously inter-linked to the economic and/or financial crisis.
Besides the evidence of speculative bubbles associated with the examined currencies, the exchange rate has remained an essential indicator of the emerging economies such as Turkey and China. For instance, the studies of Kotil (2019) and Umar and Sun (2015), respectively, examined the significance of the exchange rate to the aspects of the Turkish and Chinese economies. Specifically, Umar and Sun (2015) applied the vector autoregressive approach which revealed that the index of the stock market is a significant determinant of the exchange rate movement in China where the exchange rate and stock market moves in the same direction. On the other hand, while examining the case of Turkey, Kotil (2019) investigated the causal nexus between export, import and exchange rate. Although the exchange rate has remained an all-time important indicator in the Turkish economy, the study revealed that export and import does not have Granger cause exchange rate at least at a statistically significant level.
Method
3.1 Data
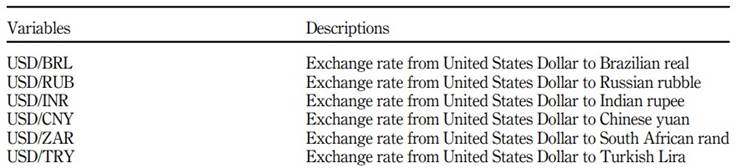
In this study, the BRICS countries and Turkey's dollar rate of monthly data between January 2002 and August 2019 date were used for the investigation (see Table A1). Since the largest data range for all countries occurred between relevant dates, the analysis was performed on the data between relevant dates. The website link investing.com is the source of the utilized dataset.
3.2 Procedure
In the analysis, SADF developed in the study of Phillips et al. (2011) and GSADF tests developed in the study of Phillips et al. (2015) were used. In the study of Diba and Grossman (1988), right-tailed unit root tests were proposed to identify potential rational bubbles in the stock market. As stated in the study of Gürkaynak (2008), it is inferred that standard unit root and co-integration tests are ex-post and the GSADF test is ex ante according to estimation procedure, thus the standard unit root tests may be insufficient to determine price bubbles.
In a study by Phillips et al. (2011), a SADF-based test was proposed to test the evidence of bubbles including the start and end dates for the speculative price increase. Additionally, Homm and Breitung (2012) conducted an effective simulation study demonstrating that the SADF test can be used to detect price bubbles. However, Phillips et al. (2015) reported that the SADF test has a limited ability to detect the presence of multiple bubbles and the GSADF test, which is more successful in detecting multiple bubbles, was proposed.
In this case, and considering the perspectives from the literature, both SADF and GSADF tests were used to analyse the subject, since they could provide a wider perspective. The analysis was carried out following the procedure proposed by Caspi (2016) by using the Right Tail Augmented Dickey-Fuller (RTADF) extension in EViews statistical program. The following regression model (1) is used for unit root calculations in SADF and GSADF test statistics (El Montasser et al., 2016).

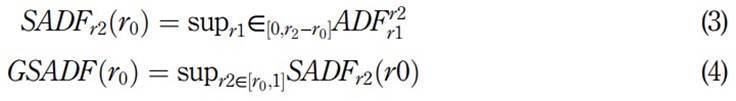
Standard ADF test Ƴ t-1 coefficient (λ) is divided into the standard error seλ by the following equation (2) is calculated by dividing.
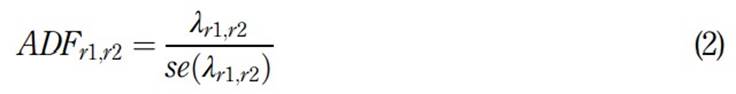
In order to calculate the GSADF test, the RTADF tests for multiple sub-samples will be deployed with the regression equation defined in equation (1). Both the endpoint (r2) and the starting point (r1) of the sub-samples change dynamically and the sub-samples result from differentiation from the zero point. When the sample range is evaluated between 0 and 1, the starting point of the sub-samples is between 0 and r 2 −r 0 . The endpoint is expected to take values ranging from r 0 to 1 while the r 0 is the minimum estimation window length.
SADF and GSADF test calculations can be expressed as follows (Phillips et al., 2015):
The null hypothesis that the price bubble exists in the SADF and GSADF unit root tests is H0: λ= 1 versus the alternative hypothesis H1: λ >1 which indicates that the price bubble does not exist in the unit root tests. In iterative regressions, the model expressed in equation (1) is repeatedly estimated using subsets of sample data, which is increased by one observation each, pass (Phillips et al., 2015).
Results
As a preliminary estimate, the statistical properties of the dataset are estimated. Therefore, the descriptive statistics related to the variables used in the analysis were calculated and the relevant statistics are given in Table 1.
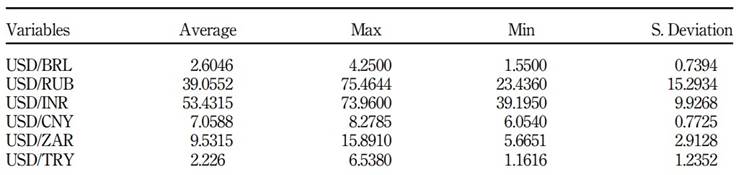
When the descriptive statistics in Table 1 are evaluated, it is seen that the highest volatility in the relevant exchange rates is realized in USD/RUB (exchange rate from United States dollar to Russian rubble) and the lowest volatility in USD/BRL (exchange rate from United States dollar to Brazilian real) exchange rates. The results of SADF and GSADF tests are now performed to determine the existence of balloons in the relevant exchange rates given in Table 2.
Table 2 SADF and GSADF test results
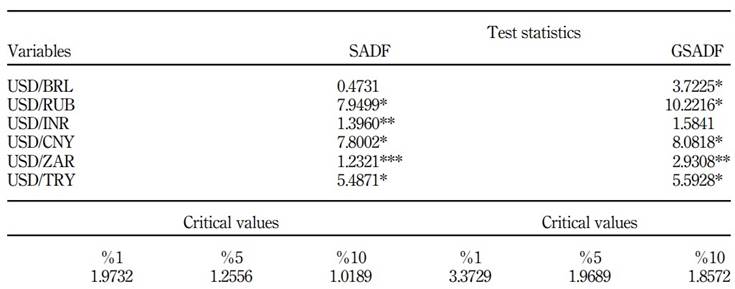
Note(s): * 1%, ** 5% and *** 10% are significant. Critical values were obtained from Monte-Carlo simulations with 1,000 replicates. Initial window size 0.10 (21) is taken Source(s): Own elaboration
According to the SADF test results in Table 2, USD/RUB, USD/INR, USD/CNY, USD/ZAR and USD/Turkish Liras (TRY) exchange rates and GASDF test results indicate USD/BRL, USD/RUB, USD/CNY, USD/TRY, there are evidence of price bubbles due to speculative movements in South African Rand (ZAR) and USD/TRY exchange rates. However, the SADF and GSADF test results are different for USD/BRL and USD/INR.
Phillips et al. (2015) stated that the SADF test may be inadequate if there is more than one balloon and GSADF tests may be more successful in this case. The dates of the price bubbles formed in the relevant exchange rates regarding the GSADF test results are given in Table 3.
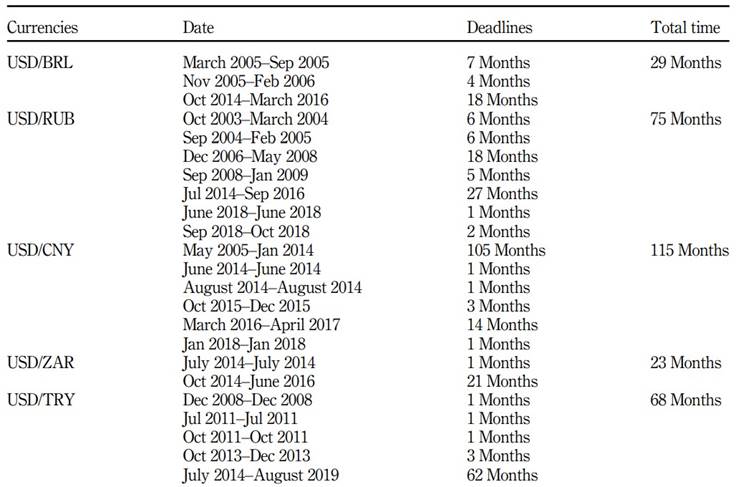
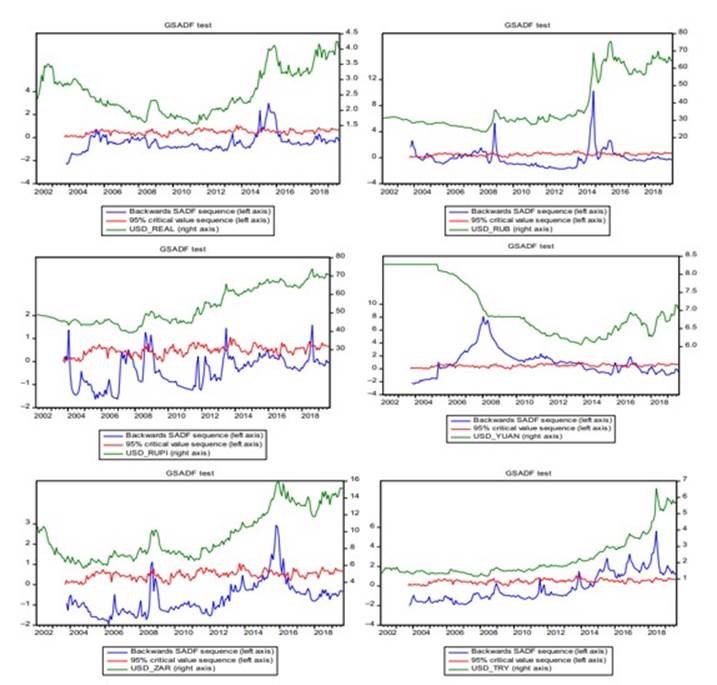
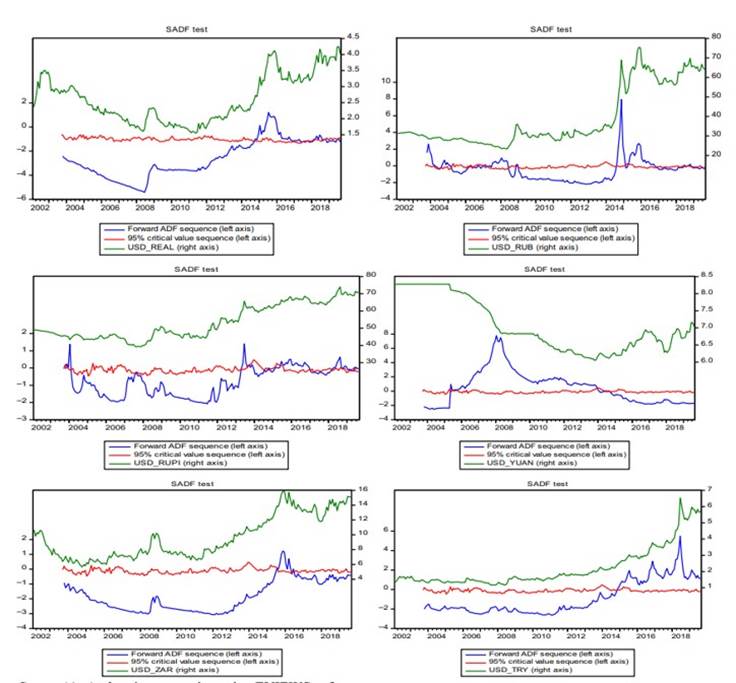
When the results in Table 3 are evaluated, the USD/CNY rate is 115 months with the longest price bubbles and followed by the USD/ZAR rate with 23 months. The reason for the longer period of the bubble in the case of the USD/CNY rate could be largely ascribed to the heightened level of economic, financial and global penetration of the US and Chinese markets. For want of economic strength and dominance, the Chinese markets are currently extending influence and dominance in both the Asian and African regions but facing stiff competition in the well-established European and North American markets. Thus, the Chinese Yuan is expectedly vulnerable to the movements in the world's major currencies such as the USD and the Euro. However, the best economic intuition for the long period of bubbles for the USD/ZAR rate is not unrelated to the recent level of economic instability experienced in South Africa arising from the country's past and present political events. Moreover, when the results are evaluated in general, it is observed that balloons exist for some exchange rates for the examined countries, especially in 2014, 2015 and 2016. In general, these observations are further supported by the inferences from the trends illustrated in Figures A1 and A2.
Discussion
Theoretical implications
In theory and practice, this study is of significant relevance to the literature on the efficient market hypothesis. In theory, the study further reveals the vulnerability of the valuation of assets, stock market, foreign exchange trading and international trading of goods and services to the deviation of currency rates from market fundamentals. Moreover, the socio-economic relevance of the concerned countries suggests that the implied policies from this study are potentially suitable in other economies across the globe.
In the case of future studies, conducting analyses separately for developed and developing countries will contribute to the literature in terms of a more generalized policy recommendation. Considering the importance of energy to the world economy, similar studies could be carried out in the future, especially for the world's major energy-producing and consuming economies such as the Organization of the Petroleum Exporting Countries.
Policy implications
The current study posits a significant policy framework for the BRICS countries and the Republic of Turkey, considering the position of the BRICS and Turkey, the results of the study hint at the economic vulnerability of those countries that are heavily dependent or reliant on the exchange of foreign goods and services or foreign trade in terms of energy, raw material and technology. In this context, it may be recommended as a policy to devise trade acts that are designed as pre-emptive measures against deliberate exchange rate manipulation or artificial speculative movements. The world's major and developing economies such as the US, UK, Germany, Japan, the BRICS and Turkey among others could also assume an effective role in the foreign exchange market by applying hedging methods with the use of derivative products such as hedging against exchange rate risk by closer monitoring of the exchange rate movements.
Conclusions
Price increases due to speculative movements in the prices of investment instruments traded in financial markets are one of the important factors destabilizing the related markets. The price bubble, which is expressed as exceeding the real value of assets' prices, is also caused by speculative movements. In this context, the existence of balloons in asset prices has continued to be the subject of research among scholars and policymakers. Thus, in this study, the focus is aimed to test the existence of price bubbles in exchange rates for the BRICS economies and Turkey.
Among other things, the BRICS economy is expected to account for about one-third of the world's GDP by 2030 (or 45% of the world's GDP by about 2030 in price purchase parity). For this purpose, the BRICS countries in addition to Turkey and the USD exchange rate monthly data between January 2002 and August 2019 have been tested with SADF GSADF unit root tests. According to the GSADF test results, it is concluded that there are price bubbles in the dollar exchange rate of other countries except for the USD/INR exchange rate. As the related countries are classified as developing countries in terms of their structure and economic capacity, they may be expected to be subject to speculative exchange rate movements. Speculative movements in exchange rates may cause serious problems to national economies even as studies have revealed damaging economic downturn resulting from the spill over effects. Although the economies of China, India and Russia are relatively stable so their respective currencies, less can be said for the TRY. Therefore, the findings in this study could well guide policymakers, especially in Turkey and South Africa for a more fine-tuned exchange rate regime.

