


 Inglés (pdf)
 Articulo en XML
 Referencias del artículo
 Enviar articulo por email
 Citado por SciELO
  Similares en
SciELO
Similares en
SciELO 
 Permalink
Introduction
he efficient market hypothesis (EMH) postulates that an efficient market represents that all marketable securities and assets reflect newly released information immediately so that it is impossible to beat the market by using information and making extraordinary profits. The basic tenet of EMH is that stock returns are random in an efficient market. Second, investors cannot earn excess profits in an efficient market.
There has been a plethora of research on testing the EMH for over eight decades (Brown, 2020; Chan et al., 1997; Degutis and Novickytė, 2014; Fama, 1970; Jain et al., 2020; Kelikume et al., 2020; Patel et al., 2018; Samsa, 2021; Shiller, 2003; Vidya, 2018). In addition, extensive academic research on EMH documented consensus that no one can make money by trading securities when the markets are efficient. However, the EMH assumes that capital markets come to equilibrium because the market is dominated by “informed and rational agents,” which may not be accurate. Therefore, there are many situations where EMH fails. That is the reason why several scholars time and again attempt to test EMH and see whether the market is efficient in weak, semi-strong and strong forms. Our study also takes the same path and attempt to test the EMH.
We are interested in studying EMH in the context of India because of the following reasons. First, extant research documented that the results were inconclusive, as some studies supported, and most studies did not support random walk theory. In this study, we attempt to examine the market efficiency in the Indian market during the decade 2010-2020, a period characterized by remarkable growth in the Indian economy because of increasing privatization and technological advancements. With the technology change, it is assumed that information is readily available to the investors to accurately predict the stock prices based on the available information immediately. It is also believed that stock prices reflect such information. So, the rationale for this study stems from the changing financial market, changing investors' behaviour, technological developments and the incredible rate of economic growth in India.
The second reason for this study is, in the world of availability of complete information, there is no reason why EMH should fail because the present-day prices reflect all the available information. So then, what are the reasons why EMH fails? Scholars in behavioural finance (e.g. Malkiel, 2003) argue that security prices reflect the behavioural intentions of investors. The third reason why we want to test EMH in India is that during the decade of 2010-2020, several economic reforms took place, and the Indian economy was characterized by phenomenon growth, though recession occurred for a brief period (around 2008-2009 because of the crash of real estate bubble in Western countries). Finally, we selected the Bombay Stock Exchange (BSE) in our study because of several reasons. First, BSE was established in 1875 and is the oldest stock exchange in Asia. Second, located in Dalal Street of Mumbai, BSE represents the financial capital of India. Third, BSE is the fastest, with a speed of around six microseconds, in the world accounting for speedy transactions. So, with these novel ideas, this study is conducted. In this paper, in the literature review, we explain the evolution of EMH and present the modern approach of EMH, followed by testing the EMH in the context of the Indian Stock market.
Literature review
After the formal introduction of EMH in the 1970s, Grossman (1976) has outlined the market efficiency paradox because of inconclusive results. The basic argument in the paradox is that the greater the belief in market efficiency by investors, the lesser the market efficiency. The intuitive logic behind this inefficiency is that if the investors believe that market is efficient, they will become lazy to collect information, which leads to market inefficiency. Though EMH has remained one of the most controversial research areas in finance and economics, some researchers argue that theory can be considered “half-true” (Shiller, 2003), while the line of argument is that today's stock prices cannot determine the stock prices tomorrow because of volatility and information asymmetry. Therefore, contemporary researchers focus on analysing the stock prices in the presence of (vs absence) of information and adjusting for the announcements (such as mergers, amalgamations, stock splits) (Jain et al., 2020; Parthasarathy, 2016). In one of the studies, Fama and French (1988) argued that risk taken depends less on the company size and market return. Recently, some researchers focused on the “value effect” and documented that return was not necessarily associated with the amount of risk taken. Amid arguments in favour of EMH and contradictions against EMH, we test the hypothesis in the context of the Indian stock market in this study. As explained before, three forms of market efficiency were weak, semi-strong and strong. A market is said to be efficient when investors can predict future market values of individual securities based on the information available freely to all rational participants. The weak form represents a random walk where one cannot make profits by investing in the stocks where prices reflect perfect information. In the semi-strong form, the prices of financial assets reflect the available information in the market; but, in addition, prices change rapidly without any bias to new public information. The operational implication is that in semi-strong form, the investor cannot split the stock to obtain profitability significantly higher than they can achieve in a randomized portfolio of assets (Samsa, 2021).
There are several studies conducted in the Indian context. For want of space, we mention only a few for reference. In the latest study by Jain et al. (2020) conducted on the efficiency of the stock market in India, from April 2010 to March 2019, based on BSE and National Stock Exchange, it was revealed that the Indian stock market is weak-form inefficient and therefore can be outperformed. In another study by Vidya (2018), it was found that changes in stock market prices are random, and the market is efficient in the weak form. By performing runs test, Patel et al. (2018) found that from April 2015 to March 2018, the three-year daily closing points reveal that market is not efficient to adjust rapidly to the news, thus allowing the investors to outperform, especially when they keep in touch with the changes.
The objective of the study is to demonstrate whether the Indian stock market is weak-form efficient empirically. We determine this by examining whether the return series is stationary or not and identifying whether markets follow a normal distribution and by the descriptive statistics for BSE broad market indices for the return series. In this study, we have the following hypotheses.
H01.The return series of BSE broad market indices are normally distributed.
H02.There is no stationarity in the return series of BSE broad market indices.
H03.The BSE broad market indices follow a random walk.
Method
3.1 Research design
To examine the weak-form market efficiency in the Indian stock market, we have chosen the BSE broad market indices. As of 25 March 2021, BSE has 19 broad market indices and out of which nine indices were selected in this study covering the study period from 01 January 2011 to 31 December 2020. The selected indices are Standard and Poor Bombay Stock Exchange Sensitivity Index (S&P BSE SENSEX), Standard and Poor Bombay Stock Exchange All Capitalization (S&P BSE AllCap), S&P BSE 100, S&P BSE 200, S&P BSE 500, Standard and Poor Bombay Stock Exchange Large Market Capitalization (S&P BSE LargeCap), Standard and Poor Bombay Stock Exchange Mid-Capitalization (S&P BSE MidCap), S&P BSE SENSEX Next 50 and S&P BSE SmallCap. We selected nine indices because only these nine indices are available, and the information about the other ten indices is not available.
3.2 Data collection
The data collected for this empirical study are daily open, high, low and closing prices of BSE broad market indices. Instead of using the closing price itself, the researcher used the average of these four prices. The logic behind the average values of these four prices is that volatility in changes in prices is controlled to some extent. While prior researchers have used only closing prices, assuming trading is done at the closing price, Lodha and Sora (2015) recommend using the average of the four prices to nullify the fluctuations, and volatility is controlled at least partially. All the data have been collected from the official website of the BSE.
3.3 Analytical procedure
The tools used in this study are: (1) unit root test (The Augmented Dickey-Fuller ((ADF)) test to check the stationarity of time series, (2) descriptive statistics (average monthly returns, maximum, minimum, standard deviation, skewness, kurtosis and Jarque-Bera Test), (3) autocorrelation (measuring the linear relationship between lagged values of a time series) and (4) runs test (to check whether observations vary around a constant mean, have constant variance and are probabilistically independent). To calculate the daily returns, we used the formula ((LN (Today closing price/yesterday closing price) ). These tools have been used by several researchers in the past (Degutis and Novickytė, 2014; Harshita et al., 2018; Titan, 2015). The procedures and techniques used in this study are consistent with the earlier research in the literature.
The ADF statistics used in the test should be a negative number, and the more the negative number, the stronger the rejection of the null hypothesis that there is a unit root. The runs test, a non-parametric test, is concerned with the price changes rather than the magnitude of price changes. It just considers whether the series consists of increasing values or decreasing values. The null hypothesis of the runs test is that the data set is from a random process.
Results
First, we examined the descriptive statistics. Table 1 captures the results of descriptive statistics for BSE broad market indices. For the time-series data, it is essential to check the normality of the data which can be found by observing the descriptive statistics. Therefore, we did a preliminary analysis of the descriptive statistics, namely, mean, standard deviation, variance, minimum, maximum, skewness and kurtosis. The mean of BSE SENSEX and BSE 200 shows the maximum mean return of (0.0340). In order that the distribution is normal, the condition is that both skewness and kurtosis must be equal to 0 and 3, respectively. As can be seen from Table 1 , the value of skewness of the returns was found to be negative for all indices and therefore the distribution of the daily returns was asymmetrical. The value of Kurtosis is greater than 3 (which represents Leptokurtic distribution) for all the indices. Based on these descriptive statistics, we reject H01 and conclude that the distribution of returns is not normal.
Table 1 Descriptive statistics for BSE broad market indices
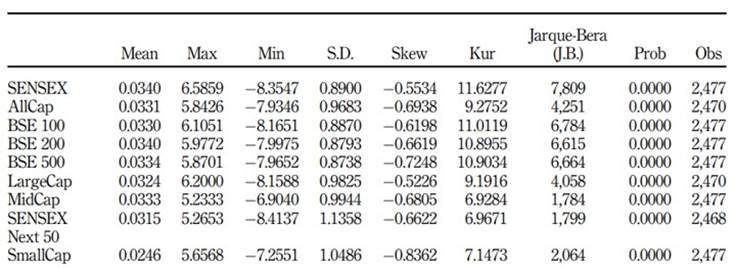
Note(s): AllCap, All Capitalization; BSE, Bombay Stock Exchange; LargeCap, Large Market Capitalization; MidCap, Mid-Capitalization; S.D., Standard Deviation; SENSEX, Sensitivity Index Source(s): Compiled from EViews 10
To test the stationarity in the BSE broad market indices, an ADF test was conducted. Table 2 displays the results of the ADF test. The ADF test statistic values of intercept are less than critical values at a 1% significance level. Hence, H02 was rejected and concluded that there is no stationarity in the return series of BSE broad market indices. These results show that data has exhibited stationarity.
Table 2 Results of augmented Dickey-Fuller test for BSE broad market indices
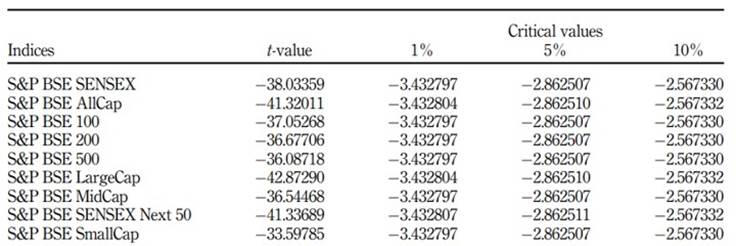
Note(s): BSE, Bombay Stock Exchange; S&P BSE AllCap, Standard and Poor Bombay Stock Exchange All Capitalization; S&P BSE LargeCap, Standard and Poor Bombay Stock Exchange Large market Capitalization; S&P BSE MidCap, Standard and Poor Bombay Stock Exchange Mid-Capitalization; S&P BSE SENSEX, Standard and Poor Bombay Stock Exchange Sensitivity Index; SENSEX, Sensitivity Index
Source(s): Compiled from EViews 10
4.1 Autocorrelation
There are 16 lag periods associated with autocorrelation for all the indices (in Tables 3-11).
The results of autocorrelation for S&P BSE SENSEX are presented in Table 3.
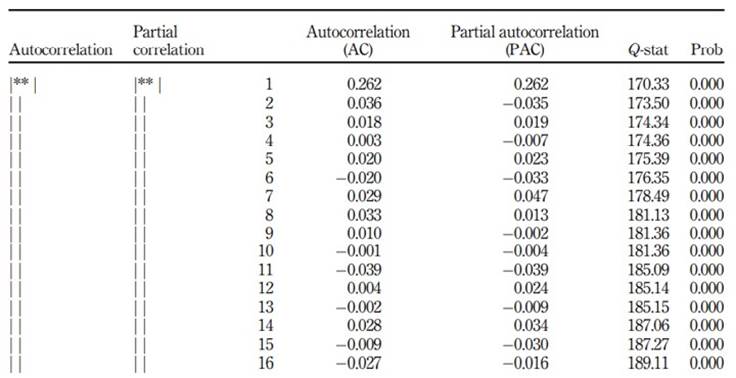
The first lag depicts an autocorrelation of 0.262 (Q-statistic = 170.33, p < 0.05), suggesting that the stock market in India does not follow a random walk. It is also interesting to note that the autocorrelation values for the lags 6, 10, 11, 13, 15 and 16 were negative (p < 0.05) and these results support that stock returns are not random.
The results of autocorrelation for S&P BSE AllCap are shown in Table 4.
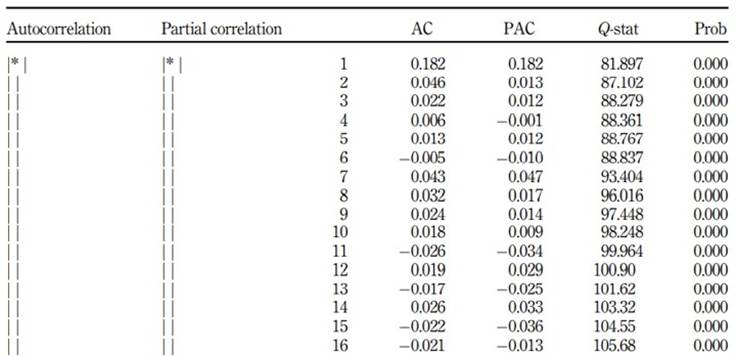
As shown in Table 4, the first lag shows an autocorrelation of 0.182 (Q-statistic = 81.897, p < 0.05) which suggests that stock returns in the Indian stock market do not follow a random walk. Further, the lags 6, 11, 13, 15 and 16 showed negative autocorrelations (p < 0.05) corroborating that the stock returns are not random.
The results of autocorrelation for S&P BSE 100 are exhibited in Table 5.
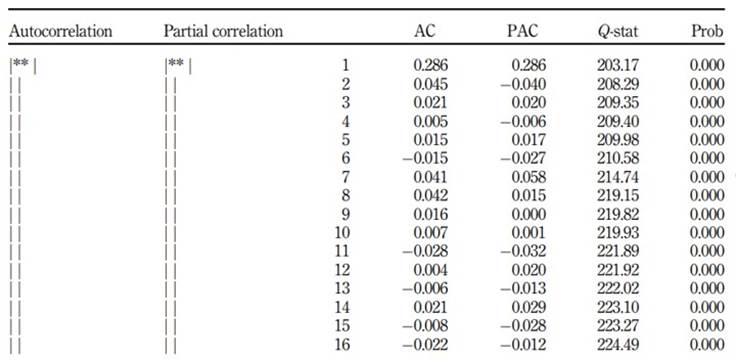
As can be seen in Table 5, there are 16 lag periods related to the autocorrelation test. The first lag depicts an autocorrelation of 0.286 (Q-statistic = 203.17, p < 0.05), and the lags 6, 11, 13, 15 and 16 had negative autocorrelations (p < 0.05). These results suggest that stock returns on the Indian stock market are not random.
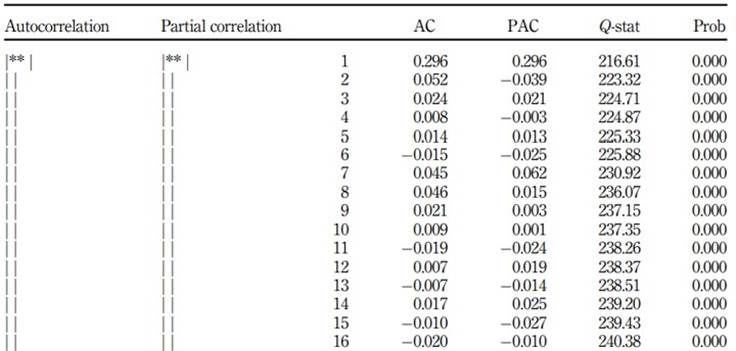
As presented in Table 6, there are 16 lag periods associated with the autocorrelation test. The first lag depicts an autocorrelation of 0.296 (Q-statistic = 216.61, p < 0.05), and the lags 6, 11, 13, 15 and 16 had negative autocorrelations (p < 0.05). These results indicate that stock returns in the Indian stock market are not random.
The results of autocorrelation for S&P BSE 500 are presented in Table 7.
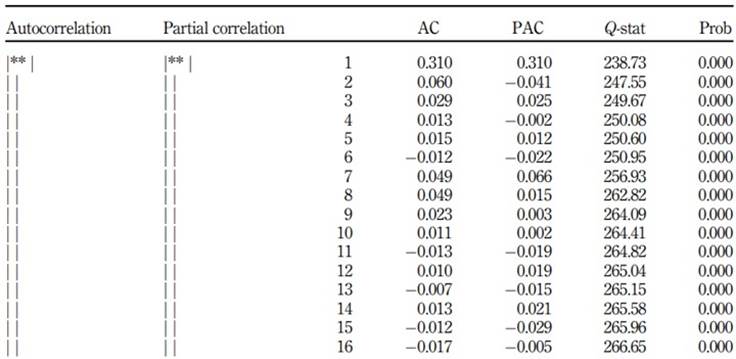
As can be seen in Table 7, the first lag depicts an autocorrelation of 0.310 (Q-statistic = 238.73, p < 0.05), and the lags 6,11,13,15 and 16 showed negative autocorrelations (p < 0.05). These results corroborate that stock returns in the Indian stock market do not follow a random walk.
The results of the autocorrelation test for S&P BSE LargeCap are detailed in Table 8.
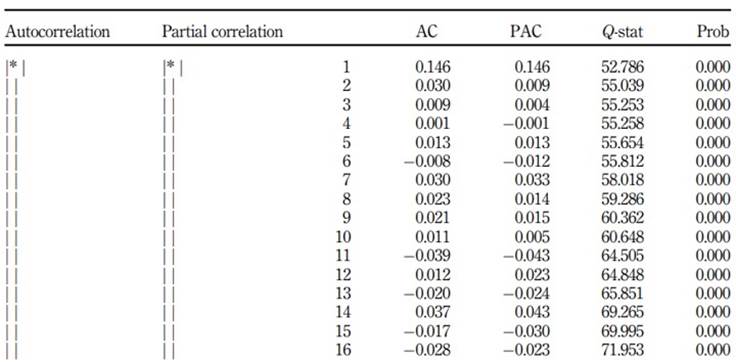
As detailed in Table 8, the first lag depicts an autocorrelation of 0.146 (Q-statistic = 52.786, p < 0.05), and the lags 6, 11, 13, 15 and 16 had negative autocorrelations (p < 0.05). These results indicate that the stock returns of the Indian stock market do not follow a random walk.
The results of the autocorrelation test for S&P BSE MidCap are presented in Table 9.
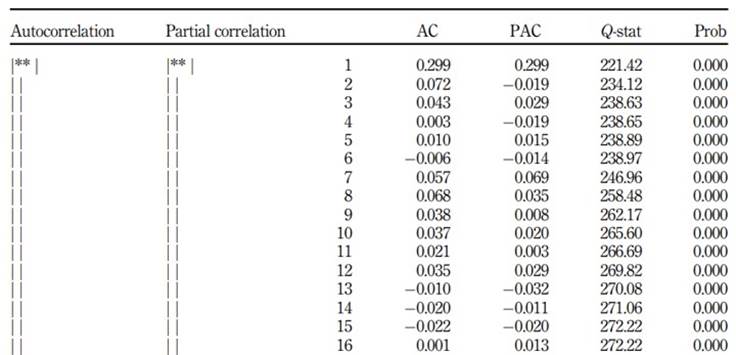
As shown in Table 9, there are 16 lag periods related to the autocorrelation test. The first lag depicts an autocorrelation of 0.299 (Q-statistic = 221.42, p < 0.05), and the lags 6, 13, 14 and 15 had negative autocorrelations (p < 0.05), thus documenting that stock returns in the Indian stock market are not random.
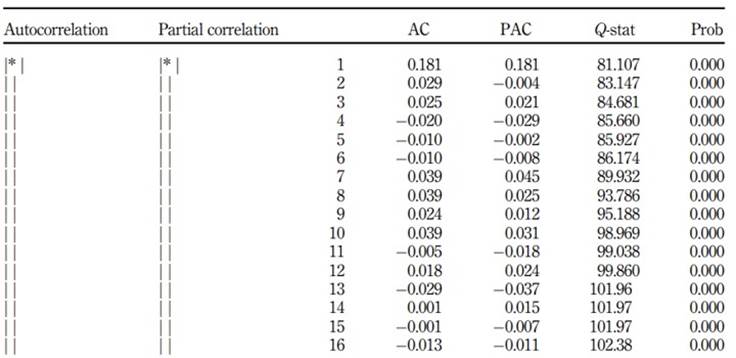
The results of the autocorrelation test for S&P BSE SENSEX NEXT50 are presented in Table 10.
Table 10 The results of autocorrelation test for S&P BSE SENSEX NEXT 50
Source(s): Compiled from EViews 10
As can be seen in Table 10, the first lag depicts an autocorrelation of 0.181 (Q-statistic = 81.107, p < 0.05), and the lags 4, 5, 6, 11, 13, 15 and 16 all showed negative autocorrelations (p < 0.05). These results reveal that stock returns on the Indian stock market are not random.
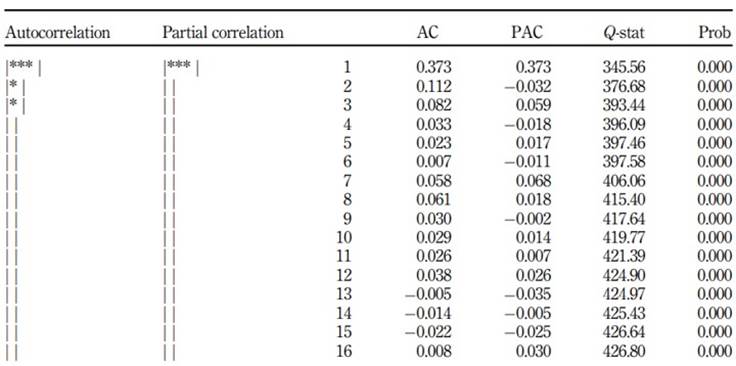
Table 11 shows the results of the autocorrelation test for S&P BSE SmallCap.
Source(s): Compiled from EViews 10
As Table 11 details, the first lag depicts an autocorrelation of 0.373 (Q-statistic = 345.56, p < 0.05), and the lags, 13, 14 and 15 showed negative autocorrelations (p < 0.05). The results document that stock returns on the Indian stock market are not random.
The results of runs test for BSE broad market indices are exhibited in Table 12.
Table 12 Results of runs test for BSE broad market índices
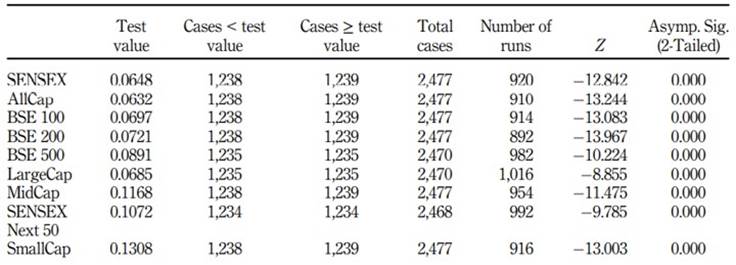
Note(s): AllCap, All Capitalization; BSE, Bombay Stock Exchange; LargeCap, Large Market Capitalization; MidCap, Mid-Capitalization; S.D., Standard Deviation; SENSEX, Sensitivity Index Source(s): Compiled from EViews 10
As shown in Table 12, the Z value negative for all the BSE broad market indices and found that the critical value of Z for 95% level of confidence is ± 1.96. Hence, the null hypothesis, i.e. BSE broad market indices follow a random walk is rejected at a 5% level of significance. Moreover, the p-value is also 0.000 which is less than the alpha (0.05), and therefore, the null hypothesis is rejected. The runs test of this study indicates that BSE broad market indices do not follow a random walk and it is evident that the Indian stock market is in weak-form inefficient.
5. Discussion
The objective of this study is to test the EMH in the Indian stock market. The rationale for this study stems from the fact that though several studies on EMH were conducted in India, the results were mixed. This prompted us to study the EMH, especially during the last decade (2010-2020), a period characterized by unprecedented economic changes, and the Indian economy has been on the growth track. Our results were consistent with most of the previous studies. Our results are fascinating because even when much information is available because of technological improvements and transparency in the data, the EMH does not hold good.
First, the results indicate that the value of skewness returns distribution was negative for all indices. It is documented that the distribution of the daily returns is asymmetrical nature. The value of Kurtosis is greater than 3, representing Leptokurtic distribution for all the indices. The distribution is, therefore, was not normally distributed (H01). The autocorrelation test reveals that the stock returns of the Indian stock market do not follow a random walk for all the indices. Second, the findings from this study indicated that the ADF test statistic values of intercept are less than critical values at a 1% significance level. Hence, the null hypothesis is rejected, and the results reveal that data has exhibited stationarity in nature (H02). When the data are non-stationary, the time series contains unit root implying that the mean, variance and covariance are not constant over time. The ADF statistic contains significant negative values and corroborates that the series does not contain a unit root. If data contains the unit root, the data follows a random walk. The results from this study indicate that the unit root is not present, and the data showed stationarity. Finally, the runs test of this study indicates that BSE broad market indices do not follow a random walk, and it is evident that the Indian stock market is as weak-form inefficient (H03). To sum, the results from our study do not support EMH as evidenced by critics of the theory. Asymmetrical distribution, Leptokurtic distribution and the runs test result show that BSE broad market indices do not follow a random walk. Therefore, the Indian stock market is weak-form inefficient.
5.1 Theoretical implications
The study has several theoretical implications. First, the results add to the growing body of literature on EMH, and the results are consistent with most of the earlier studies. Second, though some studies in the past have shown different and opposite effects (see Tables 1 and 2 ), our study provides a fresh look at the EMH during a decade of 2010-2020. Most importantly, the results from this study corroborate the findings conducted a decade back that tested the weak form of market efficiency of stock market returns in 14 countries (Pakistan, India, Sri Lanka, China, Korea, Hong Kong, Indonesia, Malaysia, Philippines, Singapore, Thailand, Taiwan, Japan and Australia), which documented that stock prices do not follow random walks in all countries of Asian-Pacific region (Hamid et al., 2010). Therefore, investors in these countries employed strategies of the arbitrage process to enjoy the stream of benefits. Thus, our results are consistent with the previous studies and vouch for the failure of the EMH hypothesis.
Third, from the theoretical standpoint, the results suggest diagnosing the plausible reasons for the failure of EMH in the Indian context, besides all other countries in the Asia-Pacific region. We argue that two fundamental reasons for the failure of EMH in the Indian context: the unpredictability of investors' behaviour and uncertainty about the investment. Many studies in the Western countries and the Middle East have concluded that the market should be seen in only relative terms. There is consensus among academicians that EMH fails to explain the excess volatility in security prices, unexpected bubbles in the stock market, irrational customers and overreactive behaviour. While analysing market efficiency, academicians need to consider the dynamics of changing markets that may tilt the results and vouch for EMH failure.
5.2 Practical implications
The research findings of this study have several implications for the stakeholders, including the stockbrokers and investors. First, the results reported in this study portrayed that the stock market in India exhibited the weak-form inefficient; the investment brokers and investors should exercise caution before selecting their investment portfolios. In India, being a thickly populated developing country, there is a wide variety of investors with varying financial requirements. Some investors seek a long-term return on their investment, whereas some prefer to have secured returns every month. Some investors are risk-takers, whereas some are risk-avoiders. Since people with different portfolio requirements influence the stock market, behavioural finance scholars suggest examining the effect of personality factors on investment behaviour. For example, some researchers documented that the personality characteristics of individuals have a significant impact on investment behaviour (Isidore and Christie, 2017; Sadiq and Khan, 2019). Second, financial literacy plays a vital role in investment decisions. Therefore, in addition to the technical analysis of the stock market, the analysts need to consider the level of financial literacy, information access, subjective financial knowledge, risk propensity, etc., that may profoundly impact investor behaviour. As provided in this study, the results from stock market analysis guide the investors in making decisions and not getting lured by false promises of stockbrokers (Aren and Aydemir, 2015; Barber et al., 2021).
The findings from the study help investors to make correct investment decisions. The effectiveness of investment decisions largely depends on market efficiency and the investors' financial knowledge and various investment opportunities with varying degrees of return on investment. Although theoretically, rational decision-making considers identifying multiple available alternatives and choosing suitable options, it is not possible in reality because of information asymmetry and market anomalies (Sitkin and Weingart, 1995), and investors make decisions based on the available information. Therefore, failure to consider the market anomalies may result in flawed decision-making. Moreover, in the present-day technological sophistication where information is readily available from multiple sources, it is expected that investors will have complete information. Despite this, the reasons for the failure of EMH need further investigation. Investors diversify their investments based on their financial knowledge, and available empirical evidence shows that increased financial knowledge influences financial management attitudes, resulting in healthy financial behaviours (Borden et al., 2008).
5.3 Future research agenda
This study offers several avenues for future research. The results from this research vouch against the EMH and call for further studies to identify the reasons for the rejection of EMH. Though it was documented that in Asian countries, stock markets failed to support EMH, and the researchers explained the possible causes for lack of support for EMH, the information was not adequately explained. During this study period (2011-2020), the market did not exhibit high volatility, and it is suggested to identify the reasons for not supporting the well-established random walk theory. As we omitted 11 indices, future researchers can focus on those indices to see if the results from the study can be replicated. Second, future research can focus on liquidity's role in asset pricing in the stock market (Miralles-Quirós et al., 2017 ) and see how liquidity affects the EMH in the Indian stock market. Third, sometimes the investors may make frugal decisions, either lack information or habituate to making fast decisions (called heuristic) that challenge the EMH. The essence is that decisions taken by irrational investors may lead to inefficiencies in the stock market (Akerlof and Shiller, 2010; Lobao et al., 2017). Future researchers can also throw light on the effect of heuristic decisions made by investors on the efficiency of the stock market. Finally, as financial literacy plays an essential role in the investor's behaviour, it would be interesting to put on the agenda of future research to study the impact of financial literacy and financial illiteracy on the effectiveness of the stock market (Rasool and Ullah, 2020).
6. Conclusions
The basic tenet of EMH is that if the stock market is working efficiently, the prices will follow a random walk, and the prices will reflect the intrinsic values, and no one can benefit from trading. However, there is the possibility that investors may be reluctant to agree with this hypothesis. Hence, some investors tend to buy stock, and some others may sell the stock so that the price is not affected significantly (Latham, 1985). Amid several studies that have been conducted in India, this study was a modest attempt to empirically examine whether the stock market in India is weak-form efficient. The data was collected (daily open, high, low and closing prices) on nine BSE broad market indices and analysed using the standard tests (unit root, descriptive statistics, autocorrelation and runs test) covering the period from 1 January 2011 to 31 December 2020. The results did not support random walk theory, thus contributing to supporting the theory against EMH. Therefore, it is concluded that the Indian stock market, based on the results from the study, is a weak-form inefficient.
EMH proposes that security prices reflect all the available information. If this hypothesis is true, the asset managers need to demonstrate extraordinary skills to convince the investors that the recommended stock outperforms other securities (Brown, 2020). Since the rapid growth of technology makes information accessible in no time, prices must reflect all information. EMH must be more valid in the present-day context than when Fama (1970) postulated the hypothesis. While the academicians do not consider the costs involved in acquiring information, the investment analyses do think the cost involved, and hence Fama (1970) argued that prices reflect the information only to the extent the expenses do not outweigh the benefits. One of the implications of EMH, as critics argue, is that there will be equilibrium in capital markets because of the presence of rational and informed agents. However, in real life, not all traders are perfectly rational. So, in the imperfect world, as behavioural financial scholars contend, EMH is valid only in theory (in spirit) but not accurate in practice. Some examples are that the financial crisis around 2008 around the world was a total failure of EMH, as the stock market largely depends on behavioural needs rather than financial arithmetic (Malkiel, 2003). As things stand now, as there is no consensus among financial management scholars and economists about all three forms of EMH, there is a near-consensus that EMH is a theory simple to describe but difficult to put to the empirical test. Despite the onslaught against the EMH over the last two decades, the puzzling set of stock market anomalies could be considered chance events; some supporters argue that it is hard to find profit even if the market is highly volatile (Roll, 1994). Lack of finding support for EMH may be considered as a shortcoming of the basic model. It would not be an exaggeration that the EMH has not lost its charisma and is expected to be on the agenda of financial economists.

