


 Inglés (pdf)
 Articulo en XML
 Referencias del artículo
 Enviar articulo por email
 Citado por SciELO
  Similares en
SciELO
Similares en
SciELO 
 Permalink
Introduction
Asian emerging markets have enjoyed some of the fastest economic growth rates and spectacular equity returns in the past few years, making Asia the world's leading emerging market region (McKinsey and Company, 2018; OECD, 2019). Among Asian markets, Pakistan has come under the limelight in recent years. Specifically, Pakistan Stock Exchange (PSX) was ranked amongst the ten best-performing markets in the world by Bloomberg for the years 2012, 2013 and 2014. For the year 2016, Pakistan was ranked as Asia's best and world's fifth best-performing stock market by Bloomberg. Despite its relatively small size, high uncertainty, evolving regulatory environment and substantial differences in market microstructures compared to the world's other equity markets, the outstanding performance of Pakistan's stocks market in recent years has helped it to regain domestic investors' confidence and is serving as an attraction for foreign investors (Mangi, 2020).
The literature documents substantially benefit investors associated with fund allocation to emerging market equities in the form of expanded risk-return possibilities (Conover et al., 2002, 2014). Some markets such as Korea, Hong Kong, Taiwan and Singapore are well-known to investors. But several others like Pakistan remain unknown territories. In this paper, we aim to expand foreign investors' understanding of the potential return enhancement and risk diversification advantages offered by Pakistan's equity market.
We also investigate what matters for investing in Pakistan's market. Unlike the literature on cross-sectional variations in stock returns available on US and other developed markets, the literature available on this topic, especially for emerging Asian markets is recent, limited and inconclusive. Our cross-sectional analysis of Pakistan's stocks adds to the growing literature on factor analysis in emerging markets.
Pakistan's market is challenging for foreign investors because it is characterized by a low level of market depth, unavailability of derivatives and substantial variation of market liquidity. We take account of this feature by studying a liquidity factor. The literature documents that liquidity risk becomes stronger for the economies facing political risk, lacking diversity in securities and investor types, having poor disclosure and governance, and with poor law and order conditions (Amihud et al., 2012). Since Pakistan displays the characteristics of a typical emerging market, we analyze the role of liquidity in the cross-section of stock returns in Pakistan.
This paper demonstrates efficiency gains through adding Pakistan to global portfolios and identifies investment styles to yield high returns on PSX. The rest of this work is organized as follows: the literature review in Section 2 and the status of Pakistan's equity market in Section 3. Next, the methodology is described. Section 5 details our findings and we discuss them and conclude in Section 6.
2. Literature review
Benefits to international diversification have recently been driven by emerging market investments due to the increasing correlations between developed equity markets, opening of emerging markets for foreign investors and the expanded risk-return possibilities provided by emerging equity markets (Goetzmann et al., 2005; Cha and Jithendranathan, 2009; Conover et al., 2014). Early research considered emerging markets as a whole and documented the benefits of adding an emerging market index to global portfolios (Wilcox, 1992; Conover et al., 2002). However, emerging markets remain heterogeneous in terms of capital market development, political risk, institutional quality and global integration level; therefore, investment benefits vary across these markets. Hence, emerging market selection in portfolio investment is of utmost importance (Conover et al., 2014). Typical emerging market features of Pakistan along with the remarkable performance of its equity make it an interesting case to study Pakistan's role in international portfolio diversification. Hence, we formulate the following hypothesis:
H1. Inclusion of Pakistan's equity increases return and reduces the risk of the foreign portfolio.
Among the many asset pricing models presented over past decades, Fama and French (1992) (FF three-factor), Carhart (1997) (four-factor) and Fama and French (2015) (FF five-factor models) have become widespread in explaining stock returns across markets (Walkshausl and Lobe, 2014). Specifically, empirical evidence from developed markets shows that small stocks outperform large stocks and value stocks with high book-to-market (BM) outperform growth stocks with low BM; however, there are discrepancies in these relationships for emerging markets. Drew et al. (2003), for example, reported the existence of a significant size premium in China; however, in this case, the BM effect was not found to be pervasive. Many subsequent studies on Chinese and Korean markets confirmed the presence of only size premiums (Wang and Xu, 2004; Kang and Jang, 2016). Connor and Seghal (2003) reached the same conclusion for Indian stocks. Similarly, Firozjaee and Jelodar (2010), Al-Mwalla (2012) and Eraslan (2013) found weak results on multifactor models for other emerging markets. However, in contradiction to these results, recent studies have reported significant value premiums along with significant size premiums for several emerging markets. Cheung et al. (2015), for example, reported size and value premiums in the Chinese market, Rugwiro and Choi (2019), for the Korean market and Aziz and Ansari (2014) confirmed the same for the Indian market.
Mirza and Shahid (2008) conducted the earliest study testing the FF three-factor model in Pakistan and confirmed significant size and value premiums that is confirmed by Rashid et al. (2018). However, Haque and Sarwar (2013) found an insignificant size effect and a significant but negative BM effect. Further, Mirza and Reddy (2017) documented a significant momentum effect in Pakistan; however, the same factor was proposed as redundant by Ali et al. (2021). Reconciling the existing discrepancies necessitates re-examining the significance of traditional factors in explaining Pakistan's equity returns and we derive the following hypothesis:
H2.There is a positive relationship between traditional risk factors and stock returns in Pakistan.
Liquidity is an important factor for investors who require a higher return for illiquid investments. Empirical research uses different liquidity measures like bid-ask spread, transaction costs, turnover rate and price impact. Regardless of the specific measure, studies have established a negative relationship between liquidity and stock returns (Amihud and Mendelson, 1986; Brennan and Subrahmanyam, 1996; Datar et al., 1998; Amihud, 2002).
Compared to developed markets, emerging markets have lower stock liquidity (Lesmond, 2005). However, the negative relationship between liquidity and returns is not established in these markets. Rouwenhorst (1999), for example, suggested that returns in emerging markets cannot be explained by liquidity. Further, Batten and Vo (2014) documented a positive relationship between liquidity and stock returns for an emerging market. Existing studies on stock liquidity from Pakistan's market confirm the relationship between liquidity and stock returns; however, they do not analyze the role of liquidity in terms of the cross-section of returns (Sadaqat and Butt, 2017; Saeed and Hassan, 2018). Taking traditional factors as control variables, we concisely investigate the incremental effect of liquidity risk.
H3.There is a positive relationship between liquidity risk and stock returns in Pakistan.
3. An overview of Pakistan stock exchange
Pakistan's financial system, including the equity market has undergone profound developments over the last 30 years. Notably, Pakistan's financial system went through liberalization and deregulation during the 90s with major policy actions by the government. Specifically, a monetary policy with less government interference was undertaken and foreign investors were permitted to buy securities of listed firms leading to the establishment of efficient capital markets. In 2016, in a bid to attract more investors, especially foreign investors, the three stock exchanges of the country, Karachi Stock Exchange, Lahore Stock Exchange and Islamabad Stock Exchange merged to form PSX. In 2019, foreign investment in Pakistan's equity amounted to $4.13 billion (increasing by 221% over the past decade) and represented 8.2% of market capitalization.
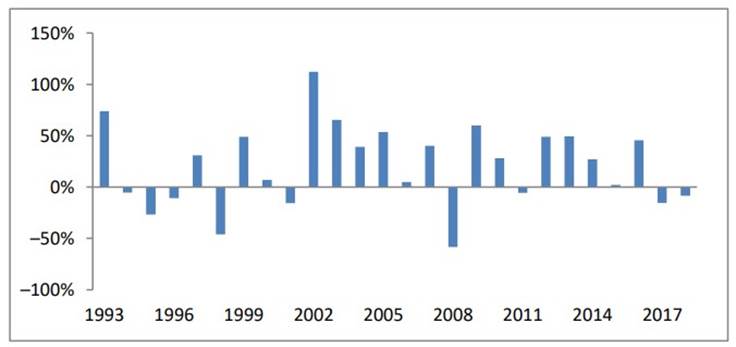
Figure 1 presents year-by-year returns that the investors earned in the leading PSX index over the last 27 years. Remarkably, the equity market experienced fast growth following liberalization and deregulation. For instance, in 2002, in the midst of a global market meltdown, the index increased by 112%, and Pakistan's market was reported as the best performing market in the world by US news magazine Business Week. Beyond, over a five-year period from 2002 to 2007, Pakistan's equity market earned an impressive average annualized return of 52.62%. Only in 2008 did Pakistan record a steep drop in equity prices in wake of the global financial crises. Even, a floor rule was imposed on PSX in August 2008 resulting in a near-total paralysis of Pakistan's equities market for more than three months and the removal of the market from the Morgan Stanley Capital International (MSCI) and Standard & Poor's (S&P) emerging markets indices.
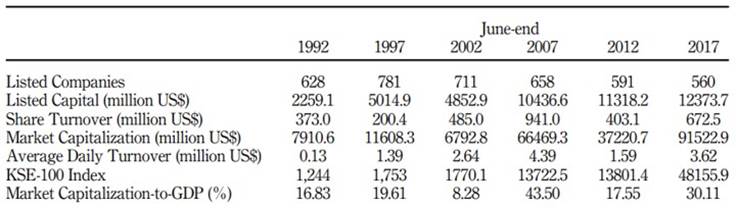
As reported in Table 1, good performances of the market since 2002 came together with an increase of market capitalization by around 1,250% from $6.79 billion to $91.5 billion representing about 30% of the country's Gross domestic product (GDP). This makes Pakistan one of the leaders in terms of capitalization increase in the world.
4. Method
4.1 Data
Our analyses use different sets of data from Thomson-Reuters DataStream and PSX. For comparative analysis of Pakistan, we use market-level data from January 1993 to June 2019 on equity indices and currency rates for 22 developed and 22 emerging markets. Further, we use data on the MSCI-World index for benchmarking, MSCI-U.S. and MSCI-Europe indices as proxies for developed markets, and MSCI-Emerging Market Asia Index for comparison. Our sample includes all markets categorized as developed and emerging by Morgan Stanley.
In factor analysis, we use firm-level data for 130 nonfinancial stocks from PSX. We consider stocks that are traded at least 50% of days in each year because these stocks can be traded in time, and hence foreign investors may invest in these. We use the KSE-100 index as a proxy for market and six-month treasury rate for the risk-free rate. Due to the unavailability of firm-level data before 2000, we perform a cross-sectional analysis using the data from January 2000 to June 2019.
4.2 Analytical procedure
To test our first hypothesis, we build portfolios mixing developed market equity indices and PSX. Especially, we take the point of view of investors from the USA and Europe, the two markets with the highest allocations in MSCI developed market index. Specifically, MSCI World Index comprises 23 developed markets with the US and Europe carrying 65.5% and 10.9% allocations, respectively. We study both equally weighted and minimum-variance portfolios mixing MSCI-Europe and PSX for European investors and MSCIUS and PSX for US investors. As a comparison, we consider portfolios mixing developed markets indices and MSCI-EM Asia.
To test our second hypothesis, we take inspiration from Fama and French (1992, 2015) and Carhart (1997). We sort the stocks based on three firm characteristics: size, BM and momentum, using one-dimensional and sequential sorting. We construct five one-dimensional portfolios and eight sequential portfolios following Liew and Vassalou (2000). We rebalance portfolios at June-end each year and calculate equally weighted returns for the subsequent 12 months. We investigate the relationship between portfolio returns and the market, size, BM and momentum, using the following four-factor model (equation 1):

Following Fama and French (2015), we add profitability and investment and test the following five-factor model (equation 2):

In equations (1) and (2), R pi,t is portfolio return, RF t is the risk-free rate, and SMB t HML t WML t , RMW t and CMA t , and CMA t are size, BM, momentum, profitability, and investment factors, respectively.SMB t is difference between returns on portfolios of small and big stocks, HML t is difference between returns on portfolios of high and low BM stocks, WML t is difference between returns on portfolios of past winning and losing stocks, RMW t is difference between returns on portfolios of stocks with robust and weak profits and CMA t is difference between returns on portfolios of low- and high- investment stocks. Factor loadings, β p ,ϒ p , θ p , δ p , Ꝕ p and Ƭ p are the slopes in time-series regression.
Finally, we test our last hypothesis based on two liquidity measures: turnover rate and illiquidity cost. Turnover rate is the ratio of traded shares to outstanding shares. Illiquidity cost is the ratio of absolute stock return to its dollar trading volume. Due to the unavailability of bid-ask spread data for international markets, turnover and illiquidity cost are the most widely used liquidity measures (Levine and Schmukler, 2006). We calculate liquidity factor (IML) as the difference between returns of portfolios with the lowest and highest liquidity. We ran a five-factor model with liquidity as the fifth factor in addition to market, size, BM and momentum factors (equation 3)

5. Results
5.1 Comparative analysis of PSX
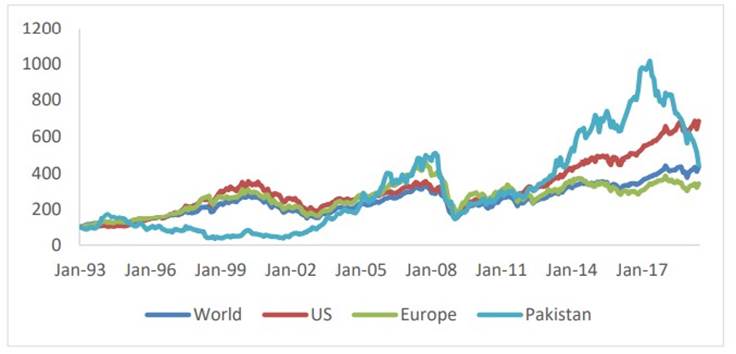
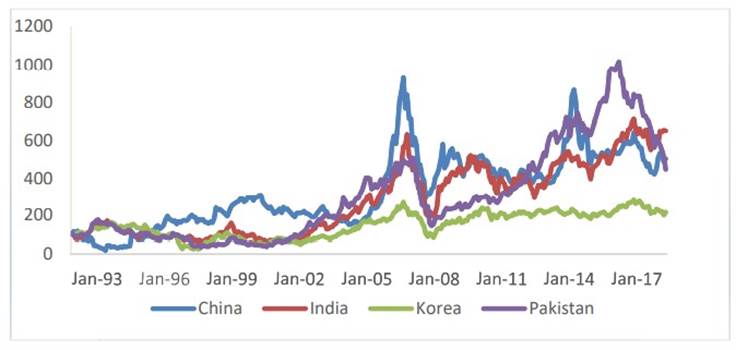
We plot the PSX leading index (converted into dollars) with selected MSCI indices in Figures 2 and 3. Figure 2 shows that Pakistan's equity index has outperformed World, US and Europe indices in the recent years. The same exceptional performance can be seen in Figure 3 where Pakistan is compared to individual Asian emerging markets of China, India and Korea.
To facilitate a comparison, in Table 2 we present descriptive statistics for 22 emerging markets, including Pakistan and 22 developed markets for the period 1993-2019. All statistics, except local currency returns, are calculated in dollars. Interestingly, Pakistan exhibits the same returns as the average emerging market but 3.12% lower than the average standard deviation over the period and therefore a signal-to-noise ratio that is higher than the average one. Negative skewness and high kurtosis for many countries, including Pakistan, suggest that markets are exposed to crash risks. However, Pakistan's distribution of returns looks in line with other countries' return distributions. For instance, PSX exhibits lower skewness in absolute terms and kurtosis than USA or Norway among others.
Table 2 Comparative statistics for emerging and developed markets
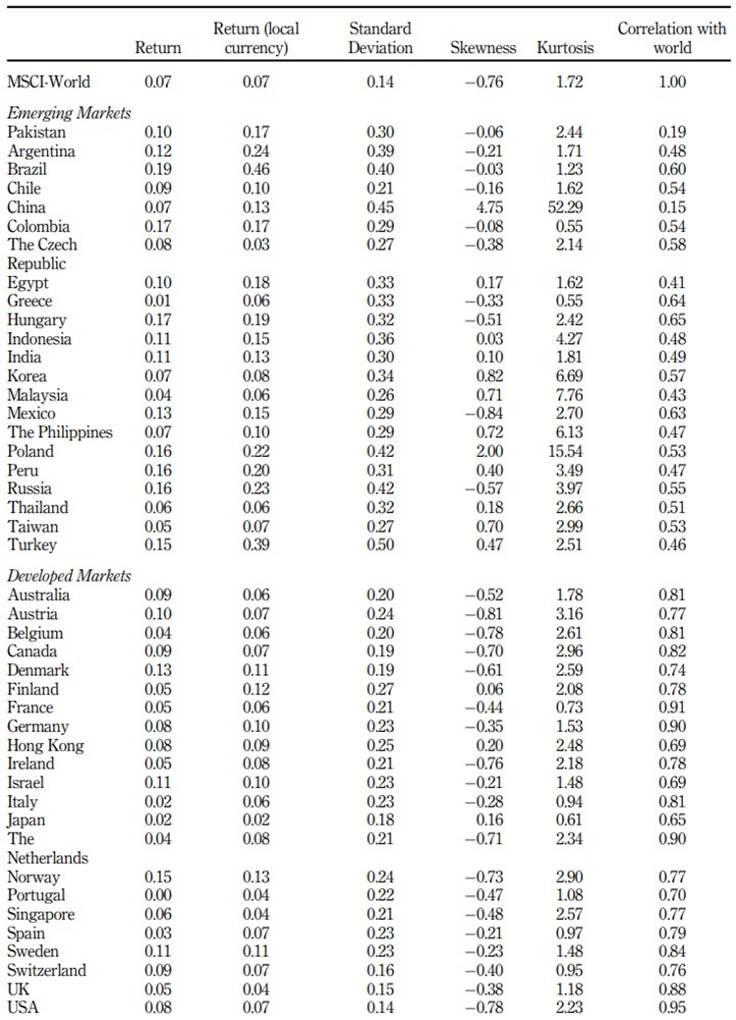
Source(s): Own elaboration based on data taken from Thomson-Reuters DataStream
The local currency returns for all emerging markets, except the Czech Republic, are higher compared to their dollar returns, suggesting that emerging market currencies have been depreciating against the dollar. For Pakistan, Rupee depreciated by 7% per year over the period. Pakistan's participation in various International Monetary Fund (IMF) programs required market-determined currency value as a precondition that resulted in this massive devaluation. Though Pakistan's currency depreciation is significant, it remains comparable to other emerging currencies such as the Chinese Yuan which depreciated by 6% per year over the period.
5.2 International diversification enhancement
Pakistan has a very low correlation with the main stock indices that making it a good candidate for international diversification (Table 3). For instance, the correlation coefficient between Pakistan and MSCI-World is 0.19. This is the lowest among all considered emerging countries.
Table 3 Correlation coefficients
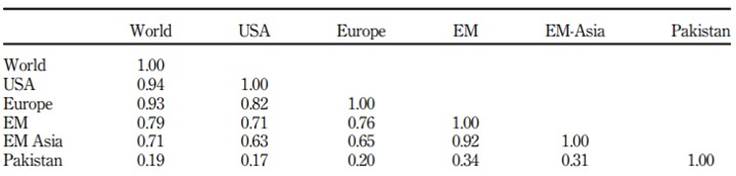
Source(s): Own elaboration based on data taken from Thomson-Reuters DataStream
Digging further, we report, in Table 4, a market beta of various markets to MSCI-World for a complete period and various subperiods. Pakistan exhibits a very low beta of 0.38 against 1.15 for emerging markets and 1.14 for developed economies. However, it is important to note that this low beta figure has mainly resulted due to the close to zero beta coefficient over the period 1998 to 2002 during which Pakistan underwent various sanctions imposed by IMF and the USA following nuclear tests. Indeed, during 1998, Pakistan's equity market experienced a decline of 46% as shown in Figure 2 before regaining 49% in 1999 as the sanctions were lifted.
Table 4 Beta coefficients for emerging and developed markets
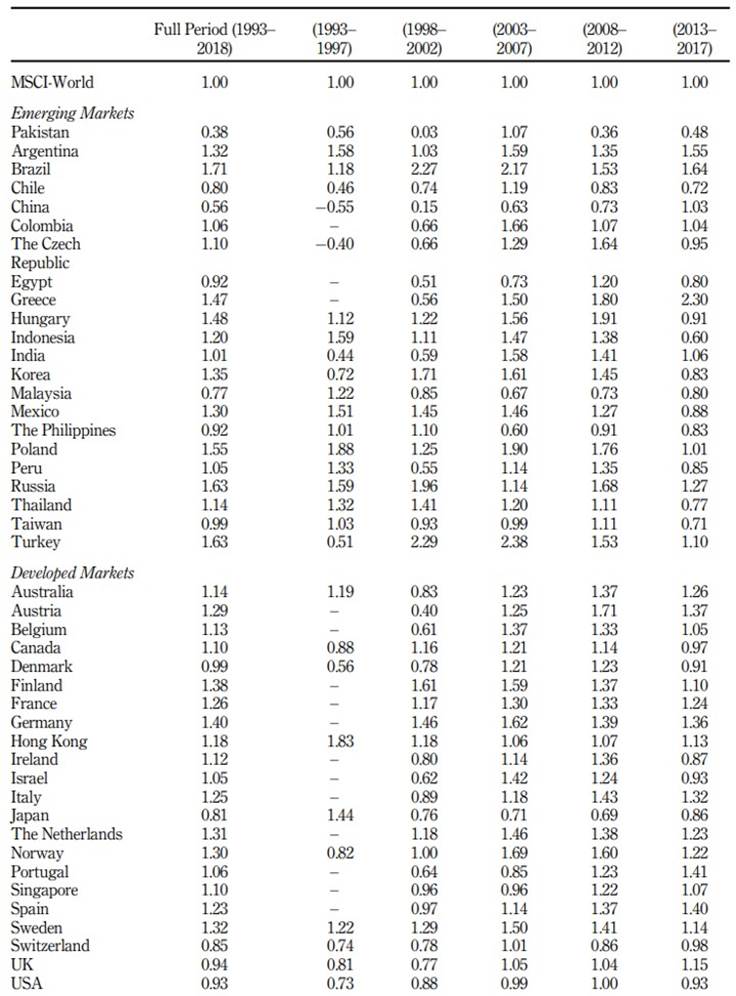
Source(s): Own elaboration based on data taken from Thomson Reuters Datastream
To estimate potential diversification enhancement through Pakistan's equity, we build portfolios mixing main equity indices and PSX. Panel A of Table 5 reports the descriptive statistics of European investors' possible portfolios. Mixing MSCI-Europe and Pakistan clearly improves the statistics. Indeed, both equally weighted (Europe-Pakistan) and minimum-variance (EU-Pakistan min) portfolios exhibit the Sharpe ratio of 0.44 while the benchmark portfolio (MSCI-Europe) Sharpe ratio stands at 0.36. We also note a reduction in crash risk for the portfolios mixing the MSCI-Europe and PSX: the skewness is substantially lower than the skewness of the benchmark portfolio in absolute terms (−0.33 versus −0.58). Even, for an equally weighted portfolio, skewness turns to be slightly positive (0.04). We can also note that the kurtosis is lower for both equally weighted portfolio and minimum-variance portfolio. Finally, we can see that the maximum drawdown to which an investor is exposed could be reduced by including PSX in the portfolio. As a comparison, we report descriptive statistics of portfolio mixing MSCI-Europe and MSCI-EM-Asia. We cannot see, in this case, any improvement that tends to indicate that investors may want to favor broader Asian indices to PSX.
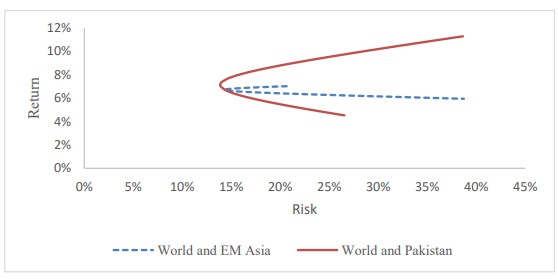
When we look from the US investor perspective (Panel B of Table 5), we see that the improvement is lower, albeit still visible. Especially, we confirm that the PSX has a greater potential for risk-adjusted return enhancement than MSCI-EM-Asia. Together, we again notice a reduction in crash risk as measured by the skewness of the return distribution. Finally, we report that difference in Sharpe ratios between the minimum-variance portfolio mixing MSCI-US and the PSX and the equally weighted portfolio mixing MSCI-US and MSCI-EM-Asia is significant (p-value 0.04), according to the test proposed by Ledoit and Wolf (2008). This indicates that portfolio construction is as important as assets diversification for risk-adjusted return enhancement in this case. However, portfolio construction, especially optimization is out of the scope of this paper. In Figure 4, we present efficient frontiers to show improvement in a risk-return relationship by adding PSX to MSCI-World in replacement of MSCI-EM-Asia.
Table 5 Possible portfolios for foreign investors
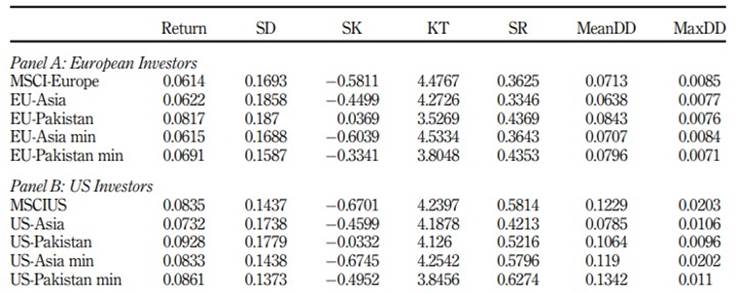
Note(s): The table reports mean return (Return), standard deviation (SD), skewness (SK), kurtosis (KT), Sharpe ratio (SR), mean return-to-mean drawdown (MeanDD) and mean return-to-maximum drawdown (MaxDD) Source(s): Own elaboration based on data taken from Thomson-Reuters DataStream
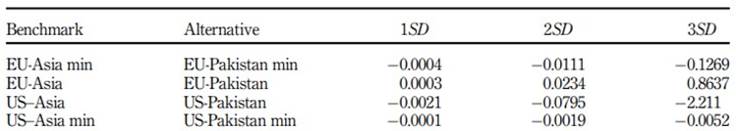
As a final step, we account for higher-order moments of the distribution and notably the skewness for portfolio choices. The standard mean-variance framework ignores this characteristic. When investors' utility functions remain unknown, one can rely on stochastic dominance to set straightforward rules of choices. We look for a strategy that would be preferred by an investor who is nonsatiable, risk-averse and prefers positive skewness (e.g., Arrow, 1971). This strategy would be third-order stochastic dominant that would dominate any other one for the class of utility functions satisfying u'>0, u''<0 and u'''>0. We compare properties of the benchmark portfolio and the ones including PSX (alternative) by estimating the difference of their cumulative empirical distribution functions (first-order dominance), an integrated difference of their cumulative empirical distribution functions (second-order dominance) and double integral of this difference (third-order dominance) as that in Vinod (2004).
The cumulative sums are used as overall indicators of dominance. Negative numbers indicate rejection of the hypothesis that the benchmark strategy dominates the alternative one. Looking at results in Table 6, we see that numbers for second- and third- order dominance are negative for all portfolios except when the benchmark is EU-Asia, and the alternative is the EU-Pakistan portfolio. For the cases with negative numbers, a nonsatiable, risk-averse investor who prefers positive skewness would not prefer the benchmark strategy to the alternative one including Pakistan. This makes sense since we know that the strategy including Pakistan tends to exhibit smaller negative skewness than the benchmark strategy. The result concerning EU-Asia and the alternative might look surprising since EU-Pakistan exhibits positive skewness. However, this portfolio also exhibits a bigger mean drawdown that justifies this result.
5.3 Cross-sectional portfolio strategies for Pakistan's stocks
We now explore Pakistan's stocks price action. Especially, we would like to know whether the usual risk premium story can justify these stock returns.
5.3.1 Factor premium
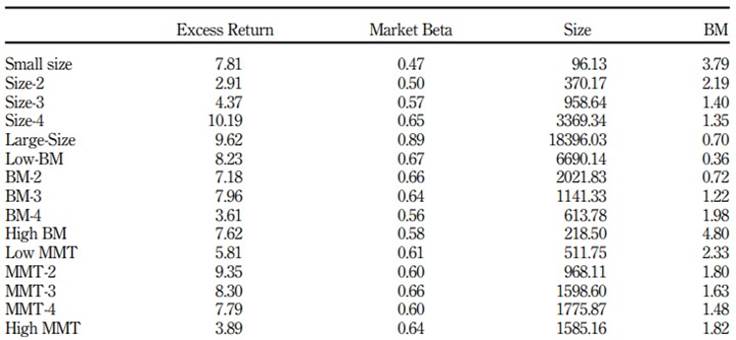
Table 7 presents the annualized excess return, market beta, market capitalization (in PKR millions), and BM ratio for portfolios. Our returns are decreasing from large to small size, from low to high BM, and from past losers to past winner stocks. The inverted premiums reported for size, BM and momentum factors go against the usual findings in the literature (Fama and French, 1992; Jegadeesh and Titman, 1993). In particular, our large portfolio generates a premium of 1.81% relative to a small portfolio, our low-BM portfolio generates a premium of 0.61% relative to a high-BM portfolio and our past loser stock portfolio generates a premium of 1.92% relative to the winner portfolio. Evidence on inverted risk premiums in the literature is rare but not unique. To check the robustness of the size effect, Knez and Ready (1997) removed extreme monthly returns and found an inverted size effect. Recently, Jensen et al. (2019) also documented inverted size and BM premiums during restrictive monetary policy periods. In line with the findings of Knez and Ready (1997), our inverted risk premiums might be a consequence of sample selection criteria: for a firm to clear the sample selection hurdle, it had to have the financial, price and trading data available. Missing firm-level data for young, usually small, firms in Pakistan led to their noninclusion. Yet these firms tend to experience large returns.
Table 7 Portfolio properties
Source(s): Own elaboration based on data taken from Thomson-Reuters DataStream
5.3.2 Multifactor model analysis
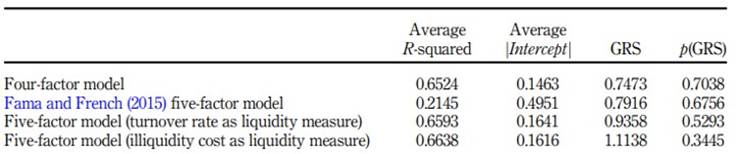
We run four-factor and FF five-factor models (Equations 1 and 2) to investigate the relationship between factors and portfolio returns. If the factors capture the stock returns, the intercept in the model is indistinguishable from zero. We test this hypothesis using the GRS test (Table 8) which shows that intercept is zero for all portfolios in each model. With mostly insignificant factor coefficients and low adjusted R-square, the five-factor model does not perform well; hence, we present the results in Appendix (Table A1). On the contrary, the four-factor model fits well with an average adjusted R-square of 0.65 and the lowest average intercept. Complete results of the model are presented in Table 9. Despite the inverted size and BM premiums in Pakistan's market, results confirm the existence of factor effects. The market factor is found to be the most significantly priced factor. Firozjaee and Jelodar (2010), Al-Mwalla (2012), and Eraslan (2013) report similar findings for selected emerging markets while this is usually not the case in developed markets (e.g. Fama and French, 1992, 1996).
Table 8 Summary of asset-pricing tests
Source(s): Own elaboration based on data taken from Thomson-Reuters DataStream
Table 9 Four-factor model
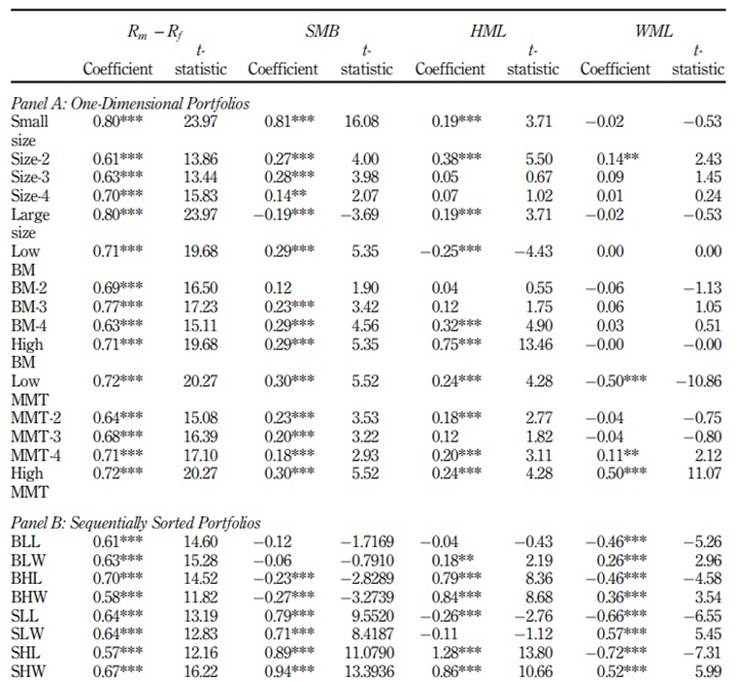
Note(s): First sequential portfolio, BLL, comprises big stocks with low BM and low prior return. Similarly, BLW comprises big stocks with low BM and high prior return and so on. ** and *** denote significance at 5 and 1% levels, respectively Source(s): Own elaboration based on data taken from Thomson-Reuters DataStream
Table A1 Fama and French (2015) five-factor model
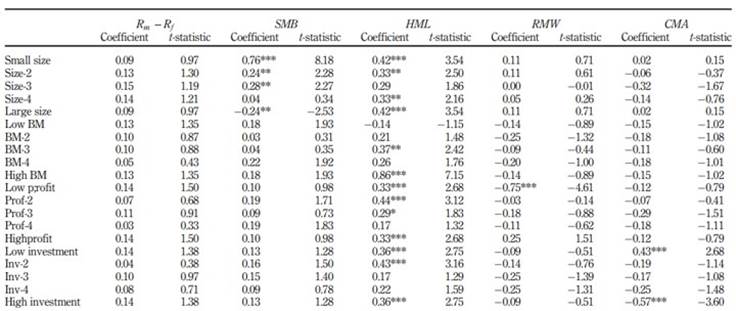
Note(s): ** and *** indicate significance at 5 and 1%, respectively Source(s): Own elaboration based on data taken from Thomson-Reuters DataStream
Our results also show the strong size and BM effects. The size effect is significant for all portfolios except sequential portfolios of big stocks with low BM and high past returns. Moreover, the BM effect is significant for 12 of 15 one-dimensional and six out of eight sequential portfolios. The momentum premium is insignificant for all one-dimensional portfolios but turns out to be significant for all sequential portfolios.
We also check the exposure of PSX to the global risk premia. We took FF factors for the USA, Europe, developed market, emerging market and Asia-Pacific ex-Japan from Kenneth R. French data library and regressed PSX excess returns on these factors (one set at a time). Results (Table 10) show that global factors do not perform well confirming that Pakistan's market is not exposed to other markets' risk premia and therefore provides an interesting opportunity for diversification.
Table 10 PSX exposure to global factors
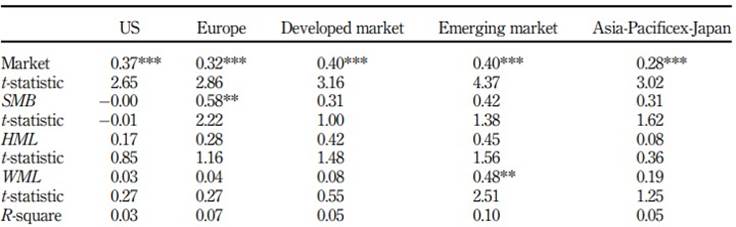
Note(s): ** and *** denote significance at 5 and 1% levels, respectively Source(s): Own elaboration based on data taken from Thomson-Reuters DataStream and Kenneth R. French data library
5.3.3 The role of liquidity in Pakistan's market
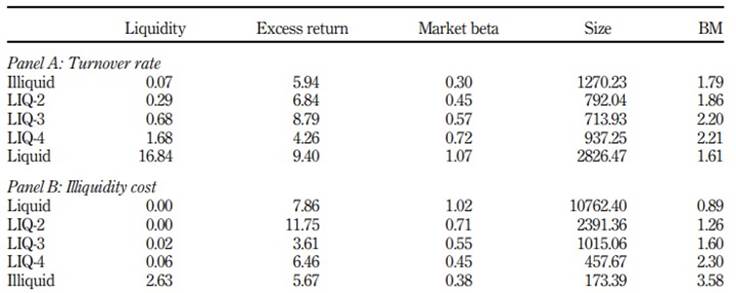
We observe huge dispersion in liquidity across sample stocks (see descriptive statistics in Table 11). Interestingly, the most liquid portfolios have earned higher returns and show some unique properties. These portfolios have high beta and comprise big stocks with low BM. Stocks with high beta are more volatile and they are more prone to portfolio rebalancing by investors (Rouwenhorst, 1999). High market risk implies that liquid portfolios must earn high returns; however, big size and low BM justify low return which makes the relationship between liquidity and return less clear.
Table 11 Properties of liquiditybased portfolio
Source(s): Own elaboration based on data taken from Thomson-Reuters DataStream
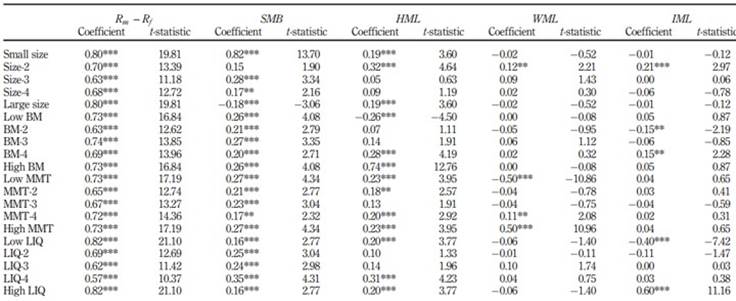
We ran a five-factor model with liquidity as the fifth factor (Equation 3) and present results in Tables 12 and 13. With the addition of liquidity factor, adjusted R-square increases and GRS test-statistic remains insignificant. The coefficients for liquidity are negative for most portfolios confirming that the strategy of investing in liquid stocks provides superior performance. These results contrast with the negative relationship between liquidity and returns documented by numerous studies (e.g. Brennan and Subrahmanyam, 1996; Datar et al., 1998); however, these findings are not unique. Brown et al. (2009) claimed that the trading volume-based measures contain information effects that may result in positive stock returns, and Batten and Vo (2014) previously documented a positive relationship for an emerging market.
Table 12 Five-factor model (turnover rate as liquidity measure
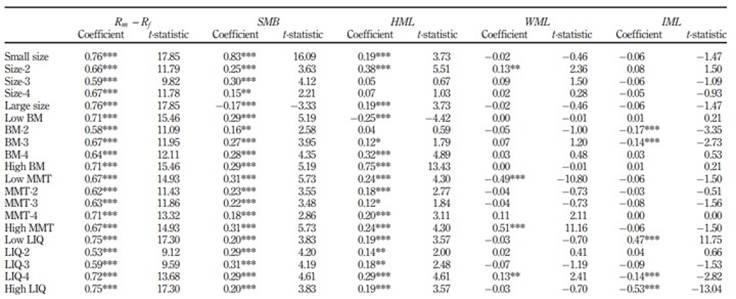
Note(s): ** and *** denote significance at 5 and 1% levels, respectively
Source(s): Own elaboration based on data taken from Thomson-Reuters DataStrea
6. Discussion
The findings on the expanded set of global efficient portfolios by adding Pakistan support our first hypothesis. Substantial diversification benefits of investing in Pakistan instead of EM Asia is consistent with the fact that emerging market indices are dominated by big and mature markets such as China, South Korea and Taiwan where equity premiums are close to the internationally competitive levels (Feldman and Kumar, 1995). Furthermore, as shown already, the correlation between MSCI-EM-Asia and MSCI-Europe or MSCI-US are high. Pakistan's equity market, alternatively, is comparatively a small market where trading mechanisms are in the development phase and foreign investors have recently begun to appreciate the investment opportunities. The market, thus, has a low correlation with developed markets and hence, offers substantial international diversification benefits. Given the volatility of PSX, benefits may not be perfectly stable, but the market is a good source of diversification in normal times. Hence, our findings reinforce the importance of country selection in managing a global portfolio.
The findings of the negative relationship between risk factors and stock returns do not support our second and third hypotheses and suggest that stock price action in Pakistan is unique and different from developed markets. The evidence of the inverted size and BM premiums combined with significant slopes provide important implications for global investors. Investors could achieve superior returns by holding big stocks with low BM and low momentum. More importantly, considering brokerage commission on PSX and price impact (average Amihud illiquidity cost), maximum annual trading costs are 30 basis points, and our strategies generate significant spreads after accounting for these. Further, a positive relationship between liquidity and returns implies that investors can increase their exposure to high-yielding stocks without trading in the infrequently traded stock. We see this as a positive finding for global investors interested in adding Pakistan's stocks to their portfolios. Consequently, policymakers must pay attention to the measures that actively facilitate foreign investments.
More broadly, our findings can improve investors' understanding of the pricing of different risk factors in Pakistan's market enabling them to make more reliable and informed investment decisions. Global investors interested in emerging markets can compare the factor premiums before constructing portfolios that maximize risk diversification and return potential. Investigation of other fundamental variables, comparison of factor premiums in different markets and liquidity analysis using high-frequency stock transaction data remain areas of future research.
7. Conclusions
We investigate the attractiveness of Pakistan's market for global portfolio investors and explore what matters for investing in Pakistan's equity. Due to its low level of integration with developed markets, Pakistan's market, if added to developed markets' portfolios, can provide efficiency gains to investors. Notably, we show better risk-adjusted return, low skewness and low beta making Pakistan an appealing market for diversification.
The tests in our study show that the four well-known factors, market, size, BM and momentum, are priced in Pakistan's equity market; however, stock price action in Pakistan is unique. The role of market risk in explaining stock returns remain strong with the addition of the other factors. Moreover, size, BM and momentum premiums are inverted. We also report a positive relationship between liquidity and returns which is a positive finding for global investors.

