


 Inglés (pdf)
 Articulo en XML
 Referencias del artículo
 Enviar articulo por email
 Citado por SciELO
  Similares en
SciELO
Similares en
SciELO 
 Permalink
Introduction
Shadow economy (SE), prominently, became an important aspect in the various research studies during the last decade when its negative impact on various world economies began to outspread. The International Labour Organization officially recognized this phenomenon in 1972 as a fact of economic reality in almost every nation of the world, irrespective of whether the nation has been developed or was developing. SE was found to severely weaken many countries’ economic plans and policies, possibly threatening global economic stability. Al-Mutairi (2012) and Cagan (1958) were the first to appreciate this phenomenon by using the currency demand model that examined the relationship between currency demand and the burden of tax and considered it as one of the main causes of SE in the United States during the period 1919-1955. However, according to Al-rafati (2007), anti-money laundering policies have hampered the capital attraction, resulting in negative effects on the national economy, banking activities and customer satisfaction. Some studies conducted in certain countries attempted to figure out the SE. It accounted to be 17.1% of the scientific economies that were found in both developed and developing nations; D'Hernoncourt and Meon (2012), Schneider and Buehn (2012), Hassan and Schneider (2016) and Buehn (2012 stated in their studies that the average size of the SE for 157 countries of the world is 33.77%.
The Palestinian territories have been suffering from a condition threatening their economy - considering the occupation and the geographical and political divide between the two parts of the Palestinian homeland (the West Bank and the Gaza Strip). These have also led to a slackening in the government institutions, resulting in SE’s emergence in the territory. The Palestinian Authority’s decision-makers do not have access to any study or international report so that they may assess the proportion or SE size in the Palestinian territories. This could help them in making better decisions. As the activity of SE is often out of the control of the policymakers, an increase in its size may lead to inconsistencies in the objectives and trends of both the formal economy and the SE. However, there are some studies, such as those of Al-Ajez (2008), Alghalth (2012), Amour and Durgham (2009), Ladadwah (2003) and Malki et al. (2004), that have dealt with the causes of SE. The matter of concern is that the data reflecting the state of the formal economy is imprecise, which greatly reduces the strength of economic policies and thus hinders economic growth (Guru and Yadav, 2019).
The lack of studies on the size of the SE in the Palestinian territories was a source of motivation for taking up this study. Its goal is to assess the extent of SE in Palestinian territories from 2008 to 2018 using relevant standard procedures. The study will be deemed beneficial with recommendations that can assist economic and political decision-makers in dealing with the Palestinian territories’ SE.
Al-Mutairi (2012), Al-Subaie (2011), Yahyaoui (2016), Schneider and Enste (2000), Jilani (2007) and Chaudhuri et al. (2006) estimated the size of the SE by constructing a standard model of the equation of demand for currency, or what is referred to as the approach of Tanzi (1980). Hassan (2005) implemented the multiple indicators and multiple causes (MIMIC) model to estimate the SE in Egypt. In the case of international studies, Schneider (2008) and Lars and Schneider (2010) applied the causes and indicators method and the currency demand model. On the other side, Halicioglu (1999) followed the quantitative theory of money for measuring SE in the Turkish Republic. DellÂ'Anno (2007), Kanao and Hamori (2010) and Gulzar et al. (2010) acted upon the Tanzi approach and model with some adjustments adapted to the nature of the reality in each of the countries in which their studies were conducted. The present study is also based on the Tanzi approach. However, a new independent variable, namely, the ratio of workers in their own interests to actual workers, has been added to the existing equation to study its significant impact on SE.
2. Literature review
In this section, we present previous studies’ results in estimating the size of the SE in applied studies and the impact of the SE on the political, economic and social realms.
2.1 Shadow economy size
This is the most famous method of estimating SE. It has been widely applied in many Arab and foreign studies. By applying this method, the study by Reda (2018) found that the size of SE in Algeria from 1970 to 2004 was about 24% of the gross domestic product (GDP). Another study by Al-Subaie (2011) found that the size of the SE in Saudi Arabia was, on average, 15.28% of the GDP from 1992 to 2008. In addition, another study by Gulzar et al. (2010) found that the size of the SE in Pakistan between 1982 and 2010 was between 32 and 38% of the GDP. Finally, a study by Kanao and Hamori (2010) applied to Japan from 1971 to 2007 found that the size of the SE was about 25% on average of the GDP.
2.2 Shadow economy impact
Yap et al. (2018) investigated the non-linear relationship between SE and income inequality and determined whether the SE size influences the level of income inequality. The study found that income inequality and SE resemble an inverted-N relationship, as in developed countries (OECD) (Celikay, 2020). However, for developing countries, it has shown an inverted-U relationship, similar to the original Kuznets hypothesis. Wiseman (2015) examined the association between productive and unproductive formal sector entrepreneurial activity and lower and higher levels of informal economic activity. The study found a strong significant negative and positive relationship between SE size and productive and unproductive entrepreneurship. Corruption validity cannot be rejected in regressions on productive and net entrepreneurship scores. Virta (2010) examines the impact of corruption on the size of the SE in countries with different levels of income and location, how corruption differs from country to country, and what consequences they have. The study concluded that corruption does not seem to affect the size of the SE outside the tropics. Moreover, corruption and the SE seem to be substitutes in the tropics. Williams and Horodnic’s (2016) paper aimed to assess the percentage in which people in formal jobs conduct shadow work and their characteristics. It found that formally employed personnel have a disproportionate share of the shadow work, and it is conducted by those who benefit least from the formal economy, mostly unmarried low-level employees. Byun et al.’s (2018) research examined the global patterns in shadow education. The researcher found a massive pattern in the use of shadow education in the modern world and that students in poorer countries are more likely to depend on shadow education than students from rich countries. Schneider et al.’s (2015) paper explored the size of the SE in European Union (EU) countries. And to identify tax evasion in those countries, it was found that the average size of the SE in EU countries was 22.6% (of official GDP) in 2003 and decreased to 18.6% in 2014. The SE’s most important driving forces were found to be unemployment, self-employment and tax morale. The purpose of Vousinas’s (2017) paper was to study tax evasion and SE in Greece; the study concluded that these two variables are formed due to a lack of tax awareness, the tax burden, the structure of the tax system, the role of the state, the level of improvement of public authority, self-employment, unemployment and the level of organization of the economy.
This study shall add to the existing research stock, as it is based on a recent period (2008-2018) with a different estimation method in an economy that does not own any currency in its state. In addition, some available studies have addressed the relationship of SE to certain aspects such as unemployment, consumption and crime rates. At the same time, this research intended to study the size of the SE in relation to the GDP of the Palestinian territories.
Method
3.1 Research design and variables
For the estimation of the size of SE in the United States in the period 1930-1980, Tanzi (1980) profoundly tested the relationship between the demand for liquid money and the level of taxes by implementing a ratio of liquid money and the M2 money supply (a broader classification of the money supply). It was found that this rate is affected by legal and illegal factors:
The SE deals with using the money for tax evasion, so increasing the SE will lead to increased demand for currency.
The activities of the SE are a direct result of the increase in taxes. Thus, the tax rate changes in the model to estimate the amount of liquid money associated with the existence of the SE, through which the size of the SE is estimated.
The speed of money circulation is equal to the formal economy and the SE.
Liquid money is used to supply money in the broad sense (M2) and not in the narrow sense (M1).
Abiding by a certain set of assumptions, Tanzi (1980) proposed a basic regression equation on demand for currency in the following formula:

In the equation, ln represents the natural logarithm. (CC/M2) t is the dependent variable. It can be defined as the ratio of money supply traded outside the banking system to the broader money supply (i.e. M2). The independent variables include (TW) t , which is defined as the ratio of tax and gross national product; (R t ), the interest rate on saving deposits in the commercial banks, which are taken as a measure of the opportunity cost of the people retaining the currency and (Y/N) t , which is the average annual per capita income.
The researchers decided to use the demand for currency method to estimate the size of the SE in the Palestinian territories because of the following:
This method is considered the most famous and is applied to many countries worldwide.
Time series of variables data are required for application using standard forms, which is not available for any other method.
The possibility of applying the standard models used for these to the Palestinian reality, which has its own complexity resulting from the occupation on the one hand and the political division on the other.
Data, hypotheses and analytical procedure
For estimating SE in the Palestinian territories, the study has adopted analytical and descriptive research methods. The data has been obtained quarterly from the inflation reports issued by the Palestinian Central Bureau of Statistics (PCBS) and the Palestinian Monetary Authority (PMA) for ten years, from 2008 to 2018. A standard model was constructed using EViews version 8 for the statistical data processing work. The sample size was 44 views.
The approach of Tanzi has been adopted worldwide by many researchers in their respective studies, and their results have found estimates that are realistic and consistent with the international findings. Furthermore, the time series of the variables required for data analysis were possibly traced using standard templates. With the help of statistical tests that also implement the econometric analysis, this research study was carried out, thereby applying the currency demand method to estimate the size of the SE in the Palestinian territory.
Main hypothesis:
H1. There is a statistically significant relationship between tax burden and the proportion of money traded outside the banking system to the M2 supply of broad money.
Sub-hypotheses:
Ha. There is a statistically significant relationship between the percentage of taxes without clearing to GDP and the proportion of money traded outside the banking system to the M2 supply of broad money.
Hb. There is a statistically significant relationship between the ratio of wages and gross salaries to GDP and the proportion of money traded outside the banking system to the M2 supply of broad money.
Hc. There is a statistically significant relationship between the interest rate on deposits in commercial banks and the proportion of money traded outside the banking system to the M2 supply of broad money.
Hd. There is a statistically significant relationship between the proportion of workers in their own interests to the number of actual employees and the proportion of money traded outside the banking system to the M2 supply of broad money.
He. There is a statistically significant relationship between the average annual per capita income and the proportion of money traded outside the banking system to the M2 supply of broad money.
The researchers, starting with Tanzi (1980), used the currency demand method, then Hassan (2005), Schneider and Enste (2000), Schneider (2008) and Lars and Schneider (2010 ) used the MIMIC method. Finally, Hildegart et al. (2007) used the monetary method, and Gulzar et al. (2010) argued about the different methods used to estimate the size of the SE. Despite this controversy, we believe there is no best way to estimate it. As far as the matter concerns the assessment of something unknown, undeclared activities and hidden information, there is hardly any criticism or disagreement among researchers Kanao and Hamori (2010). Therefore, it is also natural that the results derived from each method differ due to the different assumptions and data sources on which each is based. Al-Subaie (2011) argued that the different nature of each country affects the extent to which its economic components absorb the activities under consideration. The entire event, we agree essentially on the definition of comprehensive prevention of this economic phenomenon.
After certain modifications in favour of estimating the size of SE in the Palestinian territories, Equation (1) was reconstructed and Equation (2) was framed for this study as follows:

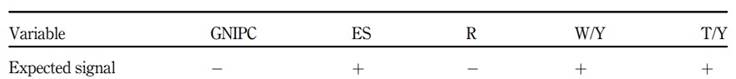
As defined in Equation (1), (CC/M2) t is the dependent variable: the percentage of money circulating outside the banking system to the M2, i.e. the broader money supply. The independent variables include (Tx/Y) t , (Ws/Y) t, (R) t , (ES) t , (GNIPC) t and Єt. Here, (Tx/Y) t is the ratio of the tax rate (without offsetting) to GDP, (Ws/Y) t is the ratio of wages and gross salaries to GDP, (R) t is the interest rate on Israeli shekel savings deposits in commercial banks as a measure of the opportunity cost of retaining the currency, (ES)t is the ratio of workers in their own interests to the actual workers in Palestinian territories, (GNIPC) t refers to GNI per capita and Є t is the random error.
It was expected that in the proposed standard model, the parameters of the independent variables would be as shown in Table 1.
The model assumed that the main factor influencing SE is tax evasion. The foremost step in the modelling mechanism was to draw the two estimates of money that would circulate outside the banking system CC.
The first estimate was where the tax variable was not equal to zero.
The second estimate was where the tax variable was equal to zero.
The second step was to determine the difference between these two estimates, i.e. compare the money traded outside the banking system with the presence of taxes to the money traded outside the banking system without taxes. Here, the difference had been the illegal money that would not have been made without taxes.
The third step was calculating the value of shadow income, computed by multiplying illegal money with the speed of money circulation based on the third hypothesis mentioned above. It assumed that the speed of circulation of money was equal in both the public and the shadow economies. The nominal GDP was divided by M2 (PMA, 2019).
The fourth step was to bring out the ratio of the SE to the official economy by dividing the shadow income obtained from Tanzi’s groups of factors, legal and illegal, and converting it to a percentage by multiplying the division by 100.
Results
The unit root test was carried out using the expanded Phillips-Perron (PP) test, and the results are portrayed in Table 2. The variables in their original state were not dormant at 1 or 5% indication levels. Also, their non-dormancy can be observed while computing the first differences, except for the variables Ln (cc/M2) (the dependent variable) and the interest rate, which were observed as stable after taking the first difference at a level of significance of 5 and 1%, respectively, in both tests. After calculating the second difference for all the variables, they were stabilized at a 1% significance level. Accordingly, the time series of variables were linked (1) after calculating the second difference (see Table 2).
Table 2 Unit root test using the expanded Phillips- Perron (PP) test
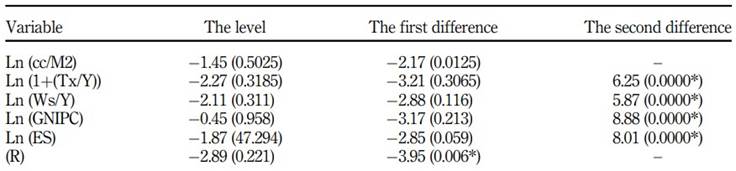
Note(s): *Rejection of the hypothesis of zero that does not keep the chain silent Source(s): Own elaboration
Using the Johansen technique, the results displayed in Table 3 indicate that there is a long-term co-integration relationship between the model variables. It was observed from the trace test that the result of the null hypothesis test assumed that the number of vectors (r = 0) was significant for the significance levels of 1 and 5%. Therefore, the null hypothesis was rejected at the 5% significance level, which is significant due to the presence of at least one integer vector (r ≤ 1). The alternative hypothesis was accepted, which ascertains that there are more than zero vectors of integration (r ≥ 1) (see Table 3 ).
Table 3 Co-integration test using the Johansen method
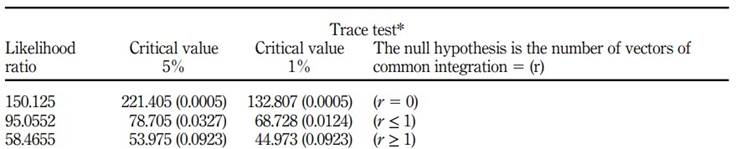
Note(s): *Trace test indicated one cointegrating equation at the 0.01 level and zero cointegrating equation at the 0.05 level. The max-eigenvalue test indicated one cointegrating equation at the 0.05 level and one cointegrating equation at the 0.01 level, which was significant according to the table value; see Mackinnon et al.’s (1999) p-values Source: Own elaboration
After ensuring the existence of co-integration among the relationships between the model variables, the demand function for the currency in Palestinian territories was estimated using the fully modified ordinary least squares (FM-OLS) method. This method modifies some of the conditions of the ordinary least squares method, especially regarding the problem of self-association.
The regression function of the dependent variable was estimated with the rest of the independent variables through the FM-OLS method, and the results are tabulated in Table 4. The placebo variable (the political divide between the West Bank and the Gaza Strip) was excluded due to its statistical insignificance at 1 or 5% significance (see Table 4).
Table 4 Estimation of the application form for the currency using the fully corrected FM-OLS metho
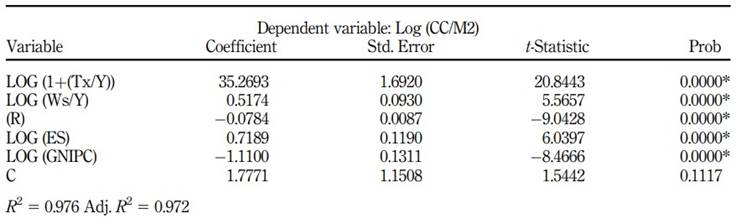
Note(s): *The variable is statistically significant at level 0.05
Source(s): Own elaboration
Before the estimation of the size of SE, the quality of the standard model needs to be assured. Table 3 shows that all the independent variables have a statistical significance of 1%. The value of the coefficient of determination (Adj. R2) is 0.972. Furthermore, the independent variables in the model explain the variation in the dependent variable (the proportion of money traded outside the banking system to the broad money supply M2), and only 2.8% of the change in the dependent variable is due to other reasons. The results are effective as far as standard models are considered. For more accuracy in the estimate, the real values were compared with the estimated values using the standard model outputs, and the quality of the model was verified.
This model has not tested the serial correlation and heteroscedasticity because the variables have been verified through the FM-OLS method.
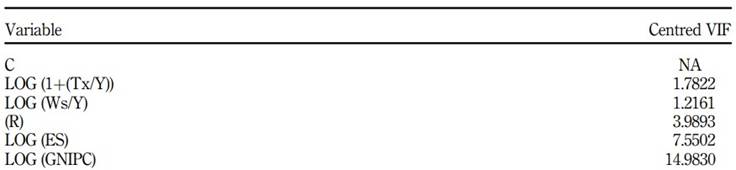
The model contains five independent variables; thus, the coefficient of variance inflation (VIF), which a linear regression equation can calculate, has been determined between each independent variable and the dependent variable, respectively. If a value obtained is greater than 10, then the interference can be calculated from the following equation:
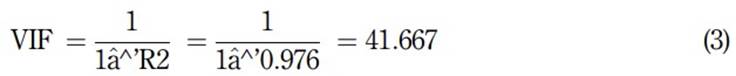
where R2 is the value of the selected factor for the original model.
The results shown in Table 5 demonstrate that the VIF value for each independent variable is less than the VIF of the original model (VIF = 41.667).
The second classical hypothesis assumed that the arithmetic mean of the residual model must be equal to zero (Studenmund, 2006). However, the probabilistic value of the arithmetic mean of the condensates was tested in Table 6, where t = −0.578 and prob. = 0.6549. This indicated the acceptance of the alternative hypothesis and rejection of the null hypothesis, as the arithmetic mean equalled zero.

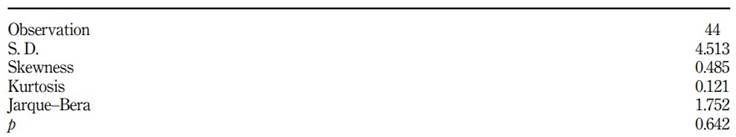
The third classical hypothesis assumed that the residual distribution follows the natural distribution. The Jarque-Bera test was carried out to analyze this condition in Table 7. The results depicted that the residuals using FM-OLS follow the distribution (J = 1.752) at a significant level (p-value = 0.642). This indicates the acceptance of the null hypothesis that assumes the residuals are distributed naturally.
It was ensured that the data was clear from all statistical flaws, and then the estimated regression equation was framed as follows:

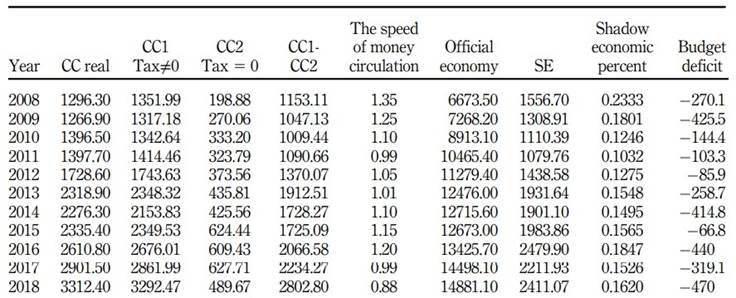
Based on the previous regression Equation (2), the two estimates were made for the variable CC/M2 (that is, the money outside the banking system (CC)). The first estimate resembled the general equation, as the tax variable (Tx) was the same; however, in the second estimate, the tax variable’s value was considered zero. The difference between these two estimates is the illegal money. By treating it with the speed of cash circulation, assuming that it is equal in both the formal and shadow economy, we obtained an estimate of the SE. Table 8 portrays the size of the estimated SE in the Palestinian territories for the years 2008-2018.
Discussion
5.1 Theoretical implications
The approach used in this study to estimate the extent of the Palestinian SE for 2008-2018 was adapted from Tanzi’s (1980) work. The FM-OLS approach was used to correct difficulties that could arise due to self-correlation.
Practical implications
Changes in the independent variables explained 97.6% of the change in the dependent variable, according to statistical inference. Except for the imaginary variable, all the variables were statistically significant, according to the results of the standard estimate. The co-integration tests revealed that the model’s variables have a long-term common-integration connection. The scale of the Palestinian territories’ SE has changed throughout time. Its estimates range from $1,079.758 to $2,479.898, representing 10.32 and 18.47% of GDP, respectively. According to Chatterjee and Turnovsky (2018), the rationale for SE is the growing tax burden mixed with labour market restrictions and institutional quality. The biggest size of the SE was reported in 2016, at $2,479.898 (in millions), while the largest was recorded in 2008.
The higher comparable statistics are due to political security, economic instability, and, most importantly, a high percentage of unemployment in the Palestinian territories. See, for example, PCBS (2019).
Following the declaration of a state of division in the Palestinian territories in 2007, Presidential Decree No. 9 of 2007 established a state of emergency in the Palestinian territories. This was followed by the issuance of Presidential Decree No. 18 of 2007 about the exemption of governorate residents from taxes and fees, which exempted citizens of the Gaza Strip.
The non-significance of the political division variable in the standard model was not contradicted by the Gaza Council of Ministers’ decision No. 188 in 2009, which endorsed the prolongation of the blockade; see, for example, the work of Hassan and Schneider (2016), DellÂ'Anno (2007), Kanao and Hamori (2010), Gulzar et al. (2010) and Levenson and Besley (1996).
Regarding GDP, SE accounted for 16% of the total in Palestinian territory annually. When compared to the percentages of neighbouring and regional countries, such as Jordan (18.37%), Egypt (38.25%), Israel (21.23%), Qatar (12.51%), the United Arab Emirates (26.09%), Kuwait (14.51%), Saudi Arabia (17.17%) and Iran (17.84%), this ratio is far more appropriate, and effectively projects a positive reality. However, the slowing of global economic development is the cause of these outcomes; see, for example, the work of Hassan and Schneider (2016).
The data published in the Palestinian statistical reports, especially those related to government tax revenues, reflect only the tax revenues collected by the legitimate Palestinian government in Ramallah and do not include the tax revenues collected by the government in Gaza. This has been a cause for creating huge regional disparities in the level of ease of transaction between Ramallah and Gaza.
6. Conclusions
The phenomenon of SE must be subsided, and it is a major challenge for the authorities of the Palestinian territories. However, it is not an impossible task. The study makes a few recommendations that could help effectively treat this problem. The Palestinian government must develop a national strategic plan that will boost the attractiveness of labour in the official sector and address the SE through a set of measures beneficial to the people’s circumstances. Researchers and planners from economic and development concerns must include shadow economic variables in the model as part of the planning and development process so that past data can be extrapolated and the future of the Palestinian territories may be projected (Night and Bananuka, 2020). Palestinian universities and research organizations should conduct large surveys and research to determine the true size of the Palestinian population.
The PMA should encourage local banks to educate Palestinians and encourage them to invest so they can deposit their savings in banks rather than keeping them liquid.
Another suggestion is that the Gaza Strip’s judiciary imposes stiff fines and ensures that they are properly implemented per the Palestinian president’s approval of the Anti-Money Laundering Law. The security services should launch large-scale efforts against the SE’s components, particularly those that promote financial and economic crime. The media should also start lobbying against the presence of the SE and urge the public to follow the appropriate rules and regulations.

