


 English (pdf)
 Article in xml format
 Article references
 Send this article by e-mail
 Cited by SciELO
  Similars in
SciELO
Similars in
SciELO 
 Permalink
Introduction
The influence of institutional investors over managerial decision making has increased as the amount of capital under institutional investor management has grown. With this trend comes to interest in the effect on managerial behavior and the differing incentives for institutional investors with larger or smaller stakes. Managers of listed firms are responsible for reporting financial statements that accurately represent the firm's true financial standing. Capital market participants depend on financial statement accuracy to make sound investment decisions. Indeed, financial statement accuracy is found to improve the investment efficiency by reducing moral hazard and adverse selection for market participants ( Biddle et al., 2009). Despite the importance of financial statement accuracy, managers may be incentivized to engage in earnings management (EM), the act of manipulating reported earnings with accounting maneuvers or operating decisions. Researchers have long studied the mechanisms and determinants of EM, and the role of institutional investor ownership (IO) is at the forefront of the topic ( Kaldoński et al., 2020; Lemma et al., 2018; San Martin Reyna, 2018).
However, analysis of the dynamics of the IO-EM relation, like nonlinearity, and consideration of certain aspects, like time period and EM approach, remain largely unaddressed. The influence of institutional investors has risen dramatically over the past decades, largely because investors are attracted to the low-cost diversification they offer ( Bebchuk et al., 2017). Institutional investors hold about 80% of the market value of U.S. firms according to a 2017 report (1). This means that they account for the vast majority of votes cast at the annual meetings of most U.S. firms, leading them to substantially influence corporate governance and managerial decision-making. We take a comprehensive approach to improve the understanding of the IO-EM relation by analyzing a panel dataset of listed U.S. firms. We consider how IO affects accrual-based and real activities EM differently and how it affects earnings surprises, which we use as a proxy to capture all EM approaches. Going further, we consider whether these relations are nonlinear and analyze how they evolved in the post-Sarbanes-Oxley Act (SOX) period.
We find a positive relation between IO and the likelihood of earnings surprises, evidence that managers are encouraged by IO to manage earnings overall. Considering the direct measures of accrual-based and real activities EM, we find evidence that abnormal discretionary accruals are also positively affected by IO. However, we find evidence that IO has a negative effect on abnormal production costs and abnormal decreases in discretionary expenses. This corroborates prior findings that institutional investors are likely to disproportionately discourage managers from engaging in real activities EM ( Zang, 2012; Roychowdhury, 2006), which has an adverse effect on long-term firm value ( Graham et al., 2005). We also find evidence of nonlinearity. Our findings show evidence that IO's relation with earnings surprises and abnormal discretionary accruals is concave and IO's relation with abnormal production costs and abnormal decreases in discretionary expenses is convex. Finally, we find that these relations are altered in the post-SOX period. To our knowledge, ours is the first study to consider a nonlinear IO-EM relation for U.S. firms and to consider changes to the relation over time using an array of EM measures.
Literature review
The importance of financial statement accuracy has led researchers to scrutinize the influence of a wide range of corporate governance and oversight attributes. These range from the characteristics of executives and the board ( Davis and Garcia-Cestona, 2023), to capital structure ( Ater and Hansen, 2020), and the level of IO, especially as the influence of institutional investors grows.
IO is known to affect firm outcomes such as innovation ( Sakaki and Jory, 2019), performance ( Elyasiani and Jia, 2010) and risk-taking ( Jumreornvong et al., 2018). From the perspective of agency theory, institutional investors are believed to serve as monitors of management. This is asserted in the seminal work by Shleifer and Vishny (1997), who argue that the large stakes held by institutional investors allow them to analyze information and monitor managers to an extent that is unfeasible for smaller stakeholders. Institutional investors holding large stakes are also more likely to engage with firms as monitors because the option to exit from a large position is more costly ( Maug, 1998).
Davis-Friday and Frecka (2002)describe EM as “the intentional intervention of management to change the reported earnings number (by making operating decisions or by changing accounting procedures) from what it would otherwise have been in the absence of such intervention” (p. 58). EM is widely understood to be unethical, especially following the high-profile accounting scandals of the early 2000s and the passage of SOX ( Grasso et al., 2009). Drawing from agency theory, accounting serves two purposes toward aligning the interests of shareholders and managers: informativeness and stewardship ( Ronen and Yaari, 2008, p. 6). The informativeness of accounting, disclosed in financial reports, advises owners and potential investors on the predicted future cash flows and risks associated with the firm's continued operations. From the stewardship perspective, financial reports provide the information demanded by shareholders to align interests and constrain management. In the most severe cases, EM is engaged in my management with the intent of misrepresenting information and reducing transparency (Ronen and Yaari, 2008). Considering the monitoring role of institutional investors and because they hold significant stakes in most listed firms, institutional investors are well positioned to have a measurable influence over EM.
2.1 Nonlinearity
We believe that considering a nonlinear relation in this context is crucial because we expect the effect of IO to change as the level of IO increases, thus creating a nonlinear effect (see Koh, 2003). This effect is left undetected when estimating a linear relation between IO and EM.
How institutional investors influence EM is debated. A question at the heart of this topic is whether institutional investors act as stakeholders interested in short-term profitability that drive managers to manipulate earnings to avoid reporting disappointing earnings, or as monitors stewarding good corporate governance practices ( Roychowdhury, 2006, p. 343). Chung et al. (2002) consider this question and find a negative relation between IO and absolute discretionary accruals, thus supporting the role of institutional investors as monitors.
Relatively little attention has been paid to the possibility of a nonlinear IO-EM relation. Using a sample of Australian firms, Koh, 2003 finds that IO increases EM when IO levels are low, but that it has the opposite effect at high levels. Koh, 2003posits that a nonlinear relation between IO and accrual-based EM exists because of the following. At low levels, IO represents ownership by transient institutional investors interested in near-term earnings. Such investors are likely to “vote with their feet” and exit positions that miss earnings forecasts, thus pressuring managers to engage in EM to avoid sell-offs. Alternatively, at high levels, IO represents greater ownership by institutional investors holding large positions that are likely to reduce EM by engaging with firms as monitors and being less concerned with near-term earnings.
2.2 Earnings management measures
EM research has grown from considering accrual-based measures alone to including measures of real activities EM as well ( Roychowdhury, 2006). Bushee (1998)considers whether IO drives EM, finding that managers are less likely to cut research and development expenses to meet earnings goals when IO is higher. This serves as initial evidence that the effect of IO on disparate EM measures may not be homogeneous. Institutional investors that maintain stable equity holdings are found to reduce the use of real activities EM (Kaldoński et al., 2020; Sakaki et al., 2017). Alternatively, an international study found that IO negatively affects accrual-based EM and does not affect real activities EM ( Lemma et al., 2018).
There is an important distinction between accrual-based and real activities EM that likely influences the actions taken by institutional investors. While manipulating discretionary accruals does not affect overall cash flows, the same cannot be said for real actions taken to manage earnings, which can have a negative overall effect ( Roychowdhury, 2006; Zang, 2012). In a survey of executives, Graham et al., 2005found that most executives are willing to take actions that smooth reported earnings, even at the expense of long-term firm value, and that they prefer such approaches over accrual-based methods. Zang (2012)posits that institutional investors, being more informed than other investors, are likely to understand the long-term consequences of real activities EM, leading them to monitor such practices more than accrual-based alternatives.
For these reasons, we consider the nonlinearity of the IO-EM relation, measuring its change over time, and using several approaches to proxy EM.
Method
3.1 Data and sample
We form a sample of listed U.S. firms from three databases. Data on firm characteristics and auditor characteristics were collected from Compustat. Data on institutional ownership are collected from Thompson Reuters. Data on analyst forecasted earnings and actual reported earnings are collected from I/B/E/S.
Our sample spans from 1981 (the first year of Thompson Reuters data availability) to 2019 (the final year of data availability). Our sample was formed using all observations with available data from the sources mentioned above to calculate all variables used. Thus, comprising 59,503 firm-year observations representing 8,340 individual firms.
3.2 Dependent variables
We use four EM measures, which serve as the dependent variables of the study. We begin with earnings surprises, a measure that captures ex-post evidence that earnings were managed. We then expand the analysis, using three measures of EM. The following sections describe the dependent variables in greater detail.
3.2.1 Earnings surprises
Ex-post measures of EM consider evidence that EM occurred, regardless of the type engaged in by managers. We use one such measure, earnings surprises, as the dependent variable of this study. A measure that captures both accrual-based and real activities EM is important for several reasons. Managers are found to choose between EM approaches depending on the relative cost of each ( Zang, 2012). The level of IO likely affects the type of EM engaged in by managers as institutional investors are found to pressure firms to constrain real activities EM more than accrual-based EM ( Roychowdhury, 2006; Zang, 2012). Additionally, the enactment of SOX in 2002 was followed by a decrease in accruals-based EM, thus pressuring managers to engage in more real activities EM as an alternative ( Cohen et al., 2008). For these reasons, we begin our analysis using earnings surprises, a measure that captures evidence of both accrual-based and real activities EM. An earnings surprise occurs when reported earnings exactly meet or barely beat the consensus analyst forecast ( Bhojraj et al., 2009). When earnings are reported, market participants respond strongly to whether the reported earnings beat or miss forecasts ( Bartov et al., 2002). Firms that meet or beat forecasts are found to enjoy higher returns than firms with similar earnings relative to forecasts that miss analyst projections (Bartov et al., 2002). There are also consequences for managers when analyst forecasts are missed. CEOs and CFOs are found to face bonus cuts, equity grant cuts and forced turnover when analyst forecasts are barely missed ( Edmonds et al., 2013; Mergenthaler et al., 2012). For these reasons, exactly meeting or barely beating analyst forecasts serves as evidence of EM. We can see evidence of this in our sample. If we assume that no EM exists in our sample, we would expect the differences between reported earnings and forecasted earnings to be normally distributed and centered around zero, with about the same number of observations barely missing and barely beating forecasted earnings. However, this is not the case. In our sample of 60,721 firm-year observations, slightly less than half (49.3%) met or beat the analyst forecast. However, as shown in Figure 1, while 6,994 observations exactly met or barely beat the consensus forecast, only 3,178 barely missed it. Additionally, while the right side of Figure 1 shows a relatively uniform decrease in frequency, the left side appears erratic and non-uniform, likely because of manipulation occurring to avoid disappointing earnings reports. This shows evidence of the effectiveness of earnings surprises as an EM proxy.
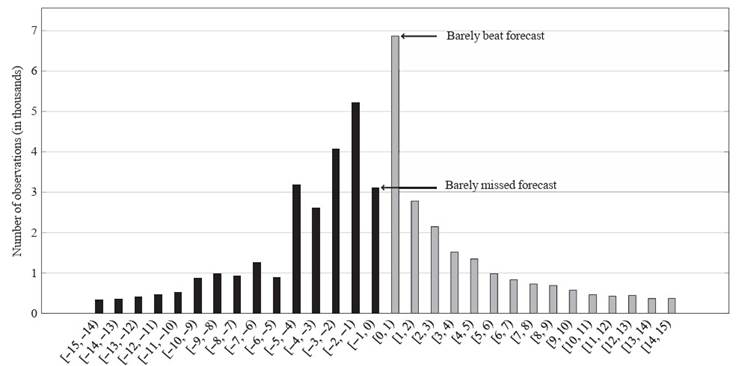
Figure 1 Difference in the number of observations that barely beat and barely missed the consensus analyst forecast. Of the 59,503 firm-year observations from our sample with reported earnings per share within 15 cents of the consensus analyst forecast, 6,870 beat the forecast by 1 cent or less while only 3,112 missed it by 1 cent or less
Since we are analyzing nearly 4 decades of data, it is interesting to observe how the proportion of firm-year observations with earnings surprises has changed over time within our sample. This is shown in Figure 2. The figure shows evidence of the effectiveness of SOX in reducing earnings management. We observe high volatility in the level of earnings surprises through the 1980s and 1990s, with a peak of 21.8% in 2002. The post-SOX observations show an immediate precipitous drop followed by reduced volatility and generally fewer earnings surprises.

Figure 2. Change in percentage of firm-year observations from our sample with earnings surprises from 1981 to 2019
3.2.2 Accrual-based earnings management
EM is generally divided into two types: accounting-based and operating-based, depending on the method engaged in by management ( Cohen et al., 2008; Roychowdhury, 2006). We analyze the effect of IO on both types.
In accounting, accruals occur when revenues or expenses are realized before the cash related to the transaction has been exchanged. While accruals are commonplace, they can be manipulated by bad actors to temporarily inflate reported earnings. Ronen and Yaari, 2008 define discretionary accruals as “accruals that arise from transactions made or accounting treatments chosen in order to manage earnings” (p. 372). Jones (1991)developed a method for measuring discretionary accruals, now known as the Jones model, to test whether firms managed earnings to benefit from import relief. Kothari et al. (2005)found that the reliability of discretionary accrual measures is improved by controlling for performance. Thus, we use a performance-matched measure of the Jones model including a constant term (2).
Discretionary accruals are calculated as the difference between total accruals (3) and non-discretionary accruals. We calculate discretionary accruals as the residual (error term) from equation (2), which is regressed cross-sectionally for each group of firm-year observations from the same year and the same two-digit SIC code.
where TAt is total accruals in year t, At−1 is total assets in year t −1, ΔSt is change in sales
from year t −1 to year t, PPEt is net property, plant and equipment in year t, and ROAt is total income divided by total assets in year t.
As with prior studies, when calculating discretionary accruals, we drop all firm-year observations from year-industry groups with less than 15 observations ( Zang, 2012).
3.2.3 Real activities earnings management
Real activities EM measures consider real economic activities taken by managers to manage earnings ( Graham et al., 2005; Zang, 2012). Graham et al. (2005) survey executives and find that the vast majority are willing to take economic actions that smooth reported earnings at the expense of long-term firm value. Zang, 2012stresses that it is important for researchers to consider both accrual-based and real activities EM. She finds that managers tradeoff between the two methods based on their relative costs such that neither method alone represents the whole picture.
Roychowdhury, 2006develops three measures of real activities EM: abnormal operating cash flow, abnormal production costs and abnormal decreases in discretionary expenses. Many researchers have moved to using only the measures of abnormal production costs and abnormal decreases in discretionary expenses ( Harris et al., 2019; Sakaki et al., 2017; Zang, 2012) because, as noted byRoychowdhury(2006), the direction of the net effect of EM on operating cash flow is ambiguous. This makes it difficult to interpret the meaning of a relation in a given direction. Therefore, we adopt abnormal production costs and abnormal decreases in discretionary expenses as our two proxies for real activities EM.
Managers may enact excessive price discounts and engage in overproduction to temporarily inflate reported earnings ( Roychowdhury, 2006). This can be observed as abnormally high production costs relative to sales. Therefore, abnormal production costs are calculated as the residual fromequation (3), which is regressed cross-sectionally for each group of firm-year observations from the same year and the same two-digit SIC code.

Where Prodt is cost of goods sold in year t plus change in inventory in year t.
Managers may also inflate earnings temporarily by reducing discretionary expenditures. This can be observed as abnormally low discretionary expenditures relative to sales ( Roychowdhury, 2006). As with prior studies, we multiply the level of abnormal discretionary expenditures by −1 to capture abnormal decreases in discretionary expenses ( Harris et al., 2019; Sakaki et al., 2017). Therefore, abnormal decreases in discretionary expenses are calculated as −1 multiplied by the residual from equation (4), which is regressed cross-sectionally for each group of firm-year observations from the same year and the same two-digit SIC code.
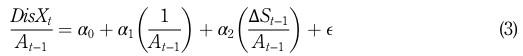
where DisXt is research and development expenses plus advertising expenses plus selling, general and administrative expenses in year t (4).
As with prior studies, when estimating the real activities EM models, we drop all firm-year observations from year-industry groups with less than 15 observations ( Roychowdhury, 2006; Zang, 2012).
3.3 Independent variables
The variable of interest is the level of firm ownership held by institutional investors (IO). IO is calculated as the number of shares held by institutional investors divided by the number of outstanding shares. Thomson Reuters classifies entities as institutional investors if they have over $100 million in assets under management. We capture evidence of nonlinear IO effects using the squared term of IO (IO2).
We include five controls for firm characteristics. Larger firms are subject to increased monitoring and face greater consequences for financial misconduct ( Deli and Gillan, 2000). We measure Firm size as the natural log of total assets. We control for firm performance proxied by return on assets (ROA) calculated as total income divided by total assets. We include the Market to book ratio as a measure of market valuation calculated as the firm's market value divided by its book value. Firms with greater levels of debt face increased monitoring from creditors ( Zamri et al., 2013). Alternatively, firms seeking new debt are found to engage in more income-increasing EM ( Ater and Hansen, 2020). We control for Leverage calculated as total liabilities divided by total assets. Finally, research shows that larger auditors provide better quality audits ( Becker et al., 1998; DeAngelo, 1981; Lennox, 1999; Viana et al., 2022). The variable Big auditor indicates whether the firm's auditor is one of the big four.
Table 1 provides a description of the variables and Table 2 shows the descriptive statistics. We test for multicollinearity within the independent variables by examining their variance inflation factors (VIFs). The mean, highest and lowest VIF of the independent variables were 1.18, 1.49 and 1.00, respectively, indicating no multicollinearity concerns. Table 3 gives a breakdown of the correlation between all variables. We find that none of the independent variables are highly correlated, except for IO and IO2, which are correlated by design. We find that Firm size is moderately correlated with the following independent variables: IO (0.44), IO2 (0.43), ROA (0.22), Leverage (0.29) and Big auditor (0.22).
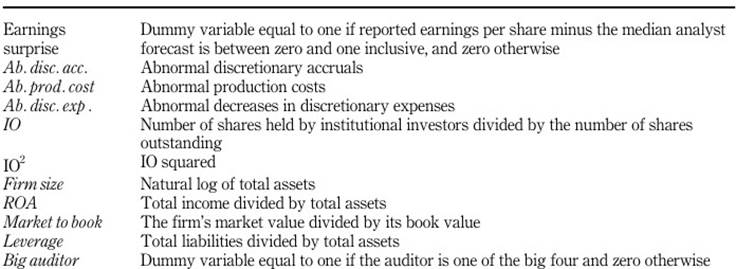
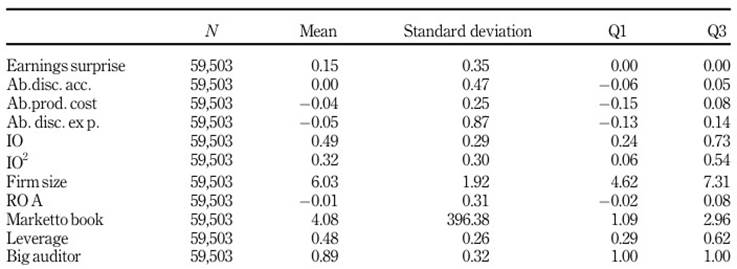
Table 3 Correlation matri
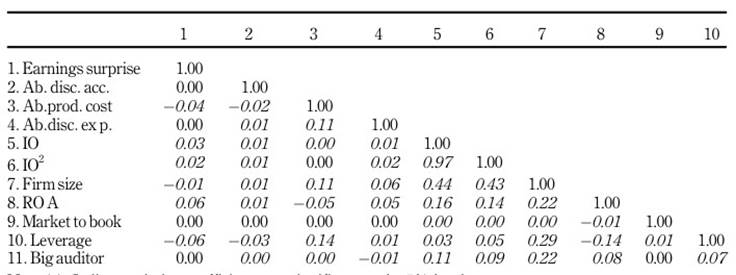
Note(s): Italic correlation coefficients are significantatthe5%level
Source(s): Table created by authors
3.4 Empirical modeling
Using a sample of listed U.S. firms from the period 1981-2019, we study how EM is affected by IO and test for the presence of a nonlinear relation. First, we develop a regression model which tests for a linear relation between IO and EM, as shown in equation (4).

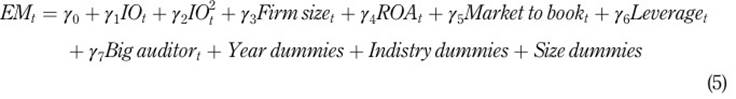
where EMt is a general term for the four EM proxies in time t.
A required assumption of linear regression models, such as equation (4), is that the dependent and independent variables are linearly related. We posit that IO has a quadratic effect on EM. We test for this by including the quadratic (squared) term IO2 shown in equation (5). This allows us to determine whether there is evidence of a quadratic IO-EM relation, demonstrated by joint significance of the linear and quadratic coefficients (see Aghion et al., 2005). If so, it shows whether the model estimates a convex (U shaped) relation, demonstrated by a negative linear term and positive quadratic term, or a concave (inverted-U shaped) relation, demonstrated by the opposite.
The same five control variables are used in each model. We include year dummies and industry dummies to control for time-variant and industry-variant factors. Because of the correlation between Firm size and other regressors, noted above, we include size dummies so that the regressions include negligible firm size variation to abate multicollinearity concerns. The size dummies are based on decile groups of the variable Firm size.
We use the Hausman test to determine whether the observed and unobserved variables are uncorrelated, an assumption necessary for regressing the between-firm effects (also known as random effects) ( Allison, 2009). The test is significant for all dependent variables except for Abnormal discretionary accruals. This indicates that within-firm effects regression (also known as fixed effects) should be used for our analysis, except with Abnormal discretionary accruals. However, there are significant disadvantages to within-firm regression related to the characteristics of this study. First, because Earnings surprise, the main dependent variable, is dichotomous, firms without variation of this variable (with no earnings surprises or with only earnings surprises) are dropped from the within-firm analysis. This results in 5,004 firms, or 18,565 firm-year observations, being dropped. This reduces the efficiency of the within-firm analysis considerably and may introduce bias because firms with the lowest and highest perceived propensity for EM (with no earnings surprises or only earnings surprises) are not considered. Second, at the firm level, IO is unlikely to have a high variation within the limited number of firm-year observations available for each firm. Indeed, while the standard deviation of the variable IO for the whole population is 0.29, the average of the standard deviations of IO for all firm groups is far lower at 0.14. This results in within-firm regression models being less efficient in modeling the effects of IO because only the within-firm effects are analyzed.
Despite the limitations of fixed effects regression, the Hausman test results must be seriously considered. For these reasons, we use between-within regression models (also known as hybrid regression) ( Allison, 2009). By using a between-within regression approach, the effects of the regressors are decomposed into between-firm and within-firm components. This allows us to analyze the between-firm effects, with the advantage of greater efficiency and the within-firm effects simultaneously. If a given variable has a significant between- and within-firm effect in the same direction, then substantial evidence of the effect is shown. However, if the between-firm effect is significant and the within-firm effect is not, then the limitations of the evidence must be considered given the correlation between the observed and unobserved variables indicated by significant Hausman tests for all dependent variables, except Abnormal discretionary accruals.
We began by regressing equations (4) and (5) over the full period, 1981-2019. We then regressed them over the post-SOX (modern regulatory) period, 2003-2019, to examine the resulting changes. Because the dependent variable Earnings surprise is dichotomous, we use logistic regression in Models 1, 5, 9 and 13. Because the remaining dependent variables are continuous, we use linear regression in all other models.
Results
Table 4 shows the results of Models 1-4, which estimate IO's effect on four measures of EM. We begin with earnings surprises in Model 1, an indicator of firms that exactly meet or barely beat the consensus analyst forecast. The model shows a significant positive relation between IO and earnings surprises from both the between-firm effects and the within-firm effects (p < 0.01). Because earnings surprises are indicators of EM, this shows evidence that institutional investors pressure managers to avoid disappointing earnings reports, increasing the likelihood that they manage earnings.
Table 4 Earnings management and institutional investor ownership-between-within panel regression
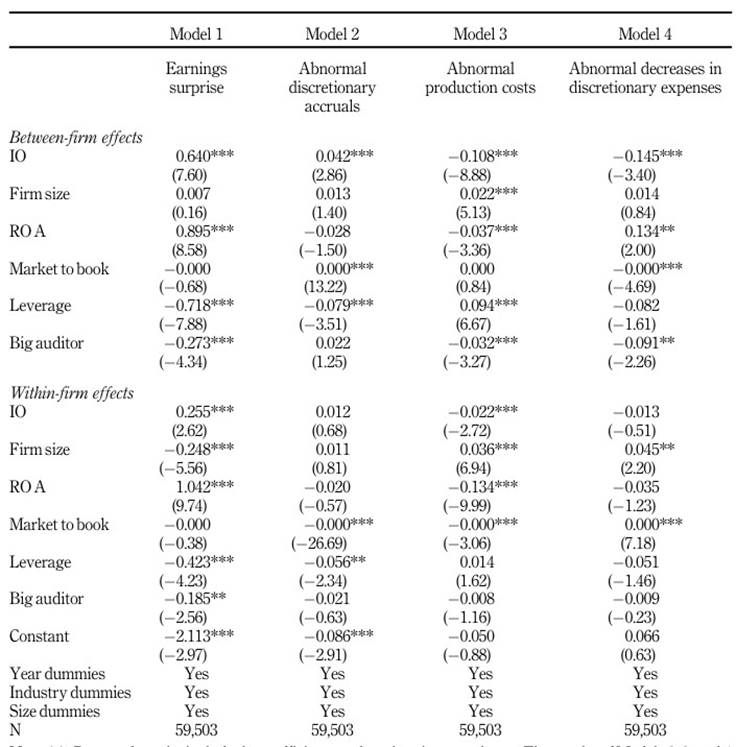
Note(s): Reported results include the coefficients and t-values in parentheses. The results of Models 2, 3, and 4 are based on robust standard errors. *, **, and ***denote significance levels of 10, 5, and 1%, respectively. Industry dummies are based on the two-digit SIC codes. Size dummies are based on decile groups of the variable Firm size
Source(s): Table created by authors
Considering accrual-based EM in Model 2, the between-firm effects show evidence of a positive relation between IO and abnormal discretionary accruals (p < 0.01). This is not supported by the within-firm effects. Turning to Models 3 and 4, we find evidence of a negative relation between IO and real activities EM. Model 3 indicates a negative relation between IO and abnormal production costs from both the between-firm effects and the within-firm effects (p < 0.01). The between-firm effects of Model 4 show evidence of a negative relation between IO and abnormal decreases in discretionary expenses (p < 0.01) that is not supported by the within-firm effects.
Next, we test for nonlinearity. Table 5 shows Models 5-8, which are identical to Models 1-4 but with the inclusion of the variable IO2 to model a quadratic IO-EM relation. Model 5 shows evidence that IO affects earnings surprise likelihood positively (p < 0.01) and IO squared affects earnings surprise likelihood negatively (p < 0.01 and p < 0.05 for the between-firm and within-firm effects, respectively). This indicates that the IO-EM relation is nonlinear, being concave in form. Evidence of a nonlinear relation with IO is also discovered for abnormal discretionary accruals, revealed in the between-firm effects section of Model 6, given the positive effect of IO (p < 0.01) and the negative effect of IO squared (p < 0.05).
Table 5 Earnings management and institutional investor ownership-between-within panel regression
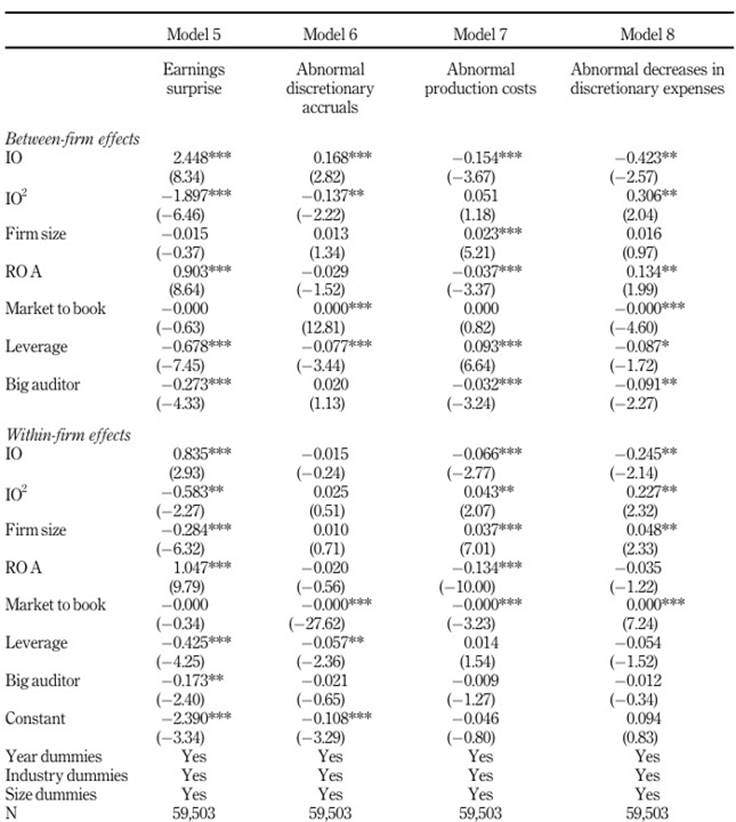
Note(s): Reported results include the coefficients and t-values in parentheses. The results of Models 6, 7, and 8 are based on robust standard errors. *, **, and ***denote significance levels of 10, 5, and 1%, respectively. Industry dummies are based on the two-digit SIC codes. Size dummies are based on decile groups of the variable Firm size
Source(s): Table created by authors
Turning to Models 7 and 8, we find evidence that IO has a nonlinear effect on real activities EM, but that the relation is convex in form. The within-effects section of Model 7 shows evidence that IO affects abnormal production costs in a convex way, given the negative effect of IO (p < 0.01) and the positive effect of IO squared (p < 0.05). However, this is not supported by the between-firm effects analysis, which only shows evidence of a negative linear relation since IO squared is not found to have a significant effect. Model 8 shows evidence that the relation between IO and abnormal decreases in discretionary expenses is convex, given the negative effect of IO (p < 0.01) and the positive effect of IO squared (p < 0.05) from both the between-firm and within-firm effects.
4.1 Post-Sarbanes-Oxley Act
Because of the substantial reforms to financial reporting regulations in the United States following the passage of SOX, we test how our results differ when analyzing the post-SOX period. Tables 6 and Table 7 are identical to Tables 4 and 5, respectively, but with pre-SOX observations excluded.
Table 6 Earnings management and institutional investor ownership, post-SOX-between-within panel regression
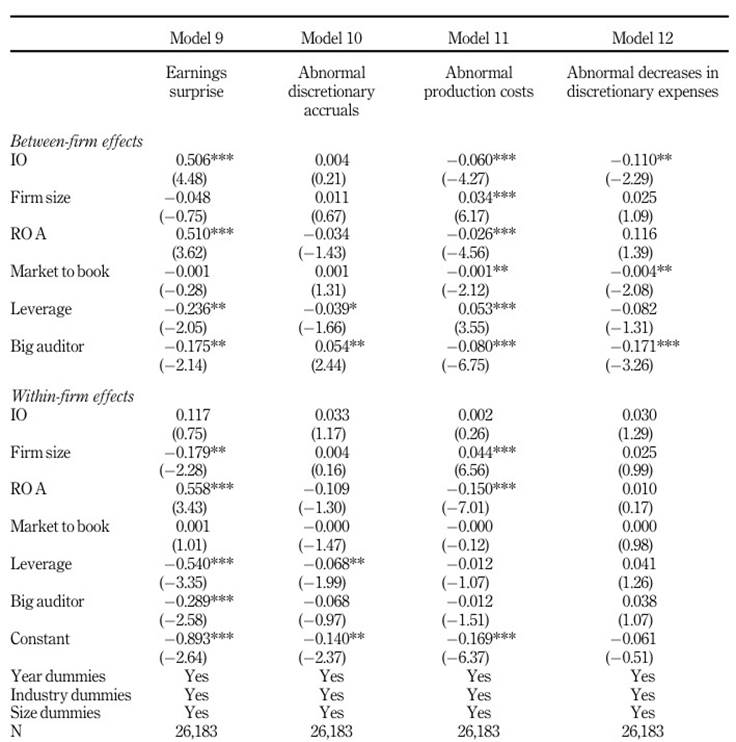
Note(s): Reported results include the coefficients and t-values in parentheses. The results of Models 10, 11, and 12 are based on robust standard errors. *, **, and ***denote significance levels of 10, 5, and 1%, respectively. Industry dummies are based on the two-digit SIC codes. Size dummies are based on decile groups of the variable Firm size
Source(s): Table created by authors
Table 7 Earnings management and institutional investor ownership, post-SOX-between-within panel regression
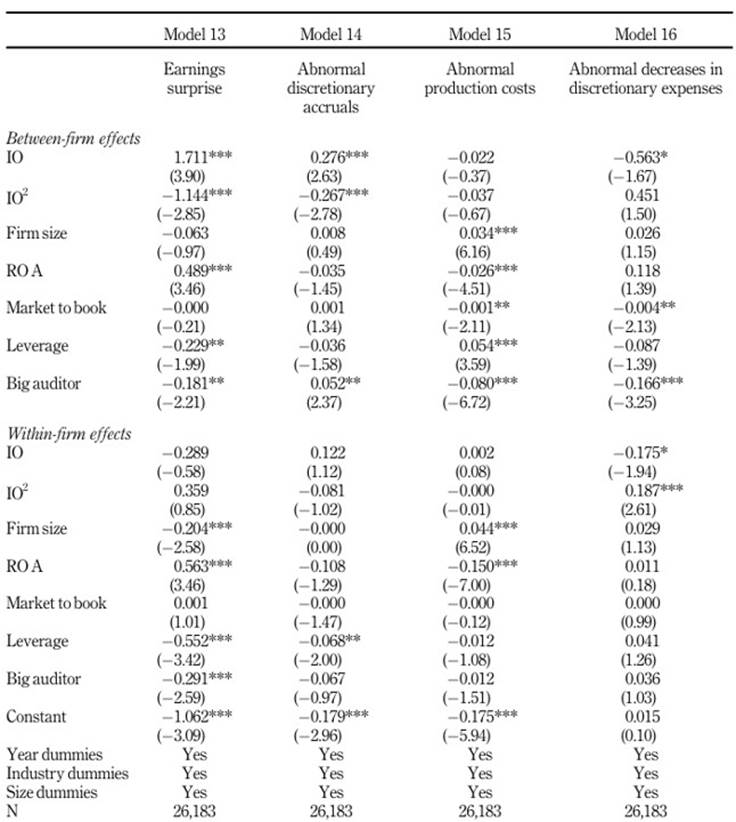
Note(s): Reported results include the coefficients and t-values in parentheses. The results of Models 14, 15, and 16 are based on robust standard errors. *, **, and ***denote significance levels of 10, 5, and 1%, respectively. Industry dummies are based on the two-digit SIC codes. Size dummies are based on decile groups of the variable Firm size
Source(s): Table created by authors
The first observable difference in the post-SOX models is that the evidence of a negative linear effect and a concave nonlinear effect between IO and earnings surprises is only present in the between-firm effects sections of Models 9 and 13. This is possibly due to endogenous regressors related to the between-firm effects analysis, evident from the significant Hausman test. However, we believe it is likely that the between-firm and within-firm effects differ in Models 9 and 13 (with respect to the variables IO and IO2) because of the loss of efficiency of the within-firm effects analysis coupled with less EM overall as a result of SOX. Indeed, earnings manipulation reduction was the fundamental purpose of SOX. This is also supported by the reduced coefficients related to IO and IO2 in the between-firm effects post-SOX analysis, likely indicating that IO is a weaker explainer of EM post-SOX because there is less EM present. Similarly, the positive linear effect of IO on abnormal discretionary accruals from Model 2 (p < 0.01) is lost post-SOX (Model 10). However, evidence of a concave relation between IO and abnormal discretionary accruals remains in the between-firm effects section of Model 14. In the post-SOX period, there is only evidence of a negative linear relation between IO and abnormal production costs (p < 0.01), despite some evidence of a convex relation being present in the full sample. Finally, evidence of a negative linear relation and a convex nonlinear relation between IO and abnormal decreases in discretionary expenses are present in the between-firm effects section of Table 6 (p < 0.05) and the within-firm effects section of Table 7 (p < 0.10 and p < 0.05 for the IO and IO2, respectively).
Discussion
Overall, we show that IO is a significant determinant of EM outcomes. We use earnings surprises as the main dependent variable of the study. We posit that earnings surprises capture both accrual-based and real activities EM since they indicate ex-post evidence that EM has occurred. We find evidence of a positive linear relation between IO and earnings surprises in both the between-firm and within-firm effects. This indicates that managers face greater pressure to manage earnings to avoid disappointing earnings reports as IO increases. However, we find evidence that this relation is nonlinear, being concave in form. Thus, indicating that at low levels of IO, increasing IO results in greater EM. And, once a turning point is reached, further increases in IO result in decreasing EM. This evidence corroborates the study by Koh, 2003, who found a concave relation between IO and abnormal discretionary accruals for Australian firms. Koh, 2003 argues that IO has a concave effect on EM because of the type of institutional investors that hold a firm's stock, which changes as the level of IO increases. We believe that this likely drives the nonlinear effect of IO on earnings surprises that we find.
Our findings suggest that the relation between IO and EM is dynamic and heavily context-dependent, with the EM type and the passage of SOX playing important roles. We find evidence of nonlinearity related to earnings surprises, but we find less evidence of nonlinearity post-SOX. We also find strong evidence that IO affects accrual-based EM positively overall and real activities EM negatively overall. This is an interesting finding and, as discussed by Roychowdhury, 2006) and Zang (2012), is likely due to institutional investors not wanting portfolio firms to miss analyst forecasts (thereby encouraging EM), but also not wanting managers to engage in real activities EM which affects long-term firm value adversely ( Graham et al., 2005).
5.1 Theoretical implications
From the perspective of agency theory, the role of ownership structure as a determinant of firm outcomes is an important topic, especially as the prominence of institutional investors increases. Studies in this field typically assume that the effects of increased IO are constant and linear (see Federo et al., 2020). With a focus on financial reporting quality, our study highlights the dynamic relation between IO and EM, demonstrating significant evidence of nonlinearity. Given our findings, research on the relation between IO and firm outcomes should not assume constant linear effects, especially when related to financial reporting quality.
5.2 Policy implications
Our study has important implications for policymakers. Functioning capital markets rely on market participants trusting that financial reports accurately represent the true financial standing of firms. An understanding of factors like EM that deteriorate that trust is essential. To this end, we highlight the importance of institutional investors and show evidence that their effect on financial reporting outcomes changes as the stake they hold in firms increases. Policies aimed at curbing EM should consider ownership structure and factor in the level of IO. Our findings are also relevant to auditors and boards of directors evaluating financial reporting quality controls. Auditors should consider the level of IO as a nonlinear determinant of audit risk. Similarly, boards of directors, and especially audit committees, should evaluate the effects of ownership structure and the level of IO on the informativeness of financial reports, which could be degraded by EM.
5.3 Limitations and future research agenda
An important limitation of our study is that we measure institutional investor ownership as the percentage of a firm's shares held by entities with at least $100 million in assets under management. In practice, the many institutional investors have differing incentives and behaviors, which we do not account for because of the difficulties in capturing that information.
Our study reveals interesting avenues for future research. Building on our findings, future studies could consider differences in the levels of financial statement irregularities or EM between firms that barely beat or barely miss analyst forecasts. Future studies could also examine how EM is affected by different types of institutional investors. We define institutional investors broadly; however, they are not homogeneous and consideration of how EM is affected by institutional investor type could yield interesting results. Finally, future studies could examine whether these results hold for firms based in other regions, such as Latin America. Especially since most research in this field is US-focused and the effect of IO on Latin American firms has received less consideration.
6. Conclusion
There is an enduring need to improve earnings quality and study organizational factors that affect financial reporting processes. As institutional investors grow in prominence, holding increasingly large stakes in listed firms, their importance as a fundamental part of corporate governance grows. We take a comprehensive approach to studying the effect of IO on EM in an attempt to shed light on the complexities of the relation. We test for and find evidence of nonlinearity and analyze changes resulting from the passage of SOX.
Using a sample of 59,503 listed U.S. firm-year observations from 1981-2019, we find evidence that IO is a strong determinant of EM outcomes but that the direction and nature of the effect are highly context-dependent. Regarding nonlinearity, we find evidence that the IO-EM relation is concave, indicating that IO affects EM positively at low levels and negatively at high levels, once a turning point is reached. These findings contribute to research on the role of institutional investors. Addressing whether they act more like short-term profitability focused investors or as monitors stewarding good corporate governance practices, thus creating avenues for future research.

