


 English (pdf)
 Article in xml format
 Article references
 Send this article by e-mail
 Cited by SciELO
  Similars in
SciELO
Similars in
SciELO 
 Permalink
Introduction
History and economic rationale suggest that there are general benefits derived from regional economic blocs like the European Union, North American Free Trade Agreement, Community of Sahel-Saharan States and Southern African Development Community (SADC), to mention a few. Similarly, countries have long observed the socioeconomic advantages of global trade cooperation, such as the General Agreement on Tariffs and Trade, which was replaced by the World Trade Organization in 1995. An inclusive empirical assessment is imperative to understand the nature and extent of beneficiation towards financial markets flowing from regional economic integration (REI). A textbook explanation says that the essence of economic integration is to create a conducive environment for cooperating countries to benefit from increased international trade, minimised tariffs, synergy for monetary policy and favourable markets' regulatory regimes (Carbaugh, 2018). A developing research stream that flows from this concerns the trade-alliance-induced economic integration with financial markets, which is the focus of the current study. Extant literature shows that economic integration and financial market linkages vary across economies based on integration structure ( Kim et al., 2018 ) and financial development (Lahrech and Sylwester, 2013). Also, the effect of REI on financial markets differs according to emerging markets ( Guesmi and Nguyen, 2011 ), economic aggregation of the national, industry, and the firm level ( Fazio, 2007 ; Garcia-Herrero et al., 2009 ; Karim and Majid, 2010 ). Further, some economic blocs show a tendency of member states to trade outside their regions or display misaligned trade behaviours (Garcia-Herrero et al., 2009; Lombana et al., 2021 ). These studies reveal insightful characterisation of REI and financial integration.
Unfortunately, the REI and financial integration nexus research tends to concentrate on economies with long histories of regional economic blocs like Asia, Europe, South America and North America. Another literature skewness is evident in the recent reviews that show separate or parallel research on economic integration ( Upalat, 2022 ) and financial integration ( Patel et al., 2022 ), with few exceptions (like Paramati et al., 2016 ; Song et al., 2021 ). The current study corrects the indicated research weaknesses by extending the empirical examination to the unique setting of economic integration in the BRICS regional bloc. In particular, the present study takes South Africa, located in the farthest south of the African continent, as a target market and investigates whether South Africa's bilateral trade with BRIC impacts the economic bloc's stock market co-movement. BRIC (Brazil, Russia, India and China) was formed in 2006 and was later joined by South Africa in 2010 to form BRICS.
Unlike the set-up of many economic blocs, the member states of BRICS are situated in distant geographic areas (Africa, Asia, Europe and South America). This dispersed REI framework introduces a critical empirical case with a bearing on the stylised literature finding that countries' geographical proximity impacts stock market linkages ( Asgharian et al., 2013 ; Fazio, 2007 ; Karim and Majid, 2010 ; Paramati et al., 2016 ). The author is unaware of a study with the same empirical objective as the current research. The rest of the paper is organised as follows: Section 2 reviews related literature. Section 3 explains the research methodology. Section 4 presents and interprets the results. Section 5 discusses the results, and Section 6 concludes the study.
Literature review
2.1 The BRICS regional economic bloc
The need to understand the economic experience of South Africa in BRICS, coupled with ongoing innovation of the domestic stock market, the Johannesburg Stock Exchange (JSE), inspires the current research topic. Many innovative advancement emerged in the JSE in recent decades (the late 1990s to the 2020s). The JSE launched a significant acquisition programme that resulted in the takeover of the South African Futures Exchange (SAFEX) in 2001, followed by the Bond Exchange of South Africa (BESA) in 2009. Just before South Africa became a member of BRICS, the JSE installed an electronic clearing and settlement technology known as, Shares Transactions Totally Electronic (Strate) in 1997. Another innovation includes the collaboration of the JSE with the London Stock Exchange (LSE) to introduce a series of joint indices labelled FTSE/JSE since 2002. In 2003, the JSE introduced a stock-listing board exclusively for small and medium-sized firms called Alternative Exchange (AltX) and a special board for currency and interest rate markets, the Yield X. Although some of the changes occurred before BRICS, this fact is appropriately controlled in the empirical design and explained under the methodology section.
Unlike many regional blocs, BRICS integrates with Africa's prominent economy of South Africa. In this context, South Africa has a distinct and influential position in relation to the economies of the African continent. South Africa is a dual member of the Southern African Customs Union (SACU) and of a sixteen-country economic bloc, SADC, among other influential African organisations. Furthermore, in Africa, South Africa's JSE (founded in 1887) is the largest and the second oldest after Egypt's Stock Exchange (established in 1883). Given this background, it is probably not surprising that the literature ( Agyei-Ampomah, 2011 ; Boamah, 2016 ) observes that African economies are segmented, with the exception of South Africa. Due to their geographic proximity and shared socioeconomic characteristics, studies on traditional blocs may be constrained to trace the unexplained variations in co-membership trade behaviour. Therefore, unconventional case studies such as BRICS should provide a different perspective from the data.
2.2 International trade, economic integration and stock market linkages
Economists have long known the benefits of international trade. The James Steuart Mercantilism theory (Steuart, 1767 ) was a protectionist economic system that favoured trade surplus, in contrast with the free trade emphasis of Adam Smith's proposition of an absolute advantage (Smith, 1776 ), in which a country was expected to maximise trade benefits by specialising in a product it is good at. Later, David Ricardo suggested a modification of the comparative advantage (Ricardo, 1817 ). Followed by the Swedish economists Eli Heckscher and Bertil Ohlin, who recommended the Factor Proportions theory (Ohlin, 1933 ), which contends that a country should be better off by producing and exporting products in which it has an abundance of production factors. The above theoretical paths show that the trade theory continues to evolve, but with a common question: How can a country maximise its benefits from international trade? The principle of regional economic integration has much value-add in this regard ( Balassa, 2012 ) and much more than just decreasing tariff barriers. Different variations of regional economic integration include free trade areas, customs unions, common markets, economic unions, monetary unions and fiscal unions, inter alia. The benefits of REI manifest in a feedback recurrence at the industry level through favourable product prices and macroeconomic growth paths.
2.3 Hypothesis development
H1. The hypothesis says that there exists an association between economic integration and stock market linkages within BRICS.
The economic theory shows that international trade has an impact on domestic economies via knock-on effects that cascade from the firm level to the stock market. One of the objectives of capital budgeting theory in corporate finance is to determine the value of a firm using a stream of future cash flows, such as Gordon's growth model (Gordon, 1959 ; Gordon and Shapiro, 1956). Specific case studies of stock market correlations with economic variables at the firm level (like, Huy et al., 2020 ) do not address the same problem as the literature stream of financial market integration but are informative. In the stock price valuation, the Gordon model measures the value of a firm by examining the expected dividends payable by a stock-exchange listed company. The link between economic integration and the stock market is elaborated further in Soydemir (2000 ) and Asgharian et al. (2013) on how bilateral trade encourages synchronisation in business and its consequent impact on stock markets.
H2. The hypothesis says that there is stock market integration between South Africa and BRICS.
The empirical design of the current study is to evaluate stock market integration within BRICS from the perspective of the South African trade relationship. In line with the economic theory discussed above, it is intuitive to expect an economic knock-on effect among bilateral trade, the aggregate economy and stock market activity. Consistent with prior works ( Forbes and Chinn, 2004 ; Paramati et al., 2016; Song et al., 2021), the current study accepts bilateral trade as a proxy for economic integration. While the economic rationale provides the foundation for the link between REI and the stock market, the actual nature or behaviour of this relationship is subject to empirical examination.
Method
Similar to Paramati et al. (2016) and Song et al. (2021), the study uses a two-stage econometric procedure. First, we use a multivariate BEKK-MGARCH model to estimate interlinked time-varying correlations between the South African stock market and each of the four BRIC countries, concurrently. From this, we save four sets of correlation series. In the second stage, the retrieved correlation time series is employed as a response variable in the next modelling stage. In the second stage, the panel data model is used to determine the effect of REI on stock market linkages. The benefit of using the BEKK-MGARCH system to compute dynamic correlations is to capture the potential spillovers in the BRICS-wide stock markets, which is valuable in measuring the extent of linkage. Mishra et al. (2022 ) employ the same model in a related application.
3.1 BEKK-MGARCH model
The first of the two econometric models to be estimated is the BEKK-MGARCH ( Engle and Kroner, 1995 ). In this study, our preference is the BEKK over the DCC version of the MGARCH model, even though the two models are assumed to be equally competent at lower dimensions. Nevertheless, some researchers insist that there are unanswered questions regarding the asymptotic theory of the DCC model. For instance, after reviewing the relevant literature, Caporin and McAleer (2012 , p. 746) concluded that “… the proofs of consistency and asymptotic normality for DCC have typically been based on unstated regularity conditions. When the regularity conditions have been stated, they are untestable or irrelevant for the stated purposes”. We proceed with system (1) of vector-autoregressive, VAR(p) and BEKK-MGARCH (p, q) models in Equations (1a) and (1b)
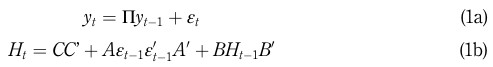
In theVAR(p)system(1a),yt isak31vectorofstockreturnsfromthestockmarketindicesof BRICS, while Π is a k3kmatrix of parameters to be estimated. In Equation (1b),Cisk3k lower triangular matrix, while A and B are k3k coefficient matrices to be computed. The disturbance term is assumed to be εt ∼ N(0;Σt), where Σt is the covariance matrix.
3.2 Panel data model
The second and main econometric procedure of the study employs the panel data model, as presented in Equation (2). The objective of this model is to examine the core empirical question of whether REI has an impact on stock market linkages.
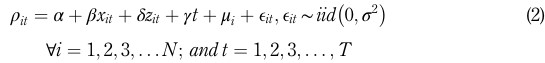
The dimensions of the panel data model, N and T, are four (BRIC countries) and 300 (months), respectively. The definition of variables is as follows: p is the response variable of dynamic correlations between South Africa and each of the BRIC countries. That is, country i at time t. The vector, z, contains variables that proxy for REI of which trade intensity (trade) is key. The covariate trade is generally assumed to have a positive effect on stock market integration ( Bracker et al., 1999 ; Paramati et al., 2016 ) due to possible national economic interaction and firm-level beneficiation. The variable trade is quantified in Equation (3) as:
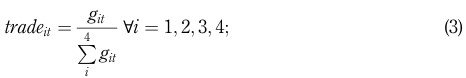
where git is South Africa's total trade (imports plus exports) from BRIC country i at time t. This means that the denominator in Equation (3) represents South Africa's aggregate trade with the four BRIC countries. The other two variables are: a dummy variable, BRICSexist, which takes the value of zero before BRICS’ existence and one otherwise, while the second variable, BRICSexp, captures the accumulation of BRICS experience measured as weighted age (or duration) of BRICS in years. The variable is also applied as an interaction of itself (squared). We use the weighting to capture the idea of relative influence in the South African-BRIC bilateral relationships. For this we conjecture that the ratio of each country's distance (dit) from South Africa divided by the average distance of BRIC
away from South Africa should be appropriate and quantified in Equation (4) as:

Distance on its own is known to negatively impact market integration owing to cost implications ( Hooy and Goh, 2008 ). Therefore, this weighting has a moderating effect on the proxy for BRIC integration experience (BRICSexp). Considered together, the two variables, BRICSexp and its square, should answer the question of how the continued existence (or experience accumulation) of BRICS affects their stock market integration. In Equation (2),
is a set of control variables, namely, interest rate differential, volatility index (VIX) and geopolitical risk, which are summarised in Table A1 (in Appendix). The variable, interest rate differential (rate), is a common inclusion in market integration studies. It measures interest rate parity between markets with a potential impact on capital flow and should influence a firm's profitability leading to positive effects on stock markets' co-movements ( Bracker et al., 1999), assuming capital mobility and other things are constant.
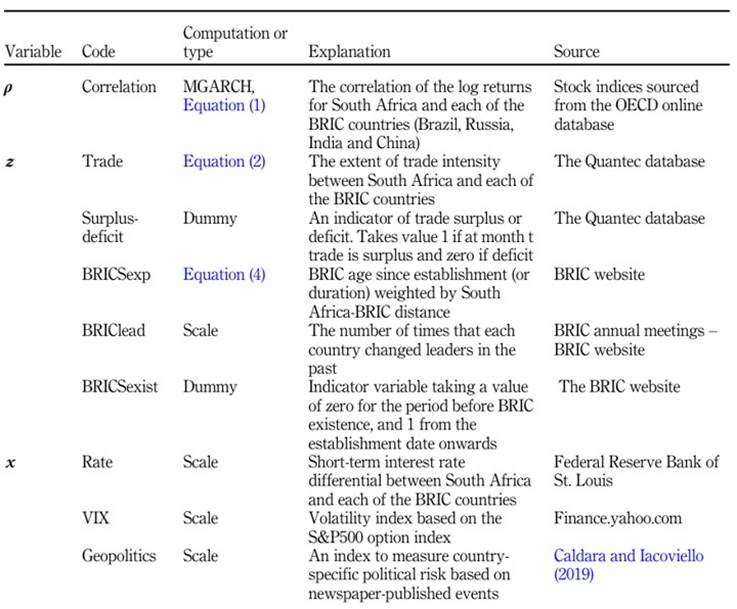
Dedicated studies on risk integration in global stock markets ( Marfatia, 2017 ) and BRICS-specific works ( Mroua and Trabelsi, 2020 ; Yildirim et al., 2022 ) have shown that risk spillover prevails in both short and long frequencies. In financial markets, VIX is a well-known measure of market risk based on the S&P500 option index and it gauges financial uncertainty, fear and/or stress. History has shown that “… emerging stock markets have become less segmented from world stock markets” ( De Jong and De Roon, 2005 , p. 583). In this regard, we use VIX as an attribute of global financial market risk and the literature ( Carrieri et al., 2007 ) shows that the direction of the effect is not pre-defined.
The regressor geopolitics is included to control for uncertainties emanating from changes in geographic political environments. This measure of political risk is a practical index that tracks the country political climate over time, based on newspaper reports ( Caldara and Iacoviello, 2019 ). Higher and extreme sentiments of domestic political risk should have a lower contribution to stock market co-movement. Therefore, a negative association is expected. The coefficients, α, β, δ, γ are model parameters to be estimated. The terms, γt and μi are period and panel-fixed effects, respectively.
3.3 Data description
The BRICS stock market indices used in the current study are Brazil's Bolsa de Valores de São Paulo (BOVESPA), Russian Trading System (RTS), National Stock Exchange of India (NSE), China's Shanghai Stock Exchange (SSE Composite) and the JSE's All Share Index. The time horizon for the sample range was restricted by the shortest time series available, namely Russia's Stock Market Index, which is only obtainable from 1995. Therefore, the datasets used in MGARCH and panel data models are monthly time series for the period October 1995 to September 2020 from several sources, which are summarised in Table A1 (in Appendix).
Prior to estimating the econometric models of the study (Equations 1 and 2), it is important to preview the summary descriptive statistics of the regression time series. Therefore, it is useful to observe whether there is a preliminary discernible co-movement between the South African stock market and those of the BRIC countries. Figure 1 shows a historical graph of stock market price indices for South Africa against each of its BRICS counterparts. Overall, there is prima facie evidence of stock market correlation within BRICS. Also, apart from the gradual upward trend, the graphed series reflects a common response to significant structural changes such as the global financial crisis (2008-2009), European financial crisis (2012-2015) as well as COVID-19 (2019-2020).
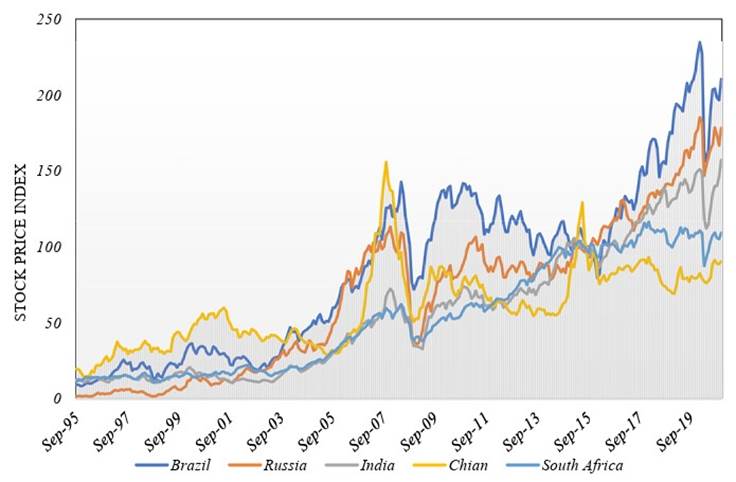
Figure 2 shows the impulse response function for the South African stock market (All Share Index) in relation to the aggregate stock market of BRIC countries (MSCI BRIC Index). The latter is published by Morgan Stanley Capital International (MSCI), and the index has 85% capitalisation of free-floating constituents in each country. The two graphs in Figure 2 show that there is a two-way shock response between South Africa and BRIC. Although the two graphs are not able to reveal the origin of the shocks, the information is suggestive enough that there is a bi-directional effect between the markets. However, it is interesting to observe from these graphs that shocks trigger market reactions in opposite directions. The response of the South African market is positive, while that of the BRIC is negative. In all cases, the full effect is maximised on the fifth month after the shock. Figures A1 and Figures A2 (in Appendix) detail South African and BRIC response functions at country levels. In all cases, there is a bi-directional shock effect.
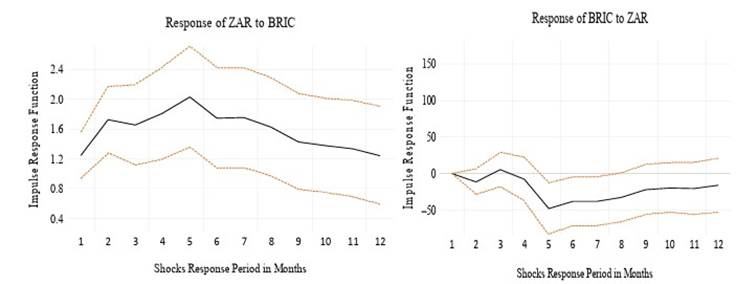
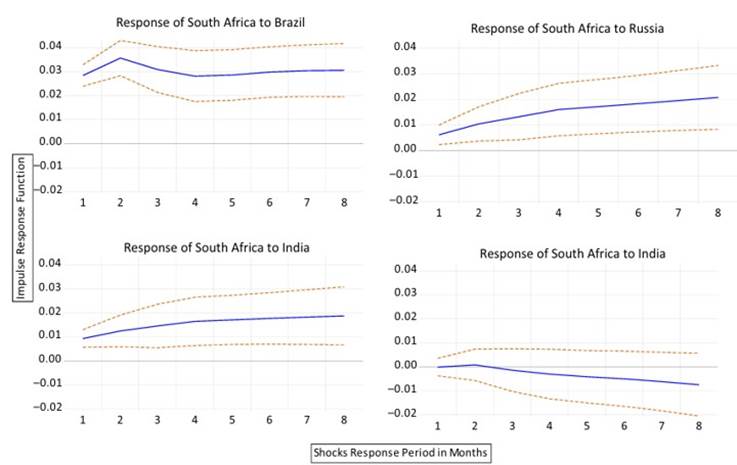
Figure A1. Shock responses of South Africa to one standard deviation innovations from individual BRIC countries
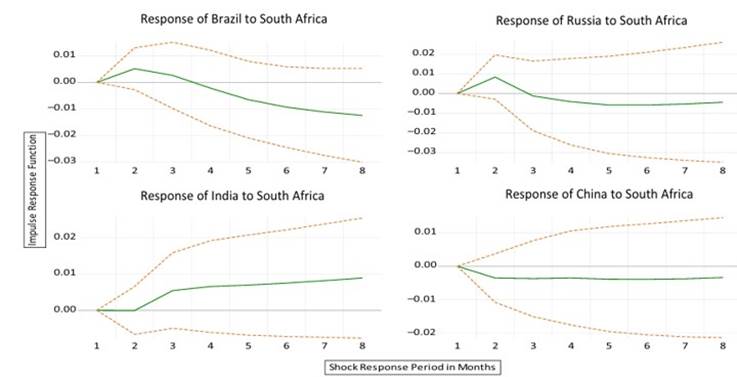
Figure A2. Shock responses of individual BRIC countries to one standard deviation innovations from South Africa
3.4 Pre-modelling and data-validation tests
In this study, panel data unit root tests are used to confirm whether the time series is stationary, which will help avoid spurious and misleading regression results. There are several alternative test procedures that researchers may apply to assess stationarity. To select an appropriate panel unit root test, we consider what different test procedures say about four factors of the econometric theory: whether we have balanced panels, the relative magnitudes of N and T, the speed at which N and T approach infinity as well as the extent to which N and T are fixed. The asymptotic conditions of available test procedures include (T →∞;N finite) f gba sed on thetest suggested by Choi(2001 ),or (T,N →seq∞) by Breitung(2000 ),Breitung and Das(2005)and Hadri (2000 ) or (√N/T →0;orN=T →0g) by Levin et al. (2002), or (N →∞;T fixed) by Harris and Tzavalis (1999 ) and Im et al.(2003 ). Thenatureofourdatasetiscloser to thefirsttwo tests. The reason is that the size of the panel in our study is a fixed N of four BRIC countries, while T, the study horizon, is readily extendable considerably faster than BRIC membership. The relevant unit root test equation is given in Equation (5):
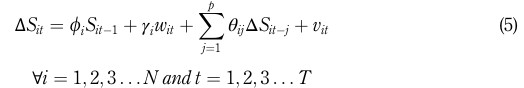
In Equation(5), Sit is the series to be tested, ΔSit j captures aset ofaugmentedlags,whilevit is the regression error term which is assumed to be stationary. The variable, wit, represents the panelmeanstime-trend, and it takes the value of zero if none is included in the regression. The null hypothesis of the unit root test is H0 : fi = 0for alliagainst the alternative, H1 < 0:The test results of stationarity are presented in Table A2 (in Appendix) and explained next.
Table A2 Stationarity model validation tests, H0: panels contain unit roots
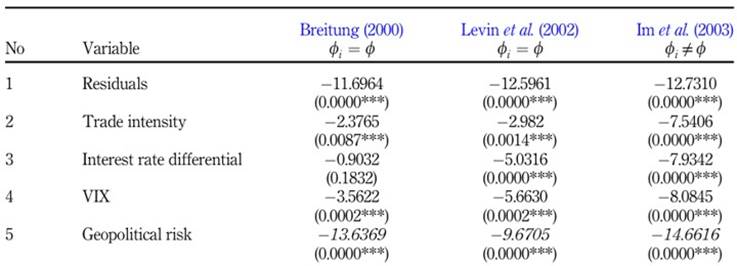
Note(s): ***1%, statistical significance. Equation (5) refers: ϕi = ϕ means that a common autoregressive coefficient for all panels is assumed while ϕi ≠ ϕ means panel-specific autoregressive coefficients are assumed
Source(s): Author's computations
3.5 Panel data model validation
Prior to results' interpretation, it is important to address the model validation necessities. In this regard, a battery of tests is applied to confirm the model selection (among, pool vs fixed effects, fixed vs random effects and time effects), as well as to validate post-estimation model assumptions, which entails tests on heteroscedasticity, autocorrelation and cross-sectional dependence.
Fixed vs random effects: The Hausman test (Hausman, 1978 ) is employed to choose the appropriate model between fixed- and random effect models. The null hypothesis (H0) of the test is that the random effect model is preferred. The test output in Table A3 (row 2) confirms a rejection of (H0) at less than 1% level of significance in favour of the fixed effects model.
Period effects: The purpose of this test is to verify whether the time-fixed effects should be included in the chosen fixed effect model. This test uses the F-statistical test. The null hypothesis is that all time effects are not relevant. The test results in Table A3 (row 3) reject (H0) leading to the conclusion that period effects are necessary in the panel data model.
Table A3 Post-estimation model validation tests
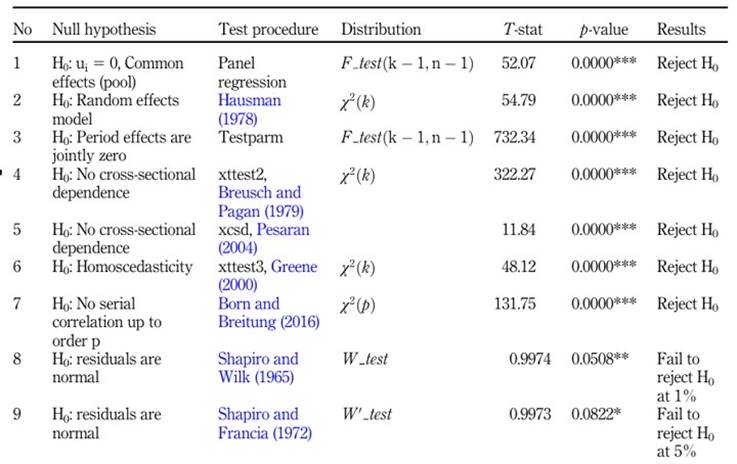
Note(s): *** 1%, ** 5% and *10%
Source(s): Author's computations
Cross-sectional dependence: Countries within a formalised regional economic bloc are expected to have some form of interdependence in the real world. Two tests by Breusch and Pagan (1979 ) and Persaran (2004) are used to examine whether there is cross-sectional dependence among the panels (the BRIC countries). The null hypothesis for both tests says that there is no cross-sectional dependence. Based on the test results in Table A3 (rows 4 and 5), we reject (H0) under both tests and conclude that the cross-sectional dependence is prevalent in this panel data model.
Heteroscedasticity: A test of heteroscedasticity is well explained in mainstream econometrics textbooks (like Greene, 2000 ), and it is applied to inspect the assumption of homoscedasticity indicated in iid∼ (0;σ2). The null hypothesis says that the assumption of homoscedasticity is not violated. According to the test results in Table A3 (row 6), we reject H0 and conclude that heteroscedasticity is present in the panel data model.
Autocorrelation test: To assess whether the econometric assumption of serial correlation is satisfied, we use the test designed by Born and Breitung (2016 ). The null hypothesis of the test is that there is no serial correlation in the panel regression model. In the light of test results in Table A3 (row 7), we reject (H0) and conclude that the assumption of no autocorrelation is violated.
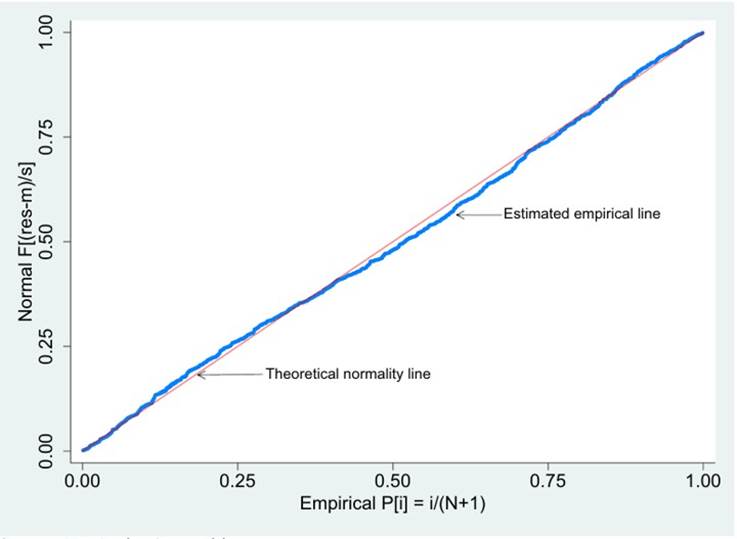
Residual normality: To investigate whether the model assumption of residual normality is sustained, we apply two tests ( Shapiro and Wilk, 1965 ; Shapiro and Francia, 1972). The null hypothesis in both cases is that residuals are normal. Based on tests results reported in Table A3 (rows 8 and 9), we fail to reject (H0) in both tests at 1 and 5%, respectively. This means that the model residuals are fairly normal, and this fact is confirmed by the graphical illustration in Figures A3, and Figure A4 (in Appendix).
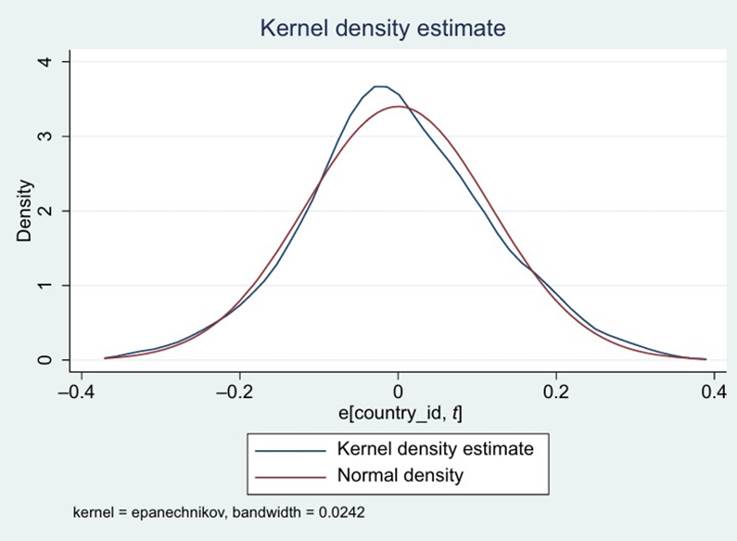
The overall finding of the post-estimation validation is that normality treatment is not indicated, whereas the same panel data model is afflicted with problems of heteroscedasticity, serial correlation and cross-sectional dependence. To address these issues collectively, we apply the Driscoll and Kraay (1998 ) robust standard errors using the xtscc program by Hoechle (2007 , p. 282), who confirms that the Driscoll-Kraay “covariance matrix estimator … produces heteroskedasticity- and autocorrelation-consistent standard errors that are robust to general forms of spatial and temporal dependence”. Therefore, Table 1 presents the original OLS results in Model 1, while Model 2 is estimated with the Driscoll-Kraay robust standard errors. The choice of the Driscoll-Kraay robust model over alternatives is based on two factors. First, the conventional solutions include Newey and West (1994 ) and cluster ( Rogers, 1994 ) robust errors. While these traditional robust methods provide a successful control for both heteroscedasticity and autocorrelation simultaneously, they fall short in addressing the cross-sectional dependence problem, necessitating using the Driscoll-Kraay method to solve all problems. Secondly, in the current study, the number of panels is very limited (only four BRIC countries), making the choice of Rogers' cluster robust errors less effective. After using the Driscoll-Kraay robust standard errors, the results are indeed robust because the variables maintain their statistical significance.
Table 1 Main empirical results-panel data model
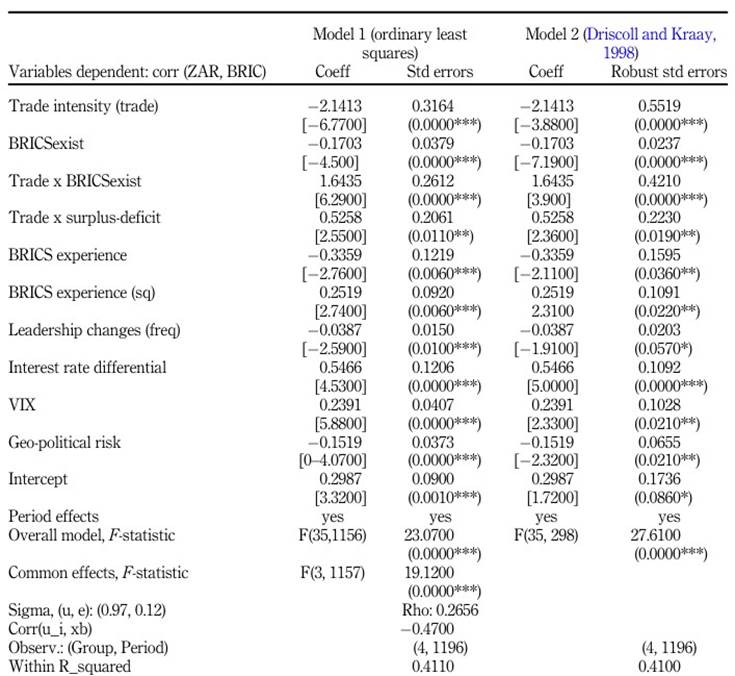
Note(s): The legend for statistical significance is: *** 1%, **5% and *10%, respectively. Under the column for coefficients, the numbers without brackets are coefficients. The numbers right below the coefficients in square brackets are test statistics. Under the column labelled std errors, the numbers without brackets are standard errors. The numbers below standard errors in round brackets are p values
Source(s): Authors' computations
Results
4.1 Stock market correlation between South Africa and BRIC
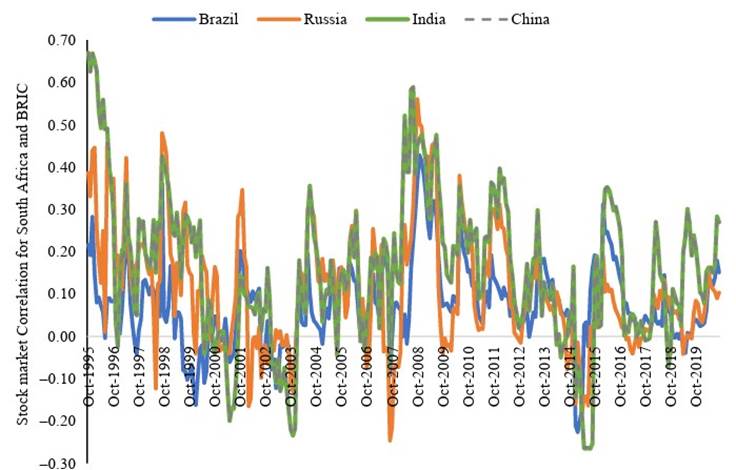
The MGARCH model in Equation (1) was used to generate dynamic correlation time series graphed in Figure 3 . A visual inspection of the graphs shows that in the period prior to BRIC establishment (June 2006), the stock market correlation between South Africa and the BRIC countries had a steady downward trend. This period of steady correlation decline was concurrent with the Asian financial crisis (from middle to late 1990s) and dot.com technology shocks (in the early 2000s). The correlation of all the country pairs of South Africa and individual BRIC countries experienced a significant upward spike during the global financial crisis of 2008-2009, which was later followed by a steep decline (2010-2015). Overall, the correlation time series appears to oscillate between zero and 40%, with a few occasions of pronounced negative deepening such as in the early 2000s and around the period of the European crisis (middle of the 2010 decade). Therefore, a general observation suggests that the dynamic correlation between South Africa and BRIC is susceptible to significant financial crises, but the corresponding shock responses vary unpredictably per different episodes of crises.
4.2 Panel data results interpretation
The panel data model was employed in this study to investigate the relationship between BRIC regional economic integration proxied with bilateral trade and stock market linkages quantified as dynamic correlation of South Africa against individual BRIC countries. The results are presented in Table 1 and Figure 4 . The results of the panel data model, presented in Table 1, provide answers to and evidence on whether BRIC economic integration has an impact on their stock market integration. Stock market integration (dependent variable) is measured as a dynamic correlation of stock market indices between South Africa and each of the BRIC countries. Economic integration is proxied primarily with trade intensity (trade). The regression output shows a strong negative coefficient for trade, which is statistically significant at less than 1% level. At first sight, the result looks counterintuitive since basic economic reasoning hints at a positive association between trade activity and stock market due to economic rationale. Also, the dummy variable (BRICSexist) of “before and after” BRIC establishment is negative, suggesting that economic integration encourages stock market segmentation. However, a comprehensive inspection of all proxy variables for economic integration reveals the opposite, and this is in line with expected economic intuition. First, the frequency of leadership changes along with the interaction term of trade with each of BRICSexist as well as an indicator of trade surplus or deficit (surplus-deficit), says that bilateral trade surplus (as opposed to deficit) after BRIC establishment has a positive impact on stock market co-movement. Second, a positive coefficient on the proxy for BRIC experience and a negative coefficient on its square provide further clarity. Prior to BRICS’ existence and its early years of integration, trade from BRIC countries was related to equity market segmentation, but this changed to a positive association with market integration after three years of BRICS’ existence.
The rest of the variables in Table 1 control for other factors regarding the stock market fundamentals and show both statistical and economic significance. The increase in the interest rate differential may signal positive investment opportunities, which are captured by a positive effect that signals stock market integration. A positive coefficient of financial market risk (VIX) may indicate that the individual BRICS stock markets have a similar shock response to global risk. The negative coefficient for geopolitical risk may reflect incompatibilities in socio-political and cultural differences among the BRICS countries which support stock market segmentation. The literature ( Hooy and Goh, 2008 ) indicates that market segmentation may also arise because of institutional inefficiencies and differences.
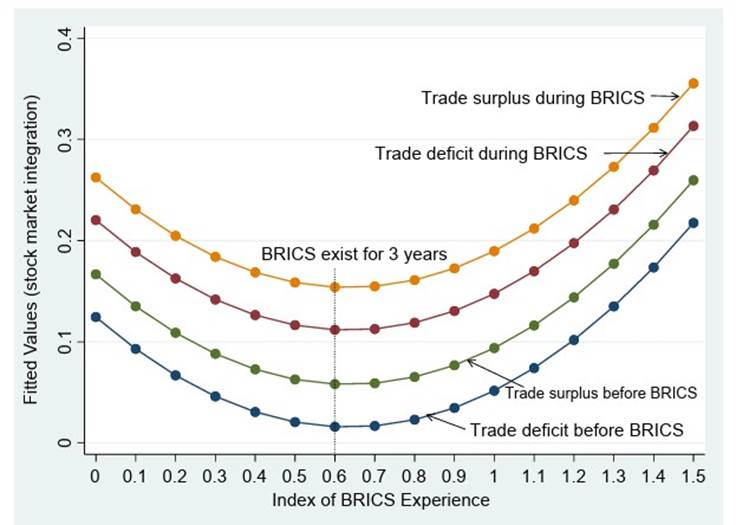
Graphical results interpretation: Figure 4 provides further clarity on the relationship between bilateral trade intensity and stock market integration. The graph presents the predictive margins of South Africa-BRIC bilateral trade on stock market integration. On the x-axis we have an index of BRICS experience (BRICSexp) proxied with log of distance-weighted BRIC age (see Equation 4), while on the vertical axis we capture the predicted values of BRIC integration as measured by dynamic stock market correlation. The minimum turning point of BRICSexp corresponds to three years of BRICS’ existence. Each of the four lines is a measure of the u-shaped BRICS experience. Comparing the bottom pair of lines (before BRICS’ existence) with the top pair (after BRICS), the graph shows that the effect of surplus bilateral trade intensity on stock market integration always exceeds deficit and that the overall impact is highest after BRICS’ existence and slops upwards after three years of entrenchment. Therefore, taken together, Table 1 and Figure 4 show that surplus bilateral trade between South Africa and BRIC manifests a positive association with BRICS’ economic integration and that this relationship will continue to strengthen as the years of BRICS’ existence increase, other things being constant. To summarise, the results provide an overall support and confirmation for the study hypothesis.
Discussion
Other things being equal, “… capital should automatically flow from capital-abundant to capital-scarce countries” thereby encouraging market integration. On the contrary, “Asia's considerable net savings tend to flow to capital-abundant countries rather than to capital-scarce ones as the theory would predict” ( Park, 2013 , p. 1). This narration confirms that in practice, market integration is more an empirical question than a solely economic theory, which calls for diverse testing before styled facts may be deduced.
The current study is closest to that of Paramati et al.( 2016) and Song et al.(2021). These two papers studied market integration in Asia, focusing on the same countries (Australia, China, India, Japan and Thailand). Paramati et al. (2016) investigated market integration in Australia-Asia bilateral trade, while Song et al.(2021) focused on China-Asia bilateral trade. In the current study, we adopt the same framework and investigate market integration in the BRICS economic bloc from the perspective of South Africa and BRIC bilateral trade. While there is significant variation in the methodological procedures and proxy variables of economic integration, overall, the results concur. Other supportive studies that confirm a positive relationship between REI and stock market integration include those of Fazio, 2007 ) and Karim and Majid (2010 ). The current study provides a different perspective from the BRICS studies that found partial stock market integration ( Chittedi, 2010 ) or insignificant stock market inter-linkages ( Sharma et al., 2013 ). More importantly, the current study prompts an interesting further study in the sense that if South Africa manifests trade-linked stock market integration with BRICS, how much of this integration is conveyed (or spills over) to other African regional blocs with which South Africa is observed to be integrated ( Ekpo and Chuku, 2017 ; Piesse and Hearn, 2002 ), such as SACU or SADC economic regions.
5.1 Theoretical implications
The BRICS economic bloc is over 10 years old, and it is now due for performance scrutiny. Chatterjee and Naka (2022 , p. 3) have examined BRICS's life from commencement to date and concluded that “Academic scholarship on the implications of BRICS as an entity - the power of its pooling together of economic resources or its political valence as a discursive formation - is relatively underdeveloped.” The outcome of the current research contributes to the needed performance diagnosis of the BRICS configuration. Going forward, the positive results of the trade-inspired financial integration are subject to the extent to which the BRICS member countries respond to economic crises and whether the group cohesion is deepened and sustained.
5.2 Policy and business implications
The research outcomes of the current study have policy and practical implications with respect to government economic administrators, regulation agencies, multinational firms, export financiers, global investors as well as stock market institutional practitioners. Conceivably, the economic policymakers who are involved in international trade promotion need to be aware of the feedback effect emanating from the stock market regulatory process due to the association between financial market integration and economic integration. Multinational firms and the international export financing agencies should benefit from knowing the potential effect of trade liberalisation policy on stock market performance, which should influence the timing of their financing plans. Global investors need to have wide knowledge of stock market drivers (including economic integration). Therefore, this type of research caution analysts that if their global risk modelling excludes the economic integration issues, then such price determination models may be incomplete.
5.3 Limitations and future research agenda
Even though the results of the study are insightful, the empirical work was restricted by data availability. Therefore, a similar study could be extended to other regional economic blocs where data access is more generous. The emergence of unique economic blocs like the BRICS, the ongoing economic transformations and the economic disruptors of technological progress continue to make the subject of economic integration and financial market integration topical and essential research. Further studies may probe the association from the perspective of each BRICS country and to identify the source and destination of the dominant impacts.
Conclusion
This study has shown that prior to the BRICS’ existence and including its early years of installation (prior to three years), there were signs of market segmentation when observed from the perspective of South African bilateral trade with BRIC countries. However, this changed three years after the inception of the BRICS economic bloc (indicative of experience accumulation and/or entrenchment), when the results show unambiguous evidence of market integration, particularly during the surplus bilateral trade episodes. The findings of the study allow us to conclude that there is a positive association between regional economic integration and dynamic stock market linkages. Overall, the results of a study of this nature are beneficial to policymakers and global financial investors, where diversification considerations are essential.

