


 English (pdf)
 Article in xml format
 Article references
 Send this article by e-mail
 Cited by SciELO
  Similars in
SciELO
Similars in
SciELO 
 Permalink
Introduction
Traditional finance theories were established using the classical microeconomic approach, according to Oliveira and Krauter (2015). Based on the premise of man as a rational being (Homo economicus), who is risk-averse and aims to maximise the expected utility of each decision, several innovations were observed in the field of finance, such as the efficient-market hypothesis (EMH), proposed by Fama (1970) and the capital asset pricing model (CAPM), developed by Sharpe (1964) and Lintner (1965). However, according to Halfeld and Torres (2001), as of the early 1990s, criticism of modern finance theories intensified, especially regarding the rationality of agents, due to more frequent findings of anomalies in financial markets which are not predicted by the theory.
In this context, a new behavioural finance theory was established and has gained strength and support, as Castro Junior and Famá (2002) reported. Bouteska and Regaieg (2020) argued that the behavioural finance paradigm began to emerge after anomalies in the financial market were identified and analysed. The stock market has many pieces of information, making rational decisions difficult because of emotional biases ( Isidore and Christie, 2019 ). Anomalies challenge market efficiency, allowing investors to earn abnormal returns using patterns and strategies ( Lobão, 2019 ).
The study of Kahneman and Tversky (1979), which questions the idea of expected utility maximisation in agents' decisions since it does not incorporate elements of human nature that may result in wrong decisions, was one of the precursors of this new theory. Shiller (2002) highlighted the scope of behavioural finance, which involves the fields of social sciences, sociology, psychology and finance.
One of the possible cognitive errors in decision-making and a target of studies in behavioural finance is the decoy effect. According to Bateman et al. (2008), the decoy effect can also be called the attraction effect or asymmetric dominance effect and is characterised by when an agent's preference between two alternatives is changed by the availability of a third alternative with similar characteristics to the other two but with less attraction. This last item, which has a lower value, is placed as an option to increase the acceptability of the prospective buyer for one of the alternatives offered and not to be an attractive alternative. The decoy effect acts as a method to simplify the decision-making process for prospective buyers.
Being aware of the great influence of the decoy effect in various everyday situations, many studies have sought to further investigate this effect in different audiences and contexts. For example, there are known studies about this effect on consumer product selection ( Doyle et al., 1999 ; Wu et al., 2020 , 2021), candidate selection ( Highhouse, 1996 ), building energy decisions ( Rakitta and Wernery, 2021 ) and games of chance ( Wedell, 1991 ).
The decoy effect of Ariely and Wallsten (1995 ) is usually investigated in consumer purchase decision-making. However, few studies in the academic finance literature have investigated the decoy effect on stock investing. Paris (2012 ) is one of the studies that analysed the decoy effect and investors' stock preferences. Although behavioural finance research has aroused the interest of researchers, Brazil is still little explored in the international literature and the research is not in English. The international literature exploring Brazil uses secondary data and multi-country studies (see Oprean and Tanasescu, 2014 ; Souza et al., 2018; Edmans et al., 2022 ). Silva et al. (2018 ) mapped behavioural finance research in Brazil. Exploring the international literature, we can see that this is the first study in English that analyses the decoy effect in investment decisions in Brazil.
This study aimed to investigate the occurrence of the decoy effect in stock investment decisions based on fundamental analysis. With the number of Brazilians who invest in stocks in the stock market increasing every year —from 570,000 investors in 2016 to 3.2 million in 2020— representing a 461% rise in five years (B3, 2020), this work aimed to contribute in obtaining answers to a central question: does the decoy effect occur in stock investment decisions made by people who know about finance, in particular in fundamental analysis?
To this end, two questionnaire models were applied to 224 students in the last semesters of four undergraduate courses related to the business area at the School of Economics, Business Administration and Accounting at Ribeirão Preto (FEA-RP) of the University of São Paulo (USP). The data analysis was performed using Fisher's exact test, Student's t-test and the ANOVA to detect the decoy effect's occurrence in simulated investment decisions. In addition, the analysis also included checking for a potential association between the variables gender, age, degree and professional experience with the occurrence of the decoy effect.
This study seeks to contribute in two ways: first, by examining the decoy effect in stock market investment decisions. Few studies have investigated the decoy effect in the financial area. Literature investigates the decoy effect in purchase decisions. Second, the study is applied in Brazil, a country that has been little explored in the international literature. The academic literature is traditional in developed countries. Studies in emerging markets and Latin America are still limited.
The paper is organised as follows: Section 2 reviews the literature, Section 3 describes the data and presents the methodology used in the study. The empirical results are discussed in Section 4 and Section 5 provides the conclusions.
2. Literature review
Homo economicus has had varied interpretations throughout history. While its origin is unclear, it is credited to John Stuart Mill, who created a model for studying economic phenomena. This model has evolved, with traditional economic studies adopting a marginalist version to focus on individuals' financial behaviours. This approach excludes psychological assumptions incompatible with empirical science ( Souza, 2017 ; O'Boyle, 2007 ; Morgan, 2006 ).
Most economic theories portray agents as rational, making optimal decisions based on available information, owing to the popularity of the Homo economicus concept. Nonetheless, this is an idealised concept, as per Zabieglik (2002 ). An example of such a theory is the efficient-market hypothesis (EMH), first conceived in the 19th century and progressively studied in the 20th century concerning share prices in capital markets, according to Forti et al. (2009 ). This theory gained solid mathematical support in the 1960s, with Eugene Fama's work (see Fama (1970 ) becoming the foundation of modern financial theory ( Camargos and Barbosa, 2003 ).
According to the EMH proposed by Fama (1970), efficient markets incorporate all public information, making it impossible to achieve systematic advantages. Price changes follow a random walk and even irrational investors cannot affect prices, given the large number of participants. Nevertheless, studies since the 1970s have found market inefficiencies during economic crises, indicating investors' irrational behaviour (Fox, 2009). Damodaran (2002 ) argues that markets can be efficient or inefficient during particular periods, with inefficiencies that appear briefly and disappear quickly as some investors recognise and benefit from them, allowing a self-correcting mechanism in the market.
Shefrin (2002 ) suggests that financial anomalies arise from the limitations of human nature, as investors do not always behave rationally, as predicted by the efficient markets theory. Schwert et al. (2003 ) argued that financial anomalies result from asset prices not aligned with rational pricing expectations, thus enabling investors to obtain abnormal gains. Flaws in the rational process may occur due to psychological factors, as individuals consider previous experiences and tend to be loss-averse, as noted in Kahneman's seminal research on behavioural finance (see Kahneman and Tversky, 1979 ). This new finance branch investigates how emotions and cognitive errors affect economic agents' decision-making.
The decoy effect is a cognitive error in decision-making, in which an irrelevant alternative can modify an individual's choice pattern ( Tversky and Simonson, 1993 ). This effect occurs when a third option is presented, which is inferior in some aspects to one of the original alternatives but inferior in all respects to the other. This creates an asymmetric dominance effect, causing individuals to prefer a dominant alternative (Tversky and Simonson, 1993). The decoy effect has been studied in various areas, including games of chance ( Wedell, 1991 ), candidate selection ( Highhouse, 1996 ) and consumer decisions ( Doyle et al., 1999 ), making it useful in marketing (Tversky and Simonson, 1993).
Wedell (1991 ) conducted three experiments investigating the context-induced reversal caused by introducing an asymmetrically dominant choice alternative. The first experiment showed that inserting an asymmetrically dominated option was sufficient to produce preference reversals in 8 out of 192 undergraduate students from the University of Illinois, as analysed with repeated measures ANOVA. In the second experiment, 8 out of 128 undergraduate students from the University of South Carolina and in the third experiment with a sample of 29-34 individuals out of 127 from the same population as the second experiment, there was no additional effect, regardless of the specific context manipulation. Therefore, the ANOVA was used in the second experiment, and the chi-squared test was used in the third experiment.
Highhouse, 1996 ) studied the decoy effect in the context of employee selection using two experiments. The first experiment involved 218 psychology students simulating employee selection, considering decoy effects and phantoms. Logistic regression analysis showed no impact of decoys or phantoms on choice behaviour. The second experiment tested whether forcing the participants to choose the most essential predictor before selecting a candidate would reduce the decoy effect. Again, the logistic regression analysis did not impact the decoy effect, suggesting its robustness to a predetermined pondering manipulation.
Doyle et al. (1999 ) conducted four experiments to understand the ADE (asymmetrically dominated effect) and attraction effects in consumer product contexts. Phantom alternatives such as missing goods and crowded concerts were used. The first two experiments involved 137 and 119 undergraduate business administration and social sciences students, respectively. The results show that contextually relevant real and phantom decoys can change consumer preferences. Experiments 3 and 4 were conducted at a single store. The results of the last two experiments were partially transferred to the real environment.
Silva and Serpa (2012 ) surveyed 386 accounting science students and found that a decoy option incentivised investment in specific companies, altered investment patterns and created a decoy effect. The study concluded that human decision-making is not always based on rational criteria.
Leão and Fajardo (2019 ) studied the decoy effect using a structured questionnaire with 142 business students. The results showed rationality biases in professional choice and minimum service values. The decoy effect experiments remain valid for organisational issues, with similar or superior proposals being more attractive.
According to the recent results of Silva and Serpa (2012 ) and Leão and Fajardo (2019), who realised that incorporating an alternative decoy response changes the results of the reactions, the central hypothesis of this study can be formulated as follows:
H1. The decoy effect is verified. The answers given to the questionnaires (with and without the decoy alternative) were different.
Fukushi et al. (2021) proposed and tested a model to evaluate the decoy effect in a case study of 264 respondents in Santiago (Chile). Age appeared to play a significant role in susceptibility, whereas gender did not show a noticeable impact. The authors considered categories such as income, motorization rate and family size in the analysis.
Considering the results of Fukushi et al. (2021), we formulate the following hypotheses:
H2. The decoy effect is not verified when classifying groups by gender.
H3. The decoy effect is verified when classifying groups according to age.
3. Method
This section describes the main methodological aspects of this study. This research was characterised by an experimental approach inspired by Silva and Serpa (2012) analysis.
3.1 Research design
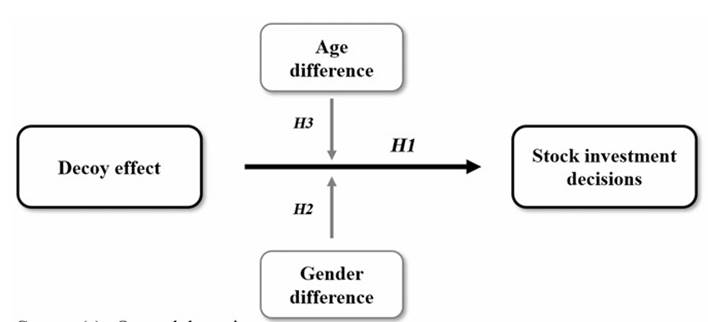
The conceptual model is shown in Figure 1 as a framework. This study analyses the relationship between the decoy effect and investment decisions. Gender and age are considered as possible causes of this relationship.
3.2 Data and methodology
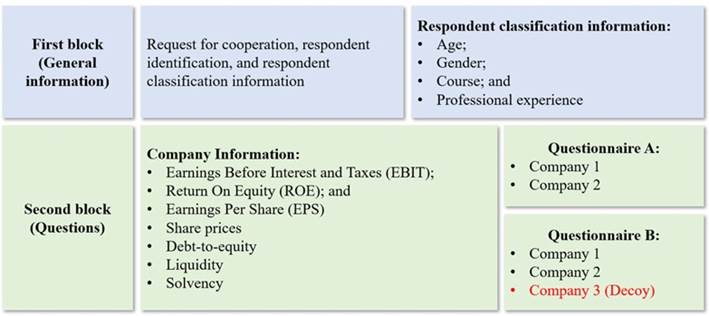
The chosen data collection instrument was a structured questionnaire, following the guidelines of Chagas (2000 ). The questionnaire included requests for cooperation, respondent identification and classification information, instructions and information requested from the respondent. The questionnaire topics are displayed in two blocks. The first block addressed requests for cooperation, respondent identification and classification information. The second block contained instructions and questions.
In the first block, a brief explanation of the research motivations and the definition of the decoy effect are provided. More specifically, the decoy effect occurs with the insertion of an alternative with characteristics like those offered at a lower value or quality. The decoy alternative increases the decision-maker's acceptance of one of the previously provided options. The decoy alternative can even lead decision-makers to make a previously doubtful decision. This is because in certain situations, as in a series of experiments by Ariely (2008 ), people used the decoy alternative as a false basis for comparison.
Furthermore, it was decided not to identify the participants by name to ensure anonymity because this is not essential information for the results to be analysed. Data regarding age, gender, course and professional experience were collected.
The second block initially presented the instructions. These were provided with clear and objective explanations of respondents' attitudes. Afterwards, information about the companies was introduced, and the respondents were asked to choose one of the options. The indicators used to represent investment options were earnings before interest and taxes (EBIT), return on equity (ROE) and earnings per share (EPS). Oliveira et al. (2017) show that the EBIT margin is one of the indicators with the most significant influence on the market value of Brazilian companies. Malta and Camargos (2016 ), on the other hand, show that return on equity (ROE) and earnings per share (EPS) have greater explanatory power for stock return behaviour. Respondents were also provided with information such as the share price on the data collection date, the debt-to-equity ratio, overall liquidity and the company's solvency (solvent or insolvent).
In addition, two questionnaire templates were created to enable an analysis of the decoy effect on investment decisions. They are called Questionnaire A and Questionnaire B. The first model presented only two companies from which the respondent could choose, with very similar values for the selected indicators. Questionnaire B contained three company choices: two from Questionnaire A and a third company to be used as a decoy. The third company was from the same industry as the first but had much lower values for the selected indicators. The strategy was to give the impression that the first company was even more attractive in Questionnaire B by direct comparison with another company in the same industry but with much worse performance, as revealed by the indicators. If the decoy effect works, a greater number of respondents should choose the first company in Questionnaire B than in Questionnaire A. Figure 2 shows a summary of the structure of the questionnaire.
The questionnaires were administered face-to-face, in the classroom, during the students' regular classes and via Google Forms. The respondents were students of the four undergraduate courses offered by the FEA-RP of the USP: (1) business administration, (2) accounting, (3) economics and (4) business economics and controllability (BEC). Only students in the last four semesters answered the questionnaire, as it was considered, based on the course syllabus, that these students had already acquired knowledge about the fundamental analysis of companies in stock investment decisions. The questionnaires were administered from 10/14/2019 to 11/05/2019. Each participant answered only one questionnaire template.
3.3 Analytical procedures
This study analyses the decoy effect by adding an alternative response (decoy) to one of the questionnaires. The idea was to assess whether there was a change in the pattern of responses to the questionnaire with the decoy alternative. We investigated whether a response pattern in Questionnaire A (no alternative) could be changed in Questionnaire B (with a decoy alternative). The analysis involved the following steps:
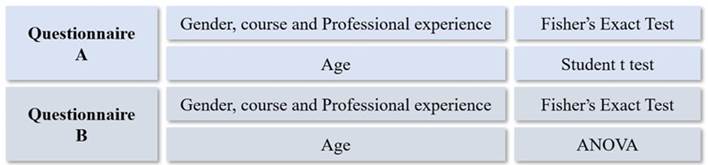
The first step was to analyse the response pattern concerning companies 1 and 2 of Questionnaire A for gender, course and professional experience groups. Fisher's exact test was performed at a significance level of 5%. Fisher's exact test assessed whether row and column variables were independent. For the gender example, we evaluated whether the chosen proportion of Company 1 in the male population is equal to the selected proportion of Company 1 in the female population. Fisher's exact test was also applied in professional experience courses and classes, where p values below 5% indicated a difference between the groups' responses; that is, one company was chosen more than the other.
The second step was to analyse age-class responses. Due to the characteristics of the data, the parametric Student's t-test was used. A significance level of 5% was assumed. A p-value of less than 5% indicates that the average age at which Company 1 was chosen differed from that at which Company 2 was chosen.
In the third step, we analysed the response pattern of Questionnaire B, which contains three companies, one of which is the decoy. Again, Fisher's exact test was used for gender, course and professional experience. The interpretation of the test results was the same as that described in the first stage.
The fourth step was to analyse the age class responses to Questionnaire B. As the questionnaire had three response options, parametric ANOVA was used, assuming a significance level of 5%. A p-value of less than 5% indicated that the mean age differed among the three response options. Figure 3 summarizes the statistics used in the analysis.
4. Results
A total of 224 questionnaires were collected from 520 students in the last semester of the four undergraduate courses. The interviewees' characteristics are listed in Table 1 .
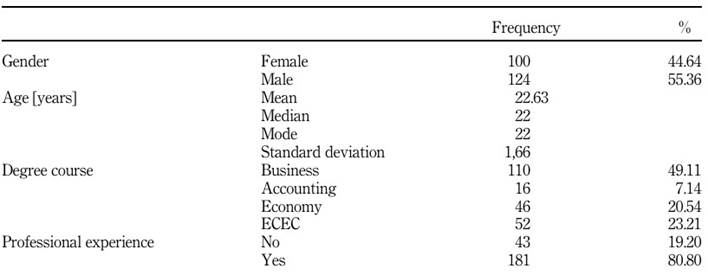
The median and mode indicate that the age of the participants was concentrated around 22 years, while the standard deviation was only 1.66 years old, about the mean of 22.6 years old. This average indicates that the participants were students at the end of their undergraduate programme. Regarding the participants' courses, Administration was the most frequent, with 49.11% responding. On the other hand, accounting, economics and BEC courses represented 7.14%, 20.54% and 23.21% of the total responses, respectively.
The predominance of students in the administration course can be explained by the fact that this course offers more vacancies than the economics and accounting courses at the FEA-RP/USP, with 110 vacancies per year. In contrast, FEA-RP/USP offers only 70 vacancies for business economics and controllership courses and 40 vacancies for accounting and economics courses.
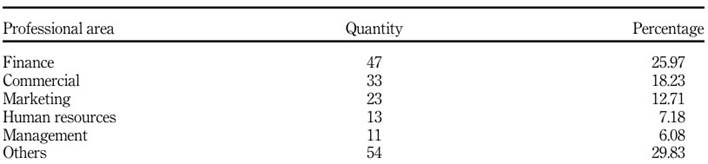
Table 2 presents the data related to the respondents' professional areas. Of those interviewed, 181 had professional experience (80.8%), which aligns with the reality of students in recent years who generally seek to enter the job market to gain experience. The most common professional areas were finance (25.97%), commercial/sales (18.23%), marketing (12.71%), human resources (7.18%), administration (6.08%) and other (29.83%).
After characterising the participants, the statistical associations between the chosen companies and variables were analysed. For the analysis, a significance level of 5% was considered, which meant that only the probability values (p < 0.05) were considered significant.
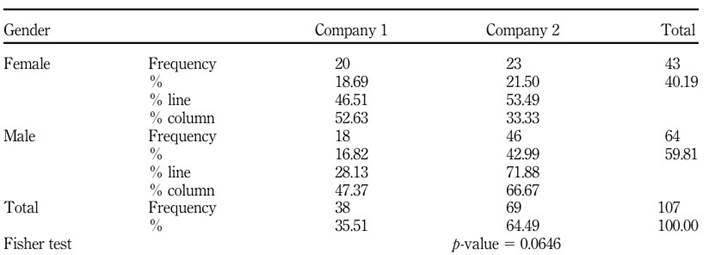
Association analyses were performed with the categories of variables and companies chosen from Questionnaire A. The results of the association between gender and the chosen company are shown in Table 3 .
Table 3 p-value of Fisher’s exact test for the variables gender and chosen company.
Source(s): Authors’own elaboration
According to Table 3 , 43 of the 107 female participants (40.19%) responded to Questionnaire A, while the male participants provided 64 responses (59.81%). Of the responses obtained, 38 people of both sexes chose Company 1 (35.51%), while 69 chose Company 2 (64.49%). Most participants who selected the second company were male; more specifically, 46 of the 69 votes or 66.67%. The p-value obtained was 0.0646, indicating that the relationship between the value distributions of the variables gender and the chosen company is not statistically significant.
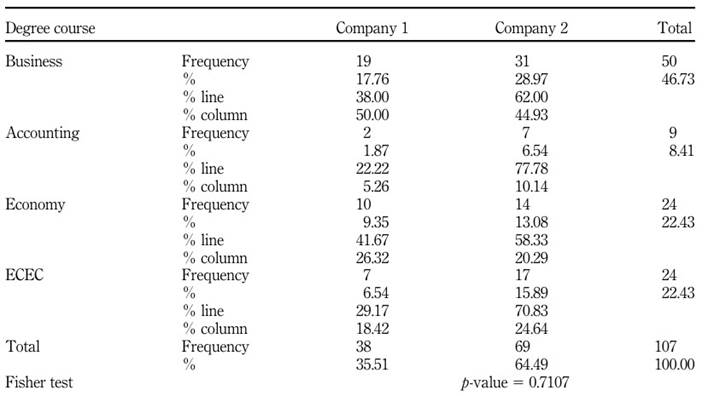
Table 4 presents the statistical association between the course and selected company variables.
Table 4 p-value of Fisher’s exact test for the variables course and chosen company.
Source(s): Authors’own elaboration
The distribution of companies chosen by students from each FEA-RP/USP course in Questionnaire A is presented in Table 4 . The business administration course had the highest number of respondents, totalling 50 of 107 participants (46.73% of the total). Within this group, most students (31) chose Company 2, resulting in a notable difference in the choice between companies, as only 38% of business students chose the first company. The economics course and the BEC had the same number of responses, 24 each (22.43%). The economics course presented a more balanced distribution in the choice between companies, with ten votes for Company 1 and 14 votes for Company 2. The BEC course choices were seven votes for the first company and 17 votes for the second company, corresponding to 70.83% of the total options of this class of participants. On the other hand, the accounting course contributed nine responses, with two votes for Company 1 and seven votes for the second company, presenting a distribution in percentage terms like that of the business administration and BEC courses. With a p-value of 0.7107, it is concluded that there is no statistically significant association between the variables course and selected companies.
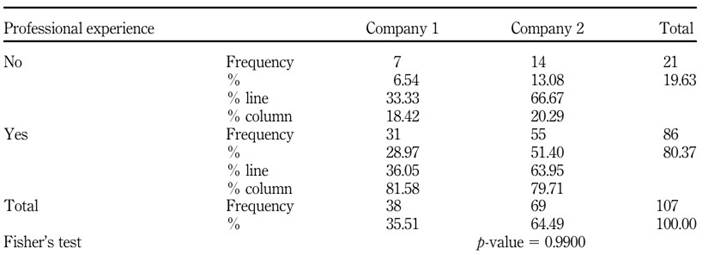
The relationships between professional experience and company choice are presented in Table 5 .
Table 5 p-value of Fisher’s exact test for the variables of professional experience and chosen company
Source(s): Authors’own elaboration
Table 5 presents data on the choice of companies by students for professional experience. Of the 107 participants, 86 (80.37%) had experience in the labour market. Many students seek to enter the market after acquiring basic business knowledge in classes and student societies at the end of their university courses. Most students preferred company 2, both those with and without professional experience. Of the 21 students without experience, 14 (66.67%) chose Company 2, whereas, of the students with experience, 55 (63.95%) chose the same company. Company 1 was chosen by 31 students with experience (36.05%). Fisher's exact test did not detect a statistical association between the variables, with a p-value of 0.9900, above the threshold value of 0.05. In the last analysis of Questionnaire A, the association between age and the chosen company was tested using the Student's t-test; the results are shown in Table 6 .
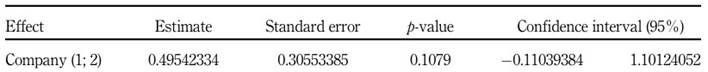
Table 6 presents a statistical test using a different approach. The Student's t-test was used to compare two means from independent samples. The standard error was 0.3055, and the confidence interval ranged from −0.1103 to 1.1012. The p-value obtained was 0.1079, above the significance level required to establish a relationship between the age of the respondents and the chosen companies.
Table 6 p-value of Student’s t test for the variables age and chosen company
Source(s): Authors’own elaboration
The analysis results of the answers obtained from Questionnaire B are reported below. The Fisher's exact test was employed to examine the relationship between the variables gender, course and professional experience and the variable-chosen company. On the other hand, the ANOVA was used to examine the relationship between age and chosen company.
Table 7 displays the data obtained from the relationship between gender and chosen company. As previously mentioned, respondents had to choose one of the three companies in Questionnaire B.
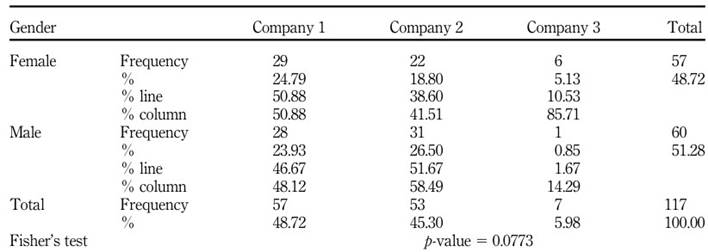
Table 7 p-value of Fisher’s exact test for the variables gender and chosen company
Source(s): Authors’own elaboration
The data in Table 7 indicate that of the 117 respondents who answered Questionnaire B, 57 (48.72%) were women and 60 (51.28%) were men. Company 1 was chosen by 57 people of both sexes (48.72%), while 53 chose Company 2 (45.30%) and seven students (5.98%) chose the third company. This demonstrates a change in the respondents' choice pattern about questionnaire A, in which Company 1 represented 35.51% of the votes. However, the p-value of 0.0773 indicates that the relationship between the variables gender and chosen company is not statistically significant since it is above the 5% significance level. Table 8 presents the analysis results of the relationship between the course and selected company variables.
The data in Table 8 show that the business administration course had the highest number of respondents, contributing 60 out of 117 votes (51.28%). Of this total, 27 students (45%) chose Company 1 and the same number of votes for Company 2. However, it is worth noting that the number of votes for the first company in Questionnaire A was 38%, indicating a possible influence of the decoy company. After that, the BEC course received the most answers, with 28 (23.93%). The economics course came right after, with 22 answers (18.80%). Finally, the accounting course students provided seven answers (5.98%). In all the other courses, the distribution of responses was also altered in favour of Company 1, just as observed with the business administration students. However, the p-value was 0.3544, which is insufficient to consider a significant change in the distribution of answers between the variables course and chosen.
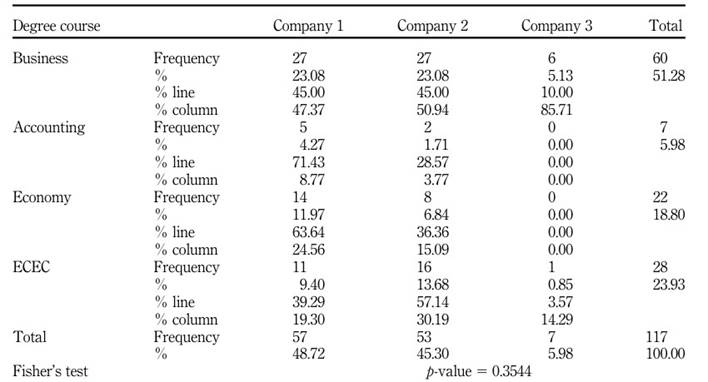
Table 9 contains data on the intersection between professional experience and chosen company.
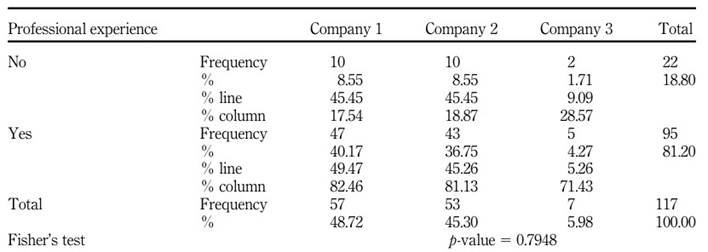
Table 9 p-value of Fisher’s exact test for the variables of professional experience and chosen company
Source(s): Authors’own elaboration
As shown in Table 9 , 95 (81.20%) of the 117 participants had professional experience. The distribution of answers, in both cases, with or without professional experience, increased for the choice of Company 1. The p-value found with Fisher's exact test was 0.7948, above the threshold value of 0.05, which attests to the statistical significance of the relationship between variables. Therefore, no association was detected between these variables.
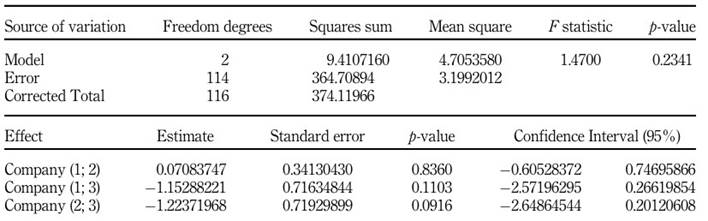
Finally, the ANOVA test was applied to analyse the relationship between the variables age and chosen company. Table 10 presents the results.
Using the ANOVA, Table 10 presents the relationships between age and choice for different companies. There was no statistically significant relationship between age and choice for companies 1 and 2, with a standard error of 0.3413, a confidence interval ranging from −0.6052 to 0.7469 and a p-value of 0.8360. Likewise, there was no significant relationship between age and the choice of companies 1 and 3, with a standard error of 0.7163, a confidence interval ranging from −2.5719 to 0.2661 and a p-value of 0.1103. There was also no significant relationship between age and the choice of companies 2 and 3, with a standard error of 0.7192, a confidence interval ranging from −2.6486 to 0.2012 and a p-value of 0.0916.
Table 10 p-value of the ANOVA test for the variables age and chosen company
Source(s): Authors’own elaboratio
When analysing the answers to Questionnaire A, it was observed that Company 1 received 38 votes, representing 35.51% of the total, while Company 2 received 69 votes, corresponding to 64.49%. In Questionnaire B, which included a gimmick, Company 1 received 57 votes, that is, 48.72%; Company 2 received 53 votes, representing 45.30%; and the decoy, represented by Company 3, was chosen by seven respondents, which corresponds to 5.98%. Thus, there was a change in the response distribution.
However, verifying the p-values based on the relationship between the categorical variables (gender, course, age and professional experience) and the chosen company, no statistically significant association was found.
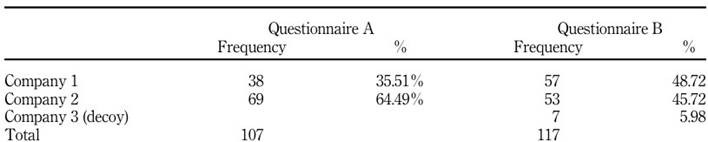
The results of Questionnaire A (without a gimmick) indicate that Company 2 was chosen by more people than Company 1 (see Table 11 ). Company 1 received 35.51% of the votes, whereas Company 2 received 64.49%. This suggests that most participants considered Company 2 as a better investment option than Company 1.
Table 11 Results of the companies’ choices in questionnaires A and B
Source(s): Authors’own elaboration
However, the responses changed when Company 3 (decoy) was added to
Questionnaire B (with decoy). It is important to remember that Company 3 operates in the same sector as Company 1 but with lower performance. Company 1 was chosen by 48.72% of the participants, whereas Company 2 received 45.30% of the votes. Company 3 was chosen by only seven participants (5.98% of the total). This response change suggests that Company 3 served as a decoy, attracting participants to choose Company 1.
In other words, the presence of Company 3 as an inferior investment option seems to have influenced participants to choose Company 1 as their best option. This decoy effect distorted the results between Questionnaires A and B.
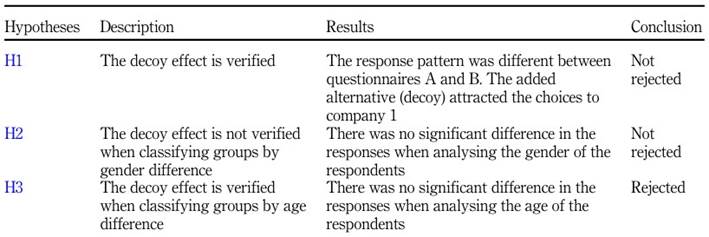
The results supported Hypothesis 1, suggesting that adding a decoy company in Questionnaire B successfully attracted more responses to Company 1 than to Company 2. These results align with previous studies such as Silva and Serpa (2012) and Leão and Fajardo (2019). In addition, the theory proposed by Ariely and Wallsten (1995 ) provides evidence for these results, suggesting that when there is no dominant alternative, a new option (decoy) can change the decision-maker's perception of the other available options.
The analysis of responses about gender, course, age and professional experience did not indicate significant differences in company choice patterns. Gender did not affect the choice between companies, as there was a dispersion between Companies 1 and 2 for different gender orientations in both cases (Questionnaires A and B). Results like those found by Fukushi et al. (2021) support Hypothesis 2. Furthermore, the results for the courses, professional experience and age were similar. However, the age evidence contradicts the findings of Fukushi et al. (2021), leading to the rejection of Hypothesis 3. Table 12 summarises the results and test hypotheses.
5. Discussion
In this section, we discuss the theoretical and managerial implications of the results obtained and their limitations. Additionally, an agenda for future studies in this research area is presented.
5.1 Theoretical implications
The results of this study have several theoretical implications. First, they are relevant for research in behavioural finance, mainly because of the proposal to investigate the decoy effect. Second, the study adds to the growing literature that analyses emerging markets —economies less relevant to international financial market investigations. Finally, the results differed from the findings of the international literature, which suggest further research in the same area to identify whether it is possible to establish a consensus on the topic initially investigated by Ariely and Wallsten (1995 ).
5.2 Policy/managerial implications
Regarding practical and managerial implications, this study analyses people's rationality in making investment decisions. The mental traps presented daily can compromise rational resource allocation choices. The results of this study shed light on cognitive traps. This is especially true when looking at different groups of students, gender, age and professional experience.
5.3 Limitations and future research agenda
This research was limited to analysing the decoy effect in undergraduate students at a business school in Brazil. For future research, we suggest an investigation using a larger sample of respondents. We only used students from a business school. We recommend different profiles, financial market professionals and qualifications in other areas. A more structured questionnaire with varying dimensions of questions about investments can generate more robust results for the decoy effect.
6. Conclusions
In this study, the decoy effect was investigated by applying two questionnaires, one with the presence of a decoy alternative, to a set of 224 respondents with knowledge of business fundamentals since they were students in the last semesters of four undergraduate courses related to the business area at the FEA-RP of the USP. The data, which reflected simulated investment decisions in stocks of companies listed on the Brazilian Stock Exchange, were analysed using Fisher's exact test, Student's t-test and the ANOVA test to detect the occurrence of the decoy effect. The investigation also aimed to detect a potential relationship between the variables of gender, age, degree and professional experience with the type of decision made. The results showed evidence of the decoy effect but without statistical significance for categorical variables.
The main conclusion of this study is that a decoy effect was detected. The results of the statistical tests applied to the categories did not show sufficient significance levels. This finding does not align with those of the international studies by Wedell (1991 ), Highhouse, 1996 ) and Doyle et al. (1999 ), but is in line with the findings of the studies conducted in Brazil by Silva and Serpa (2012) and Leão and Fajardo (2019 ).
Other significant results of this study refer to the tests performed to detect a potential association of the variables gender, age, degree and professional experience of the respondents with investment decisions with and without the decoy alternative. No statistically significant associations were observed. The gender class results corroborated the findings of Fukushi et al. (2021 ). The age class results conflict with the findings of Fukushi et al. (2021).

