1. Introduction
The father of behavioral finance is Daniel Kahneman, who won the Nobel Prize in economics for his prospect theory. The pioneering researchers in the field of behavioral finance who have made enormous contributions are Daniel Kahneman, Amos Tversky and Richard Thaler. They developed behavioral biases that are considered to be a building block of behavioral finance. Behavioral biases are at the root of the contradictions between the fields of traditional finance and behavioral finance; the latter attempts to study the psychological and sociological issues that affect investment decisions and strategies. Investment decision making depends on one intrinsic factor: the behavior of the investor (Sattar et al., 2020). When making investment decisions, investors can be biased. Rational investors are very aware that optimized decisions should be part of their decision making (Ikram, 2016).
Behavioral finance therefore explains how and why emotions and cognitive biases create anomalies in the stock market for investors. But in modern finance, we take the concept of rationality and decision based on a logical theory such as the capital asset pricing model, the efficient market theory which considers that people are rational and work for the maximization of their wealth, but the fact is that people behave irrationally, which is not predictable in real life, this irrationality is related to behavioral finance. Behavioral finance explains our actions and behavior, but modern finance is related to explaining the actions of an economic man. Traditional finance is related to decisions in which all information is available to make an investment decision.
Several studies show that heuristic behavior indeed has a significant impact on the investment decisions. Ikram (2016) found that representation bias and availability bias have an influence on the investment decisions. The results are also consistent with Rasheed et al. (2018). Sattar et al. (2020) on his study found that behavioral biases have a significant impact on the investment decisions. Anchoring, availability bias and representation bias significantly influenced the investment decisions. Istrate (2018) expressed that accounting information plays an important factor in investment decisions, and the existence of asymmetric information will lead investors to imitate the behavior of those who have obtained the essential information. Farooq and Sajid (2015) revealed that risk aversion also has an impact on the investment decisions. Ikram (2016) stated that investors become risk averse when returns are above the target level and are strongly related to past losses and gains.
Overconfidence, hoarding, anchoring, cognitive dissonance, availability bias, self-attribution, mental accounting, framing and representation bias are some of the biases considered as building blocks of behavioral finance that significantly influence the individual investor's decision-making (Shefrin and Thaler, 1988; Singh, 2016).
Behavioral finance proposes that the investment decision-making process is influenced by various behavioral biases that cause investors to deviate from rationality and make irrational investment decisions (Niehaus and Shrider, 2014).
This article therefore proposes to determine the different facets of the concept of belief heterogeneity and to assess its possible contribution to the assimilation of the information interpretation process.
According to the conclusions of Darrat et al. (2007), we can deduce that the heterogeneity of beliefs can only be considered as transaction motivation in the presence of the behavioral anomaly “overconfidence” that is likely to increase the “self-attribution” bias in case of coherence between private information and disclosed public information. In short, it is the simultaneous presence of these two biases that is likely to create the heterogeneity of beliefs. However, not anyone can only conform to these two anomalies but also to others that are emotional, cognitive and even social. Moreover, it is the presence of the different anomalies, correlated with one another that leads to the heterogeneity of beliefs across these different anomalies.
To our knowledge, there are no empirical studies that have dealt with the direct approximation of the heterogeneity of beliefs, but rather an indirect approximation measured by the difference in analysts' forecasts (Kandel and Pearson, 1995; Chung et al., 2002). Moreover, even if we wanted to replicate this measure in the Tunisian context, the absence of data on analysts' forecasts or the sentiment or confidence index that should normally be granted by the National Institute of Statics would make this task difficult.
This research proposes to help identify the variables that truly determine the process of interpreting information. We wish to formulate recommendations for the use of information, in order to help professionals and investors in the orientation of the investment strategy. In particular, we attempt to indicate the variables to which attention should be paid.
2. Literature review
The concept of behavioral finance emerged in the early 1980s with the initial work of a group of finance professors, Hersh Shefrin, Robert Schiller, Werner De Bondt and Richard Thaler. These professors were interested in studying the behavior of traders in relation to the movements of financial markets. The early years of behavioral finance were very rich in discoveries about both the individual behavior of traders and the overall understanding of market movements.
The theory of behavioral finance explains economic and financial models using behavioral arguments rather than arguments based on the rationality of the investor. This approach is then linked to the psychology of the investor in decision making. It addresses his sentimental side. It is for this reason that the concept of irrationality is the basic argument used in this theory. It thus criticizes the neoclassical theory based on preferences derived from the axiomatics of Von-Neumann and Morgenstern (1944) and the maximization of the utility function.
The existence of behavioral biases explains the differences between the observed behavior of agents and the rational behavior on which standard financial economics is based. Each individual has his or her own perception of things, which are simplified by heuristics. This simplifying heuristics are internal characteristics of all economic agents.
The stock market is filled with several stocks and abundant information about each stock. Processing this information and taking a rational decision as to which the transaction to make is a very difficult decision and a big drain on the mind. Emotions play a vital role in this decision-making process and result in irrational decisions. Financial advisors and wealth managers are assigned the most important task of guiding the investors through this process of emotional decision-making (Renu and Christie, 2019).
2.1 Indirect measures of the heterogeneity of beliefs
This article will focus on proposing the variables that will embody the concept of belief heterogeneity in the final theoretical model. This heterogeneity manifests itself through a bias in the understanding of information, resulting in the misinterpretation of the information that influences the investor's decisions (De Bondt and Thaler, 1985).
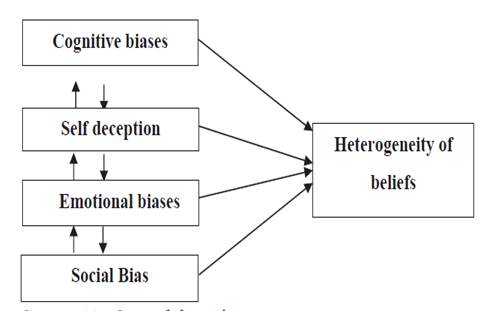
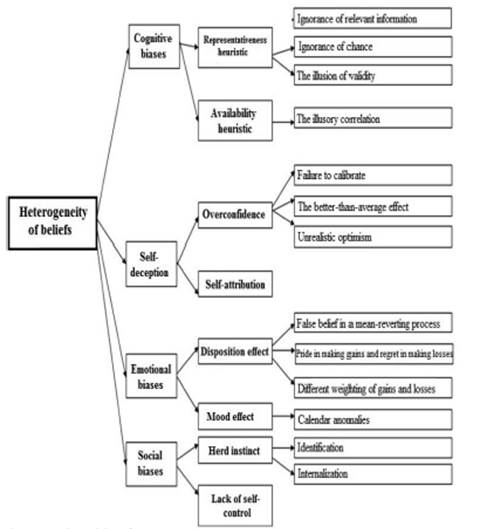
As a result, the heterogeneity of beliefs has various origins, the best known of which in behavioral finance are self-deception, cognitive bias, social bias and emotional bias. The different types of behavioral anomalies are likely to explain belief heterogeneity.
Our figure illustrating the different categories of behavioral anomalies then becomes as follows (Figure 1): Still on the theoretical level, this work considers the concept of the heterogeneity beliefs in an original way. While its definition is based on solid theoretical foundations (Harris and Raviv, 1993; Varian, 1985), the temptation to propose a direct quantitative measure does not exist until now. For some, the heterogeneity of beliefs reflects the difference in traders' views of public disclosure. For others, it reflects the disagreement in the interpretation of private information and it reproduces the difference in investors' opinions related to the realization of one state of nature rather than another.
2.2 The specific factors of the heterogeneity of investors' beliefs
This article therefore proposes to determine the different facets of the concept of heterogeneity of beliefs and to assess its possible contribution to the assimilation of the information interpretation process. In this case, our research hypothesis aims to confirm or deny that belief heterogeneity can be measured directly through the different behavioral anomalies in the Tunisian context, which are, as previously mentioned, self-deception, cognitive bias, social bias and emotional bias.
2.2.1 Cognitive biases
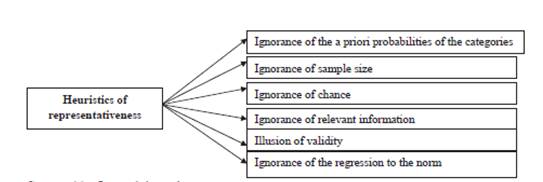
Cognitive biases correspond to the set of heuristic simplifications as well as the two anomalies of limited attention and conservatism. Kahneman and Tversky (1982) defined heuristic simplification as a simplified process of information processing to make a quick decision (see Figure 2).
2.2.1.1 Heuristic of representativeness
2.2.1.2 Availability heuristic. This is the ease with which examples can come to mind (Kahneman and Tversky, 1974) (see Figure 3).
2.2.1.3 Anchoring heuristic. The presence of the anchoring heuristic has been illustrated by the research of Slovic and Lichtenstein (1968) and Kahneman and Tversky (1974) (see Figure 4).
2.2.1.4 Conservatism bias. This is a slow update of the investor's beliefs following the disclosure of new information. This implies that the asset price adjusts gradually over time (Bernard, 1992).
2.2.1.5 Limited attention. The explanation for this anomaly is that agents are confronted with a large amount of information, which leads them to confuse relevant information with irrelevant information (Daniel et al., 2002).
2.2.2 Self-deception
2.2.2.1 Overconfidence. It is a bias that exists when the individual is very confident in his knowledge and abilities. Studies have shown that an overconfident investor is one who overestimates his own capacities to generate information and data which will allow him/her to build forecasts (Bouteska and Regaieg, 2020). Previous studies have distinguished between four types of overconfidence: miscalibration, better-than-average effect, control illusion and unrealistic optimism (Glaser and Weber, 2007; Statman et al., 2006; Langer and Roth, 1975; Acker and Duck, 2008) (see Figure 5).
2.2.2.2 Self-attribution
Self-attribution is congratulating oneself for being better than others (Chan et al., 2004; Friesen and Weller, 2005; Gervais and Odean, 2001).
2.2.3 Emotional bias
Emotion is defined as the affective resonance due to a discrepancy between the mental perception of a situation and reality. It is also a process of revision of beliefs (Livet, 2002).
2.2.3.1 Disposition effect. Shefrin and Statman (1985), Odean (1998), Barber and Odean (1999) define the disposition effect as the tendency to sell winning stocks as quickly as possible and to keep losing stocks for a long period of time. It has three sources (Grinblatt and Han, 2002) (see Figure 6):
2.2.3.2 Mood effect. Mood can affect human behavior and the investment decisions. Several factors can explain this anomaly: the level of sunlight, the moon effect and calendar anomalies (Hirshleifer and Shumway, 2003; Kamstra et al., 2003) (see Figure 7).
2.2.4 Social bias
2.2.4.1 Herd instinct. This anomaly corresponds to a kind of pure imitation which prevails when the lack of knowledge of the individual is absolute (Orléan, 1986). Kelman (1958) identifies several forms of conformism, from a certain number of experiments (see Figure 8).
2.2.4.2 Lack of self-control. The lack of self-control has been discussed by Snyder and Gangestand (1986), Kilduff and Day (1994) and Biais et al. (2005). In our case, we will refer to the measurement scale proposed by Snyder and Gangestand (1986).
The various behavioral anomalies outlined above are the sources of belief heterogeneity. This allows us to formulate the following hypotheses:
H1. Belief heterogeneity is a construct with four dimensions: cognitive biases, self-deception, emotional biases and social biases.
H2. The facets presented above converge on a higher-order factor, which is belief heterogeneity.
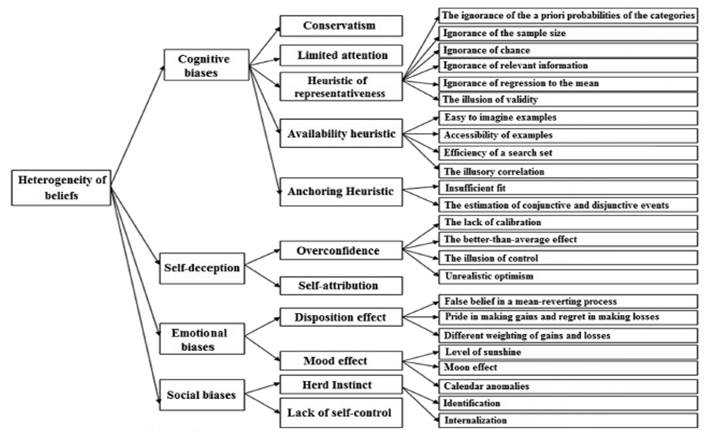
2.2.5 Summary diagram of the different factors. The aim of this work is to shift the point of view, which consists of considering that the heterogeneity of beliefs can be responsible for the change in the investor's decision process. There are certainly other concepts that would have their place in the theoretical framework of this article. However, the objective of this model is not to be exhaustive (see Figure 9).
3. Method
3.1 Research design
The use of the cognitive map in the field of behavioral finance has been the subject of few investigations. It aims at a better conception of the cognitive universe. It seems useful in order to conceive the key determinants of the heterogeneity of beliefs. Therefore, our study is articulated in this logic.
In other words, our study aims, through a survey addressed to investors, to determine the specific factors that influence the heterogeneity of investors' beliefs when making decisions in Tunisia.
The use of cognitive mapping as a study tool has seen remarkable development in the political science work of Smith and Ryoo (2003) in the field of organization. The use of this method of analysis has gained momentum in recent years, especially with Cossette (2003).
The introduction of cognitive mapping in the context of our work is to highlight and analyze the specific factors behind the heterogeneity of investors' beliefs. Our use of this method is justified by Axelrod's (1976) study of “SME managers' perception of their social responsibility: a cognitive mapping approach.”
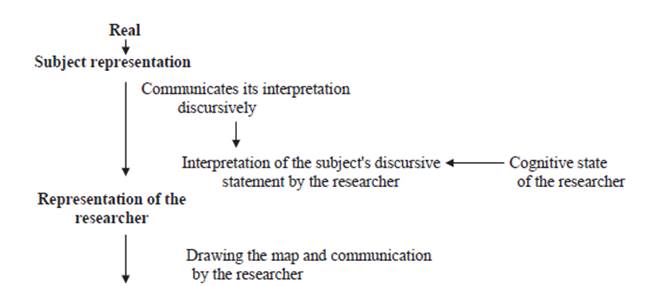
Thus, the cognitive map is merely a discursive representation (that of the researcher) of a mental representation (that of the subject), Bougon et al. (1977). Thus, the researcher who introduces this technique into his study draws the map according to his own perception of reality. This dual representation of the cognitive map is well analyzed in the following figure (Figure 10), which shows that the researcher draws the map after a written and oral discourse by the subject, linking the concepts expressed by causal links (influences) (in our study and based on our contacts with investors, we will trace these influences between the different determinants of the specific factors of the heterogeneity of investors' beliefs. These causal links produce a set of nodes. These nodes represent concepts that are linked by arrows due to causal influences.
Referring to the various analyses and definitions mentioned above, we can say that the cognitive map appears as a graphic schematization of the mental representation made by the researcher on a studied subject. Eden et al. (1979) suggest that a cognitive map can be individual or collective, and that this schematization can be drawn either for a single person, or for several. In fact, it is in this context of analysis that our work takes place, through which we aim to present a new technique for modeling and analyzing the mental representation that investors make when making decisions. The latter is constructed through the aggregation of individual cognitive maps according to Huff (1990).
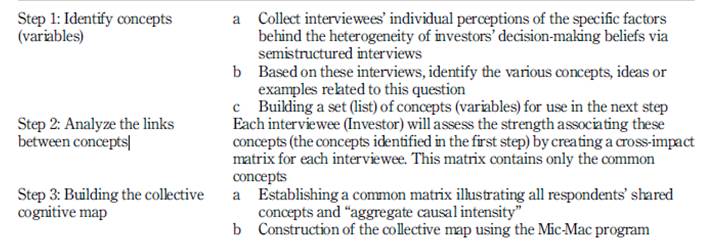
Using the Mic-Mac program, we propose a new three-step technique for building a collective (average) map.
The three steps are summarized in the following table (see Table 1):
We will follow the various stages of the approach analyzed in detail earlier to draw the “average” cognitive map using the “Mic-Mac” data processing program as a technique for analyzing the specific factors influencing the heterogeneity of investors' beliefs in the Tunisian context (see Figure 11).
In our context, we have chosen a nonprobability judgment sample. The target population includes different categories of participants: Chairman and Chief Executive Officer (CEO), Managing Director, Chief Executive Officer, Chief Financial Officer, Stockbrokers, Moral investors and Physical investors. The depth interview is generally intended to determine from which concepts an individual or a group of individuals structure their reality and how they establish links between these concepts. As part of our survey, we sent out emails and conducted face-to-face interviews. Follow-up was done through traditional telephone interviews.
During the identification of concepts (first stage), each respondent underlines different concepts or ideas that seem to be linked in one way or another to the problem. The objective of the study during the second phase, and according to Eden et al. (1979), the interviewees will advocate a direct link between the variables, that is to say a link without any intermediary or mediating variable because the existence of this intermediation could lead to duplication, which would distort the analysis between the common concepts (variables), thus resulting in a common cross-impact matrix (structural analysis matrix).
In the next step (the third step), the collective matrix is constructed from the individual matrices. In this matrix, we find the common concepts and the average weights of all the respondents concerning the problem studied. This construction is done through the aggregation of the matrices of common concepts collected during the second step. We will follow the different steps of the approach analyzed in detail before in order to draw the “average” cognitive map using the “Mic-Mac” data processing program as a technique to analyze the specific factors that influence the heterogeneity of investors' beliefs in the context of Tunisia.
3.2 Data
Our completed interviews allow us to identify between 38 and 42 concepts for each respondent. The combination of these various concepts permits us to come up with a list of 29 common concepts for all respondents. These common concepts will be structured around individual and collective (average) impact matrices. Using the program (Mic-Mac), we will construct and analyze the cognitive map.
List of Variables:
Heterogeneous beliefs: Heter_beli
Ignorance of the sample size: Ign_sam_sz
Ignorance of chance: Ign_chance
Ignorance of the relevant information: Ign_rl_inf
Ignorance of a priori probabilities of classes: I_P_P_C
The validity illusion: Val_illu
The easy to imagine examples: Eas_im_exa
Accessibility examples: Acces_exam
The effectiveness of the search set: Eff_sea_se
Illusory correlation: Illu_corre
Ignorance of the regression to the mean: Ign_reg_me
Insufficient adjustment: Ins_adj
Estimation of connective and disjunctive events: E_C_D_E
Calibration error: Calib_error
The better than average effect: Bett_aver_ef
The illusion of control: Ill_cont
The unrealistic optimism: Unre_optim
False belief in a process of mean reversion: F_B_P_M_R
Pride gains and regret realize losses: P_G_R_R_L
Different weight gains and losses: D_W_G_L
Insolation level: Insol_lev
Moon effect: Moon_eff
Calendar anomalies: Calen_anom
Identification: Ident
The internalization: Intern
Self-attribution: Self_attr
Lack of self-control: Lack_sel-co
Conservatism: Conser
Limited attention: Lim_atten
3.3 Analytical procedure
This allows us to determine the explanatory variables with the help of the cross impact matrix (structural analysis matrix). The cross impact matrix-multiplication A ranking (Mic-Mac) also allows the ranking of these variables according to their sensitivity to the environment (dependency variables), according to their impact on the other variables (motor variables), as well as by order of influence and dependency. The Mic-Mac also allows processing the collected information in the form of graphs and plans configuring the cognitive universe of investors.
4. Results
We recall that the cognitive map, our evaluation tool, is a technique used to find out an individual's opinion on a particular subject or issue in a schematic rather than linear format. Our study aims, through a survey addressed to 45 investors, to determine the specific factors that influence the heterogeneity of investors' beliefs when making decisions in Tunisia.
The analysis of this map gives importance to the concepts (variables). According to Weick (1979), the concept is considered important if it has several links with the other variables. Indeed, a variable that reacts with a significant number of other variables will have one judged as crucial. Our analysis is based essentially on the cross-impact matrix, on the influence graph and on the influence/dependence plan.
4.1 The structural analysis matrix
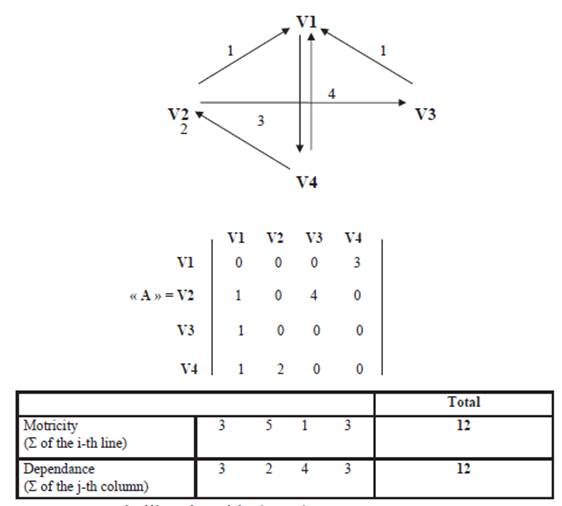
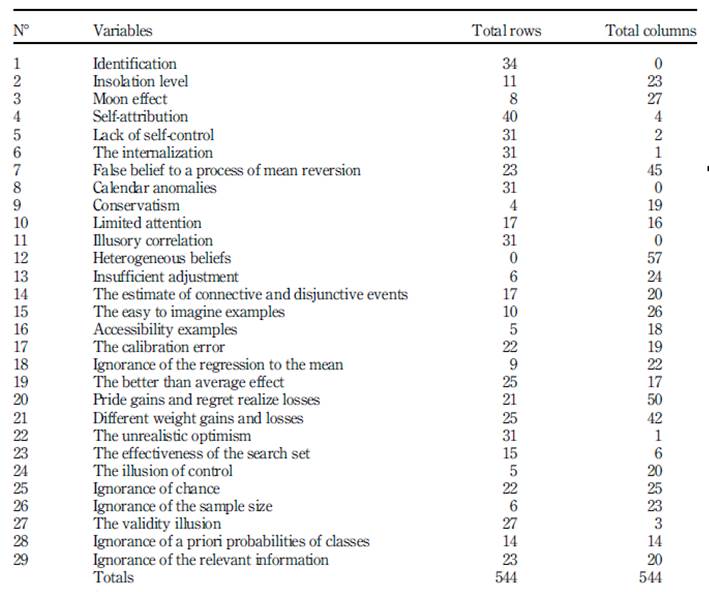
This matrix allows us to identify the key variables by summing up, in rows and columns, the weights between each pair of variables in order to measure the influence (sum in rows) and the sensitivity (sum in columns) of each concept (variable) on the heterogeneity of beliefs.
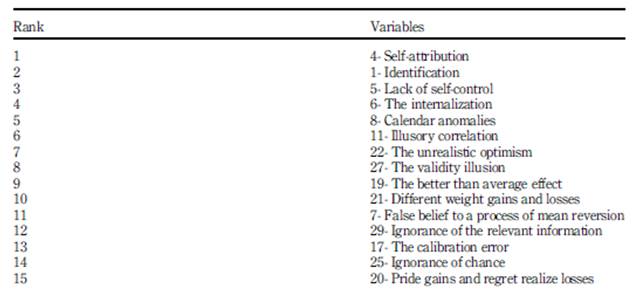
Looking at these two tables, it is clear that identification, internalization, lack of self-control, illusionary correlation, illusion of validity, ignorance of relevant information, unrealistic optimism, better than average effect, calibration failure and calendar anomalies are all variables that rank high in the pack. These variables are highly influential and a bit sensitive. They represent the determinants that explain well the subject of our study, which are the specific factors of heterogeneity in investors' beliefs (see Tables 2 and Table 3).
4.2 The influence graph
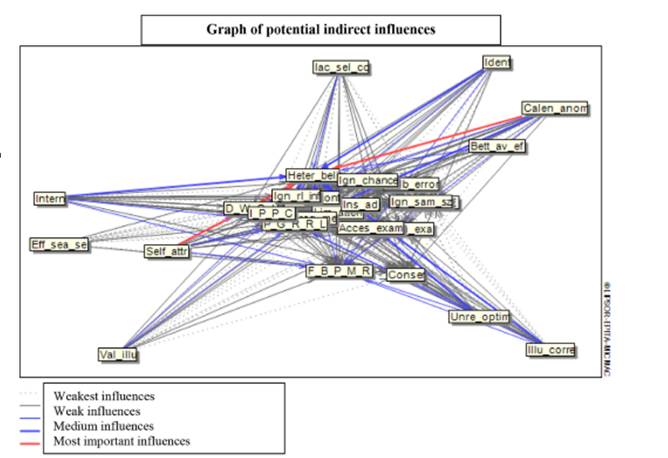
The figure below is a mental representation of the investors, who were asked for their opinions regarding the specific factors of heterogeneity in investors' beliefs when making decisions (see Figure 12).
Table 2 Ranking of variables (factors) according to their motricity and sensitivity criteria
Source(s): Own, extracted from the data
Table 3 Ranking of the 15 essential variables (factors) according to their motor and sensitivity criteria
Source(s): Own, extracted from the data
The analysis of the average map clearly shows two categories of factors. In the first category, we find the sensitive factors, or also called influenced factors or “consequences”, which are influenced by other factors (this category is grouped in the center of the map). Variables in this category are said to be very important if they have several direct links. In the second category, there are driving factors, also called influencing factors or “explanatory factors” which have a direct influence on many others. These factors are qualified only as very important when several direct links result from them.
This second category of influencing factors refers directly to the strong influence of the following variables; social bias (identification, internalization and lack of self-control), emotional bias (calendar anomalies, different weighting of gains and losses, and false belief in a mean-reverting process), cognitive bias (illusory correlation, illusion of validity and ignorance of relevant information) and self-deception (unrealistic optimism, better-than-average effect and failure to calibrate.)
4.3 The influence/dependency plane
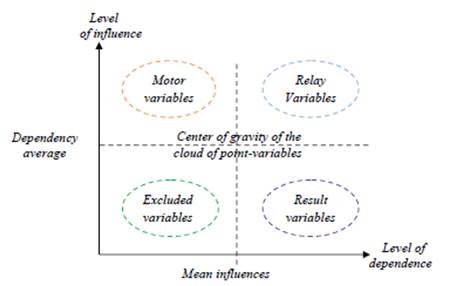
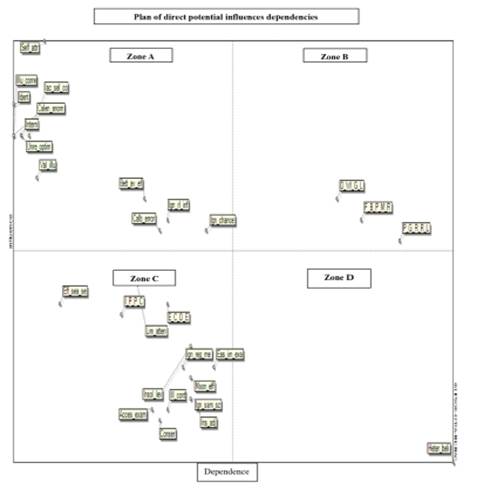
The influence/dependency plane is a graph in which each concept (variable) is projected according to its overall influence and dependence on the other variables (Figures 13 and (14). The projection of the set of points representing all of our variables in terms of the influence/dependence plane resulting from the structural analysis which discriminates the variables according to four distinctive groups (Drivers, Relay, Excluded and Resulting or Dependent). This division leads us to a perfect understanding of the specific factors of the heterogeneity of the investors' beliefs. Each group is distinguished from the others according to the effect of its variables on the heterogeneity on beliefs (Figure 14).
The figure above illustrates 4 different zones. Each of them groups together a set of variables having the same effects on the studied phenomenon. The following section illustrates these zones.
4.3.1 Zone A: the “driving” variables. The variables in zone A have a high index of motricity (influence) and a low index of dependence. They are called “explanatory” as they are the specific factors that explain the heterogeneity of investors' beliefs.
The first category refers to the heuristic factors of representativeness, namely ignorance of chance, ignorance of relevant information and illusion of validity. The second category clearly highlights the variable availability heuristics, such as illusory correlation. As for the third category, (the calibration failure, the better-than-average effect and unrealistic optimism) are the overconfidence variables that have a strong influence on belief heterogeneity. Self-attribution and the mood effect (calendar anomalies) are two variables that also exert a strong influence on investor decision making. This area also exposes the lack of self-control as an important variable in the studied phenomenon. Finally, the variable Herd Instinct (identification and internalization) has a deterministic effect on the heterogeneity of beliefs in our sample.
4.3.2 Zone B: the “relay” variables. Zone B highlights variables that are both highly influential and highly dependent, although they are factors of instability. The influence/dependence plane shows that these variables are located at the top right. These variables, which are driven by disposition effect factors measured by false belief in a mean-reverting process, pride in realizing gains and regret in realizing losses and the different weighting of gains and losses, are also factors that affect the heterogeneity of investors' beliefs. In turn, these variables are influenced by motor variables. These are points of amplification or tenderization of influence that force or constrain heterogeneity in investors' beliefs.
4.3.3 Zone C: the “excluded” variables. This zone group the “excluded” variables that have a low motor and dependence index and a relatively autonomous development. They have a weak influence on the heterogeneity of investors' beliefs. The influence/dependence plane figure illustrates some of the “excluded” variables, such as sunshine level, moon effect, illusion of control, insufficient fit … These and other variables do not exert a significant impact on the heterogeneity of investors' beliefs.
4.3.4 Zone D: the “results” variables. These variables have a low influence index and a high dependence index. They are outcome variables (effect variables) that are explained by their fit to the other two variables in zones A and B and also to the motor and relay variables. The variables in this zone are conditioned by several factors. In this case, the examination of our influence/dependence design shows us a single resulting variable “belief heterogeneity”. Hence, the latter is considered as the result of the other factors.
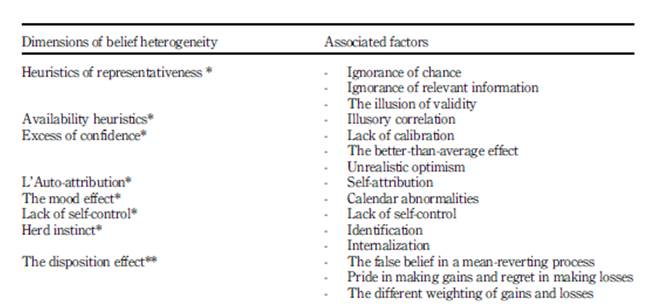
4.3.4.1 Dimensions of the heterogeneity of beliefs and the associated factors
In order to identify the specific factors of the heterogeneity of investors' beliefs in the Tunisian context, the use of the cognitive mapping of the interviewed investors allows us to classify the variables in several categories/dimensions. Their application allows us to construct eight dimensions of belief heterogeneity, as shown in the table below (see Tables 4 and 5 ):
Finally, we can note that the Mic-Mac program has facilitated the identification of certain specific factors in the heterogeneity of Tunisian investors' beliefs. Consequently, the following conceptual model, illustrated in Figure 15, will be adopted:
5. Discussions
5.1 Theoretical implications
The first theoretical contribution of this research is to propose an integrative conceptual framework for the study of belief heterogeneity. This conceptual framework consists in addressing a set of perspectives that has been considered in isolation until now. In other words, this work makes a conceptual contribution by positing the possibility of directly measuring belief heterogeneity.
This work attempts to go beyond the simple definition of belief heterogeneity proposed by Harris and Raviv (1993) and Varian (1985). To do so, we have used a distinct theoretical framework, which is the theory of behavioral finance.
This contribution represents, in our view, a new step forward in understanding the concept of belief heterogeneity, although it is mentioned in the field of behavioral finance, and has never really been the object of a clarification effort at the methodological level. In this work, we have attempted to take a further step towards understanding and defining this concept.
5.2 Managerial implications
The stock market is filled with many stocks and plenty of information about each stock.
Emotions play an essential role in this decision process and this result in irrational decisions. For the first time, an attempt to construct a diverse measure of belief heterogeneity is made by our study, which also makes some crucial contributions to the literature. In fact, it makes a methodological contribution to the development and analysis of the “average” cognitive map in the context of behavioral finance precisely for the context of investor belief heterogeneity. Moreover, almost all studies in this context use other tools that seem inappropriate due to the particularity of our variable to be explained (heterogeneity of investors' beliefs). In addition, it offers a new and well-structured technique for the construction of cognitive maps, e.g. the Mic-Mac program.
Table 4 Dimensions of belief heterogeneity and associated factors
Note(s): *Dimension of motor variables
** Dimension of the dependent variables
Source(s): Own elaboration
5.3 Practical implications
The mechanisms of perception and interpretation of public and private information by investors are intricate and multifaceted. Investors perceive information through various channels, and their interpretation is influenced by cognitive biases, emotions, experience and the broader market context. Understanding these mechanisms is essential for investors to make informed decisions and manage their portfolios effectively.
Understanding the mechanisms of perception and interpretation of public and private information by investors has several practical implications for both individual investors and the broader financial community.
Investors should be aware of their own cognitive biases and how they can impact their investment decisions. This can help them to avoid making poor investment decisions based on irrational thinking. Investors should develop a mental model of the world that is based on sound financial principles. This will help them to interpret information more accurately and make better investment decisions. Investors should not let their emotions get in the way of their investment decisions. They should make investment decisions based on facts and logic, not on fear or greed. Investors should be wary of groupthink and should be willing to voice dissenting opinions. This can help them to avoid making poor investment decisions that are based on the opinions of others. By understanding the mechanisms of perception and interpretation of public and private information by investors, and by taking steps to improve their own ability to process information, investors can make more informed investment decisions and improve their chances of success. Incorporating these practical implications can lead to more informed and rational investment decisions. It's important to remember that investment decisions are complex and influenced by various factors, and a combination of rational analysis and emotional intelligence is often required for successful outcomes.
5.4 Future research agenda
We believe that this research can form the basis for many extensions.
Use, for example, the variables “expertise” and “gender” as factors that can moderate the influence of behavioral anomalies on transaction volume. These moderators can then determine the path taken by anomalies to influence responses to information. In addition, investment experience increases investor overconfidence. Professionals, for example, can then trade securities based on their skills and experience. Therefore, we can say that expert agents have higher overconfidence than less experienced agents.
6. Conclusions
The objective of this research is to identify the specific factors of the heterogeneity of the beliefs of Tunisian investors. To do so, we chose the cognitive approach using the method of structural analysis as a tool for structuring ideas and collective thinking in order to achieve our objective. To our knowledge, this method is the subject of a number of empirical studies in the field of behavioral finance. This method leads to a better understanding of the cognitive universe of individuals given the particularity of our research problem, in the identification and analysis of the major factors of belief heterogeneity. It is a phenomenon that designates several fields of study, namely cognitive psychology. Therefore, the heterogeneity of beliefs seems to be a nonquantifiable phenomenon. It is rather closer to philosophy. The application of this problematic on the answers of Tunisian investors allowed us to present, in a configuration of a collective map, the specific factors of the heterogeneity of beliefs.
The contact with investors, the determination of their vision, the pooling in the form of an aggregation as well as their in-depth analysis with the help of the Mic-Mac program, form preliminary and essential steps in the success of an approach which traces a common vision of the reality relating to the heterogeneity of beliefs.
The use of the average cognitive map, as a tool for the analysis of the specific factors of belief heterogeneity through the Mic-Mac program, allows us to discover some particularities that would be difficult to detect using other means. This analysis is based on the following three devices: first, the structural analysis matrix, which allows us to measure the influence or sensitivity of each concept/variable/factor on the heterogeneity of beliefs. Second, the influence graph, which allows us to identify the influencing and influenced factors, and finally, the influence/dependence plane, which leads to a grouping of the variables into four groups. This grouping emphasizes a readability that is appropriate to the heterogeneity of the beliefs. The combination of these three devices clarifies the dimensions of belief heterogeneity (representativeness heuristics, availability heuristics, excess confidence, self-attribution, mood effect, lack of self-control and herd instinct) as well as the associated factors. These dimensions were distinguished by the proximity of the variables/concepts in the influence/dependence plane and by their semantic closeness.
The results obtained provide an explanation of the mechanisms of perception and interpretation of public and private information by the investor. We have positioned ourselves against the current research, which is currently conducted on the heterogeneity of beliefs. Thus, instead of determining an indirect measure of this construct, we proposed a direct measure through the behavioral anomalies, especially since Shleifer (2000) states that there is no theoretical financial model that can take into account all the anomalies that are cited in the literature related to behavioral finance.
Then, the irrationality of the investor is approved through different anomalies that can influence the behavior of the investor and that are cognitive biases, self-deception, emotional biases and social biases. Cognitive biases are summarized in the heuristic simplification (heuristic of representativeness, of availability). Self-deception corresponds to overconfidence and self-attribution. Emotional biases are none other than the disposition effect and the mood effect. Finally, the social biases are the herd instinct bias and the lack of self-control bias.


