


 English (pdf)
 Article in xml format
 Article references
 Send this article by e-mail
 Cited by SciELO
  Similars in
SciELO
Similars in
SciELO 
 Permalink
1. Introduction
Innovations interface in all sectors to flourish economic growth (Schumpeter, 1911). Innovations in financial technology (FinTech) are rapidly modifying the financial sector globally. FinTech is changing conventional structures by expanding the value chains of financial services and creating efficient gains. Much interest in FinTech is linked to the way the financial sectors’ innovations improve access, services and efficient gains (Financial Stability Board, 2017). Financial technology has made its way into most aspects of the market. The categories of software usually used are financial planning and portfolio management. Technological innovations in the economies are considered to be drivers of productivity which accelerate economic growth (Eldomiaty et al., 2020; Silve and Plekhanov, 2014). Financial technologies are innovations in the financial sector which promote the financial growth procedure in an economy. Financial innovations boost financial development processes and support capital mobilization (Ansong et al., 2011). Expedited technological innovations bring durable economic growth over the long term (Orji et al., 2015).
Financial technology forms part of economic activities in many aspects. Recently, financial technologies have created structural changes in the financial systems by upgrading the financial institutions, services and customized payment systems (Simiyu et al., 2014). Additionally, financial technologies modify regulatory systems and move social attitudes towards financial improvement. This allows the financial sector to perform effectively and efficiently, maximizing economic resources productively (Hung, 2019). Financial technologies spread economic activities facilitating financial operations, inclusion, trade and upgrade efficiency. The innovation-growth theory postulates that financial technology improves the quality of financial products and services (McGuire and Conroy, 2013; Mroua and Trabelsi, 2020). Financial technologies in the financial sector improve performance, efficacy and efficient financial intermediation, which stimulate economic growth.
Economic growth is measured by the gross domestic product (GDP) per capita increase. Equally, this is a measure of aggregate revenue in terms of annual real GDP change rate (Jones, 2002). Economic growth represents a nation’s productivity rise in real national income (Hardwick et al., 1994). Schumpeter (1934) qualifies economic growth as an augmentation of the inflated market value of goods and services in an economy for a given duration. Commonly, economic growth indicates a rise in actual GDP or gross national product of a nation. Economic growth is perennial societies and government’s goal. Theories reveal that financial technologies increase the product variety of financial organizations and foster the rate of economic progress (Chin and Chou, 2004).
Recently, financial innovations in financial technologies have attracted researchers, policymakers and financial institutions' attention, considering their role in promoting the financial sector worldwide. Tufano (2003) described financial technology as the emergence and new diffusion of financial instruments, organizations, tools and markets of an economy. There are two forms of Fintechs innovations, which are product innovations and process innovations. Financial technology has multifunctions like services diversification, financial intermediation, technological improvement, resource allocation and institutional efficiency, which promote financial system advancement and economic growth (Okere, 2016).
Financial technology accelerates African economic growth with a remarkable mobile telephony usage. This permits inventive solutions to emerge, from electronic transactions to real time price information, which contributes to economic growth. The major challenge is to boost the population productivity, improve the ability to innovate and transform the economy positively (César et al., 2022; Kayizzi-Mugerwa, 2014). Sub-Saharan Africa (SSA) has been improving from harsh growth retardation in 2 decades. The economies were equally hard hit by the 2007-2008 global financial crises. The recovery is uneven across countries and subregions. The SSA per capita GDP growth is positive since 2017. This is insufficient to significantly reduce poverty and therefore remains vulnerable (European Investment Bank, 2018).
There is evidence of financial technology development in the East African Community (EAC) which supports economic growth. Considerable progress in financial technologies has been made within the last decades (Beck et al., 2015; Saadaoui et al., 2022). The EAC states incessantly reform their financial systems, embracing innovations like microfinance, internet banking (INB), mobile payments, mobile money and mobile banking (MB) to improve their economies. Financial sector transformations encourage financial technologies and improve financial system efficiency, which leads to economic growth (Moyo et al., 2014). MB introduction deepened financial intermediation and access, promoting economic activities since the marginalized population gained access to financial services through mobile platforms. Due to the financial inclusive features like availability, mobility and personalized small devices, mobile devices are widespread in most developing countries, overcoming geographical and socioeconomic barriers. Mobile devices reduce banks’ costs to enable a switch from huge fixed costly infrastructure in remote areas to a per-transaction variable cost structure like mobile money. Mobile devices allow customers to initiate instantaneous transactions and check account balances, limiting displacement costs to and from distant physical bank branches (Chinoda and Kwenda, 2019). The EAC countries initiated financial policy reforms in the 1980 and 1990s. However, the reforms are yet to trigger substantial innovations in Fintechs that could propel economic growth.
Generally, economic developments in the first half of 2018 revealed a gradual improvement in economic activities. The balance of payments is gradually improving from negative due to low economic activity. The current account unweighted average deficit reached GDP 7.4% in 2017 (European Investment Bank, 2018). This study is essential for policymakers to formulate useful regulatory frameworks to contain the negative aspects of financial technology such as cyber criminality, physical inactivity and obesity, employees’ job loss, poor sleep quality, social incompatibility and anxiety (Beck et al., 2015). This study adds to the existing stock of knowledge for future research and is useful to policy makers.
2. Literature review
The underlying theories of this study include task technology fit (TTF) Theory: This theory was propounded by Goodhue and Thompson (1995), who proposed that information technology would likely positively impact growth. The theory is applied when the information communication and technology capabilities meet the user’s transactions. There are some parameters which determine the TTF like value, capacity to locate, approval, adaptability, simplicity to apply and educate, prompt fabrication, reliable systems and users’ connectivity. This theory has diversified information sectors involving e-business alongside other theories which have information technology outcomes. This hypothesis holds that the growth of information is based on the commercial transactions related to the applied technological invention and the common man must be able to use it, and it should satisfy the particular user’s needs.
Financial Innovation-Growth Nexus Hypothesis: Literature reveals four forms of causal hypotheses. Firstly, the supply-leading theory where financial novelty propagates economic growth via financial growth, business effectiveness, financial services accessibility and efficient services to customers (Shittu et al., 2012). Secondly, the demand-following model, where growth promotes financial transactions at macro and micro levels, motivates innovations and technological advancement. Thirdly is the feedback effect created by both financial technology and economic development to mutually promote each other, otherwise called bidirectional causality (Qamruzzaman and Jianguo, 2019). Fourthly, the neutral hypothesis, which indicates that causality, does not exist between financial innovation and economic growth.
The regulation innovation model: It describes financial innovation based on the economic development history. This theory advocates that financial innovation is closely linked to social regulation and that social regulation reciprocates the causation with economic growth (Scylla, 1982). It is challenging to have financial innovations influence an organized economy with exact regulation. Thus, any control transformation in the financial system is seen as financial transformation. The rules and regulations for controlling the activities in the financial industry are regarded as financial transformation. Rules and regulations which represent financial benchmarks are the trajectory of financial refinement and transformation given the obstreperous force financial control exhibit on financial innovation. The constraint-induced theory contends that the intent to boost profit for financial institutions is the main motive for financial innovation (Silber, 1983). While certain constraints ensure management firmness, the constraints constrict the financial institutions’ adeptness. Financial institutions relentlessly seek to outsmart them through innovations. The constraint-induced innovation theory mooted financial innovation from a microeconomic view.
Empirically, Muthinja (2016), investigated the relationship between financial innovation and Kenyan commercial bank performance. The findings show that financial innovations significantly contribute to firms’ performance and that firm-specific factors are more vital for a firm’s current financial performance than industrial factors. Chipeta and Muthinja (2018) studied the impact of financial innovation on Kenyan banks’ financial performance. The findings reveal a positive alliance between financial novelty variables and banks’ performance. Okereke (2016) examined the impact of cashless bank operations on the Nigerian economic growth by applying the vector error correction model techniques. The results unveiled that growth is affected by financial innovation variables.
Okafor et al. (2017) utilized co-integration method to determine the long-term affiliation of growth and financial modernization variables. The modernization channels vary widely with the growth reaction. Omotunde et al. (2013) employed an investigative technique to check the impact of cashless operations on economic growth. The results revealed that cashless transactions decrease cash-linked corrupt practices and motivate foreign investments, which promote economic development. Dunne and Kasekende (2016) examined the impact of financial innovation on money demand in SSA from 1980 to 2013. The results unveiled a negative association between financial innovation and money demand. Domeher et al. (2014) investigated the determinants of financial innovation in Ghana’s banking industry using logistic regression. The results unveil that financial innovations like complexity, compatibility and perceived usefulness positively relate to e-banking usage.
Anthony and Aboagye (2014) investigated the relationship between bank competition, financial innovations and Ghanaian economic growth from 1990 to 2009, employing Autoregressive Distributed Lag (ARDL) techniques. The results revealed that financial innovation negatively affects economic growth in the long term and positively affects economic growth in the short run. Unidirectional causality exists from bank competition to economic growth, and bidirectional causality exists between financial innovation and economic growth. Meierrieks (2014) investigated the effect of financial development on innovation in 51 countries from 1993 to 2008. Using the Schumpeterian finance models of entrepreneurship and economic growth, the results unveil that financial development corresponds to stronger innovations. Aduda and Kingoo (2012) examined the correlation between electronic banking and Kenyan commercial banks’ performance. Return on asset proxy bank performance, while number of ATMs and debit cards proxies E-banking. The findings unveil a positive relationship between bank performance and e-banking. The findings of previous studies are still debatable. Table 1 summarizes the nuances in the contradictory results.
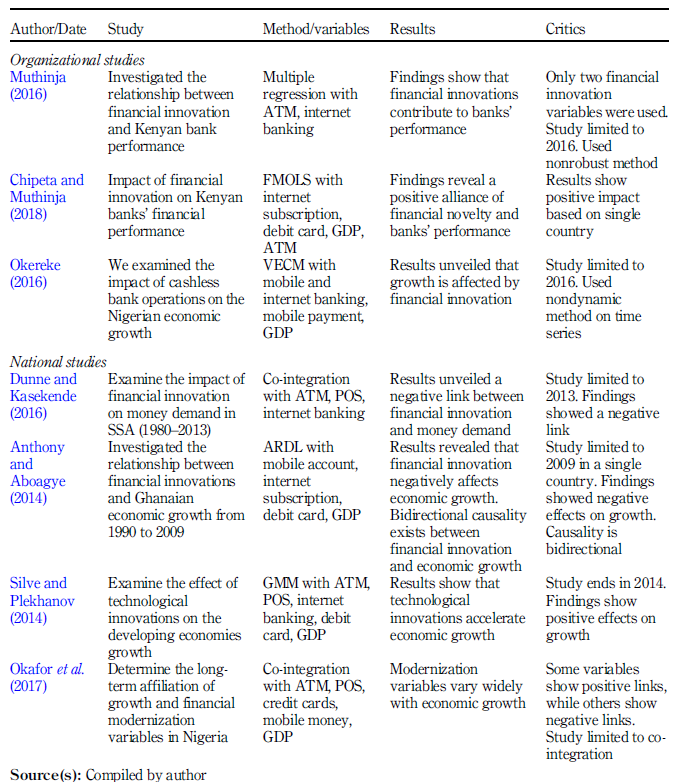
Research on the bond between financial technology and economic growth is not conclusive. These studies demonstrate that technological innovations are double edged-swords, with both positive and negative sides (Arnaboldi and Rossignoli, 2013). The nexus between financial technology and economic growth shows conflicting results like Adeola and Evans (2017), Chipeta and Muthinja (2018), which revealed positive relationships between them, while Anthony and Aboagye (2014), Dunne and Kasekende (2016) showed negative links. Thus, for financial organizations not outsmart the market with uncertain commodities and services, research is required. Hence, this study investigates the link between financial technology and economic growth in the EAC states from 1997 to 2019.
3. Method
3.1 Research design
This study uses an ex post facto research design employing processed data.
3.2 Data and variables
Secondary annual data are sourced from the world development indicators and world governance indicators from 1997 to 2019. The data is established in panels of countries where data of one country is placed above that of another and arranged according to years. These study variables consist of GDP per capita (GDPPC), which proxies economic growth, automated teller machine (ATM), point of sale (POS), MB, INB and debit card ownership (DCO) proxy FinTech. These variables are selected based on data availability, eliminate multicollinearity and ensure a parsimonious model. Government effectiveness (GEF) and rule of law (ROL) are two control variables purposively chosen because they directly serve as regulatory tools for Fintechs. The countries include Burundi, Eritrea, Ethiopia, Kenya, Rwanda, South Sudan, Tanzania and Uganda, which constitute an essential subregion in Africa.
3.3 Analytical procedures
Pre- and post-diagnostic tests like cross-sectional dependence inborn in panel analysis, unit root, heteroscedasticity and correlation are done to ascertain the series behavior. The various LM tests are employed Breusch and Pagan (1980), Pesaran (2004), and Baltagi et al. (2012) bias-corrected scaled. Levin et al. (2002) and Im et al. (2003) tests are utilized in a panel unit root to determine the series' stationarity. . Levin et al. (2002) assume a common unit root process across identical sections, while Im et al. (2003) assume unit cross-sectional independence. The panel ARDL model used is defined as follows:

With ECG being economic growth,
as the disturbance term, xt as an autoregressive term partially justified by the lagged variables, Zt is the regressors’ lags distributive component while p and q are the lags of the regress and and regressors, respectively. This ARDL is used whether or not the series are integrated of order I(0), I(1) or mutually. The ARDL is flexible, provides an opportunity to explore the dynamic model structure and allows for the impacts inferences. The ARDL is reliable and consistent in co-integration estimation relative to Engle and Granger (1987). ARDL provides both short- and long-run coefficients at the same time in panel analysis compared to time series analysis. Incorporating the financial technology nexus economic growth, equation (1) is transformed as

N and T denote number of observations and time span, GDPPC i proxies economic growth Q i , is the independent variables vector R i , is the control variables vector φ i & t are the intercept and disturbance term, respectively β t Ⴜ t are the independent and control variables coefficients respectively. Modifying equation (2) into ARDL (1, 1), gives equation (3) as:

Q denotes the explanatory variables successive lags distributive component.

Here Fintechi denotes financial Q i,-1 technology and R i,-1 are vectors of exogenous and control variables, respectively.
denote the long-term relationship θ t and V t are stochastic terms. The combine significance is performed to ascertain the long term relationship. The ARDL short-run dynamics specifications are obtained from the error correction mechanism in equations (5).

From equations (5), ∆ is the variable’s difference operator.
represent the short-run dynamics. The constant, error term and disequilibrium coefficients are represented by respectively. Other variables like ATM, POS, MB, INB and DCO entered the model to explain their influence on economic growth. The robust checks examine the link between the regressors and economic growth.
The appropriate panel ARDL estimation technique was selected via Hausman tests. The theoretical and empirical description of variables is as follows: GDPPC is the percentage yearly growth rate on a constant local currency (World Bank, 2018). Additionally, GDPPC measures the income of individuals in the economy as used by Ajide (2016). Financial technology variables which are linked to the functions of financial innovation of effective fund movement at the appropriate time, extracting information for decision, and facilitating the marketing of goods and services. Financial technology influences growth in different technological forms such as ATMs, which are the total number of ATMs per 100,000 adults in each nation. ATMs refer to mechanized telecommunication devices that provide financial institution clients access to public financial transactions as used by Qamruzzaman and Jianguo (2019). POSs refers to the number of POS terminals for 100,000 adult populations (Chukwunulu, 2019). Debit card owners are the number of debit cards per 1,000 adult population. MB is one of the main innovations which have increased financial access and depth to enhance economic growth. MB refers to banking or financial institutions’ services which allow customers to perform financial operations remotely using mobile devices like tablets, smartphones etc. (Wikipedia). MB is quantified based on the yearly transaction volume. Mobile transactions store currency value in accessible accounts or form via handsets, which ease the convertibility and transferability of cash in and out of the store currency value accounts (Bara et al., 2016).
INB is also referred to as online banking or web banking. This is an electronic payment system which permits financial institutions’ clients to perform financial transactions on their website. INB allows customers to monitor accounts, transfer money, download and manage investment loans and repayments (Wikipedia). This is measured in terms of annual transaction volume. GEF and ROL are employed as control variables. GEF implies the perceptions of civic service quality and freedom from political influence and policy making. It also refers to government realization and credibility to policy commitment, with calculated values lying between −2.5 and 2.5. ROL is the perception of the state capability to devise and apply policies which promote private sector development, with estimated values lying between −2.5 and 2.5. It is expected that all the regressors and control variables should enhance individual income to boost economic growth.
4. Results
4.1 Descriptive statistics
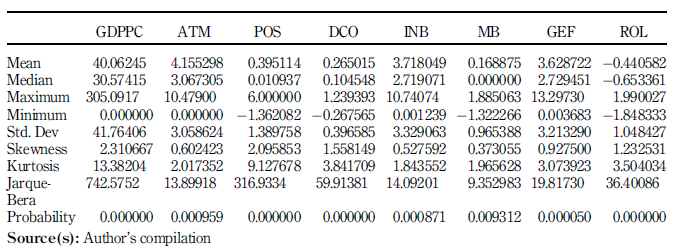
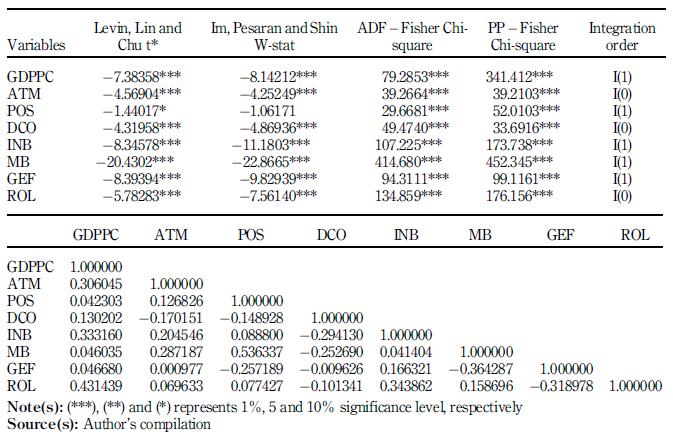
In Table 2, the results show that the GDPPC mean value (40.06) varies between a minimum of 0 and a maximum of 305. The standard deviation values indicate that GDPPC deviates furthest at 41.76 units, while DCO deviates least at 0.39 from the mean. The skewness reveals that all the variables are positively skewed. This implies that all the variables mean lays above zero. From the results, GDPPC, POS, DCO and ROL exhibit leptokurtic behavior, while ATM, INB and MB show platykurtic behavior. GEF shows mesokurtic behavior with a normal kurtosis value. The Jarque-Bera probability unveils that the series are not normally distributed since the probability values are below 5% significance level.
4.2 Unit root and correlation estimates
From Engle and Granger (1987), using ordinary least square regression on nonstationary data produces spurious results. For stationarity tests on panel data, several unit root tests are conducted. From Table 3, GDPPC, POS, INB, MB and GEF are first difference stationary while ATM, DCO and ROL are level stationary. ATMs, POS, DCO, INB, MB, GEF and ROL are positively correlated to GDPPC. This implies that all these variables move in the same positive direction with the dependent variable. Generally, the positive coefficients indicate that the regressors move in the same direction with the regressand while the negative coefficients reveal opposing directional motion. The correlation coefficients between the regressors and regressand are closer to zero, revealing that there is no multi-collinearity in the series since the values are lower than the threshold value of 0.7. This indicates a weak correlation between the variables as strong correlation implies that the variables have multicollinearity.
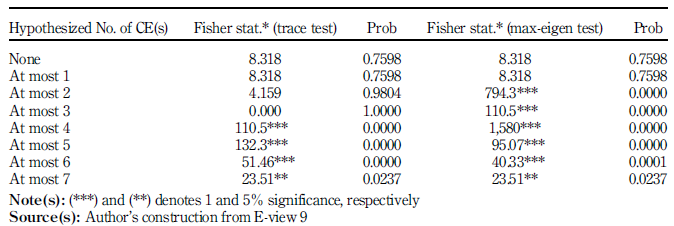
4.3 Johansen Fisher panel co-integration test
In Table 4, the co-integration test with eight hypothesized equations and t-statistics uses the Trace and Max-Eigen values. Ten out of sixteen tested hypotheses are statistically significant at 5% level. The results conclusively fail to accept the null hypothesis. Thus, a long-run bond between financial technology and economic growth exists in EAC countries.
4.4 Panel ARDL regression
In Table 5, the panel ARDL is performed. The findings unveil a long term-positive influence of automated teller machine, DCO and INB on economic growth. POS devices have an insignificant positive effect on economic growth, whereas MB has a negative impact on economic growth in the long run. The results show that a unit increase in ATM, DCO and INB influences economic growth to rise by 5.87, 29.99 and 5.25 units, respectively. The findings support the results of Muthinja (2016), Okafor et al. (2017) but contradict the studies of Anthony and Aboagye (2014), Dunne and Kasekende (2016). In the short run, the error correction term (ECT) coefficient is negative and significant at 5% level. The results confirm the financial innovation-model, which states that technological innovations promote growth, but oppose the findings of Bara et al. (2016), Michalopoulos et al. (2009), which ignored financial technology.
Table 5 Panel ARDL regression
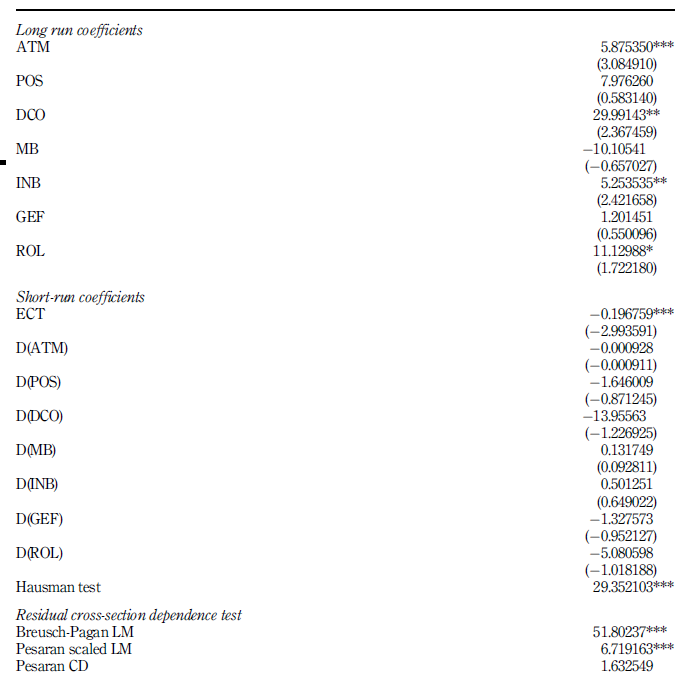
Note(s): (***), (**) and (*) represents 1%, 5 and 10% significance level, respectively, t-statistic values in parenthesis
Source(s): Author’s compilation
The Hausman test statistic is significant, thus rejecting the null hypothesis. This implies that the fixed-effects model is appropriate over the random-effects model. The cross-sectional dependence test determines if co-integration test is required. The results illustrate that the two associated t-statistic values are significant at 5% level. The results refuse to accept the null hypothesis and conclude that dependency exists. Thus, a common dynamism between financial technology and economic growth exist.
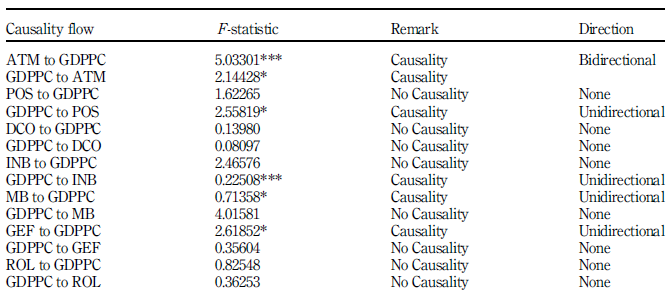
4.5 Granger causality test
Table 6 results indicate that bidirectional causality exists between ATM and economic growth. Unidirectional causality flows from GDPPC to POS and INB. Also, unidirectional causality flows from MB and GEF to GDPPC. The results corroborate the theoretical arguments of Chou and Chin (2004) that financial technology promotes long term growth via technologically innovative channels, which are apparently limited in the EAC region. The findings agree with the study of Moyo et al. (2014) that financial reforms stimulate financial technology, which boosts economic growth. These results contrast with the findings of Dunne and Kasekende (2016).
5. Discussion
5.1 Theoretical implications
The findings unveil a long term-positive influence of automated teller machine, DCO and INB on economic growth. These results suggest that with emerging technological developments and innovations in the financial systems, various financial assets, products and services positively promote economic growth. Equally, the bidirectional causality exists between ATM and economic growth, with unidirectional causality flowing from economic growth to POS and INB. The two-way directional causality implies that the ATMs promote economic growth and vice versa. As the economies grow, more POS and INB services are used.
A unidirectional causality flows from MB to economic growth, which indicates that MB stimulates economic growth. This is because financial products and services diversification and service expansion with innovated instruments help to connect the financially underprivileged population to the official financial systems via mobile operations. This facilitates income redistribution and poverty reduction to stimulate economic activities. The ECT coefficient is negative and statistically significant. This indicates that the adjustment velocity towards long-term disequilibrium initiated by shocks is 19.7%. This implies that the shortest possible duration the system could be pulled back to equilibrium is 5.1 year. The study findings align with the financial innovation-growth nexus hypothesis, regulation innovation theory and the constraint induced theory.
5.2 Policy/managerial implications
Feasible economic growth is observable in the financial systems of EAC countries that embraced financial technology based on the significant links of automated teller machine, DCO and INB. This implies that ATM promotes economic growth, and economic growth promotes ATM usage. On the other hand, economic growth encourages the use of POSs devices and INB in EAC states.
Governments and policy makers should improve on the policies that govern the use of financial technologies in the EAC states in order to boost growth. The government should reduce taxes on financial technology equipment and related services. The use of automated teller machine, DCO and INB should be encouraged through cashless transactions. Financial institutions should adopt cashless operation policies to encourage the use of financial technologies. All businesses with a capital of US$ 2000 should own and operate a POS device.
5.3 Limitations and future research
Some limitations of this study include data quantification, security and availability, regulation and compliance, and inadequate mobile and technical expertise required by the different economies to effectively implement financial technologies to benefit them. Future research is essential to ascertain data quality and compliance for economic growth. Research should explore the nexus of Fintech and growth using a composite index, which could consider other regions and time.
6. Conclusion
Innovations in financial technology are rapidly modifying the economies globally. Financial technology is changing conventional structures by expanding the financial products and services’ value chains to create efficient gains. This study investigates the relationship between financial technology and economic growth in the East African community by applying the ARDL technique. Panel co-integration test is performed with eight hypothesized co-integrating equations. The results unveil a significant relationship between financial technology and economic growth. This justifies that financial technology is vital to determine economic growth. The findings infer bidirectional causality between ATM and economic growth, with unidirectional causality flows from economic growth to POS and INB, MB and GEF to economic growth. The coefficient of ECT is negatively significant, signifying a long-run relationship between financial technology measures and economic growth. Moreover, a significant ECT infer a causal relationship between the series.
This implies that economic growth is strongly influenced by financial technology and vice versa. Theoretically, this study aligns the positive view of financial technology relating to economic growth and feedback. The results suggest that investments in financial technologies to boost economic growth in EAC states should be encouraged. Governments should effectively enact and implement policies that protect investments in financial technologies to boost economic growth. Various organizations should adopt and increase the usage of POSs devices, INB and mobile baking in their various economic activities. This study is restricted to the eight East African community states with secondary data from financial technology variables spanning from 1997 to 2019 based on the autoregressive distributed lag model. Future research is essential on financial innovation index, POSs, MB and economic development.

