


Serviços Personalizados
Journal

Artigo
 Inglês (pdf)
 Artigo em XML
 Referências do artigo
 Enviar este artigo por email
Indicadores
-
 Citado por SciELO
Links relacionados
-
 Similares em
SciELO
Similares em
SciELO
Compartilhar

 Permalink
Scientia Agropecuaria
versão impressa ISSN 2077-9917
Scientia Agropecuaria vol.8 no.2 Trujillo abr./jun. 2017
http://dx.doi.org/10.17268/sci.agropecu.2017.02.09
ARTÍCULOS ORIGINALES
Prediction of beef marbling using Hyperspectral Imaging (HSI) and Partial Least Squares Regression (PLSR)
Victor Aredo1; Lía Velásquez2; Raúl Siche3,*
1 Programa de pós-graduação em Engenharia de Alimentos. Faculdade de Zootecnia e Engenharia de Alimentos. Universidade de São Paulo, Av. Duque de Caxias Norte, 225, Pirassununga SP, Brazil.
2 Programa de pós-graduação em Engenharia e Ciência de Materiais. Faculdade de Zootecnia e Engenharia de Alimentos. Universidade de São Paulo, Av. Duque de Caxias Norte, 225, Pirassununga SP, Brazil.
3 Facultad de Ciencias Agropecuarias, Universidad Nacional de Trujillo. Av. Juan Pablo II s/n, Ciudad Universitaria, Trujillo, Peru.
Abstract
The aim of this study was to build a model to predict the beef marbling using HSI and Partial Least Squares Regression (PLSR). Totally 58 samples of longissmus dorsi muscle were scanned by a HSI system (400 - 1000 nm) in reflectance mode, using 44 samples to build the PLSR model and 14 samples to model validation. The Japanese Beef Marbling Standard (BMS) was used as reference by 15 middle-trained judges for the samples evaluation. The scores were assigned as continuous values and varied from 1.2 to 5.3 BMS. The PLSR model showed a high correlation coefficient in the prediction (r = 0.95), a low Standard Error of Calibration (SEC) of 0.2 BMS score, and a low Standard Error of Prediction (SEP) of 0.3 BMS score.
Keywords: hyperspectral image; marbling; partial least squares; prediction.
1. Introduction
Red meats are an important part in the daily diet of people, due to its great contribution of micronutrients (iron, zinc, selenium, potassium) and a range of Bvitamins including niacin, riboflavin, thiamine and vitamin B12 (McAfee et al., 2010; Wyness et al., 2011). In the meat industry, the quality of products is one of the main concerns because it is always demanded by consumers and is considered a key success factor (Wu and Sun, 2013).
In the assessment of meat, one of the sensory attributes that influence signify- cantly the consumer is the marbling. This attribute refers to the white flecks of intramuscular fat present in the meat and is associated with superior quality products when marbling is uniformly distributed (Xiong et al., 2014). Traditionally, evaluation of marbling is conducted by trained graders that estimates a score by comparing the proportion of intramuscular fat in the longissimus dorsi muscles with a reference standard (Liu et al., 2012; Yoshikawa et al., 2000). Therefore, in the last decades some researches about objecttive marbling assessment has been carried out for beef and pork (Shiranita et al., 2000; Yoshikawa et al., 2000; Toraichi et al., 2002; Jackman et al., 2008; Huang et al., 2012).
Hyperspectral imaging technology (HSI) has been considered as a promising tool for evaluation of food quality and safety (Siche et al., 2016). The combined of the images and spectroscopy, represented in a hyperspectral image, it provides physical and geometrical features from the sample under analysis (Elmasry et al., 2012a). In this sense, some researchers have applied HSI focused on the classification of marbling, obtaining good results (Qiao et al., 2007; Barbin et al., 2011; Velásquez et al., 2017). Nevertheless, few studies focused on prediction of marbling has been published (Li et al., 2011).
PLSR, a multivariate technique for HSI data were used with success to predict many quality attributes of meat as color, pH and tenderness (Elmasry et al., 2012b). Since marbling have a high relation with the presence of intramuscular fat (Kuchida et al., 2000), the PLSR can be used to predict it.
Therefore, the objective of this study was to exploit the potential of HSI and PLSR modeling in predicting beef marbling.
2. Material and methods
Sample preparation
A set of 58 samples of beef (longissimus dorsi muscle) of different quality were supplied by benefit center of Chachapoyas city (Amazonas, Peru) for this study. The samples were sectioned at 24 hours of post-mortem of the animal, coded, packed in HDPE bags and transported in a styrofoam box with ice (Elmasry et al., 2012b) to the Universidad Nacional Toribio Rodriguez de Mendoza de Amazonas. Then, the samples were frozen at -18 °C in a refrigerator-freezer (GNV301SLC, LG Electronics Corp, Indonesia) for 24 hours to subsequently be cut into 2 cm pieces using a slitter. Finally, the samples were thawed for 24 hours at 2 °C (Elmasry et al., 2013) and randomly grouped in two sets (a "calibration set" integrated by 44 samples to build the model and a "prediction set" integrated for 14 samples for the external validation of the model) to be scanned by the hyperspectral imaging system.
Marbling score evaluation
The marbling evaluation was carried with 15 semi-trained judges, all of them postgraduate students from the Faculty of Animal Science and Food Engineering of the University of São Paulo (Brazil). The evaluation consisted in the comparison of photographs of the samples with the beef marbling standard (BMS) of Japan Meat Grading Association (JMGA, 2000), which classify the BMS in 12 standards. The scores were assigned as continuous values to reach a best accuracy in the evaluation of the samples. These scores were used as reference to build the model PLSR for predicting BMS score.
Hyperspectral image acquiring system
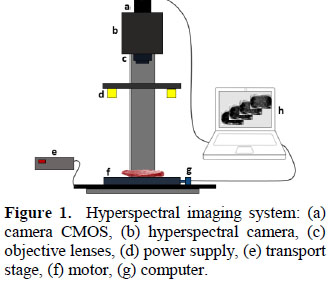
A hyperspectral imaging system with pushbroom approach in reflectance mode was used. As shown in Figure 1, the system comprises a hyperspectral imaging camera (Pica XC, Resonon Inc., USA) with camera CMOS (GX 1660, Allied- Vision Technology, Canada) and objective lenses (Xenoplan 1.4/23, SchneiderKreuznach, Germany); a lighting mounting (Resonon Inc., USA) with lamps in angle of 45° (3GD0, Solux, Japan) and power supply (SEC 1223CE, Samlex America, Taiwan); a transport stage (LPS-12-20, Servo Systems Co., USA), with motor (DMX-J-SA-17, Arcus Technology Inc., USA); an acquisition and data processing software (SpectrononPRO, Resonon Inc., USA) and a laptop with Windows 7 Intel inside CORE i7 (ThinkPad, Lenovo, USA). The system acquires hyperspectral imaging in a spectral range of 400-1000 nm with a maximal spectral resolution of 2.5 nm. Each sample was placed on the stage and transported to the field of view of the camera with a speed optimized of 0.5 cm/s to be scanned line by line. The spectral acquisition resolution was 8 nm (75 spectral bands).
ROI selection and mean spectrum
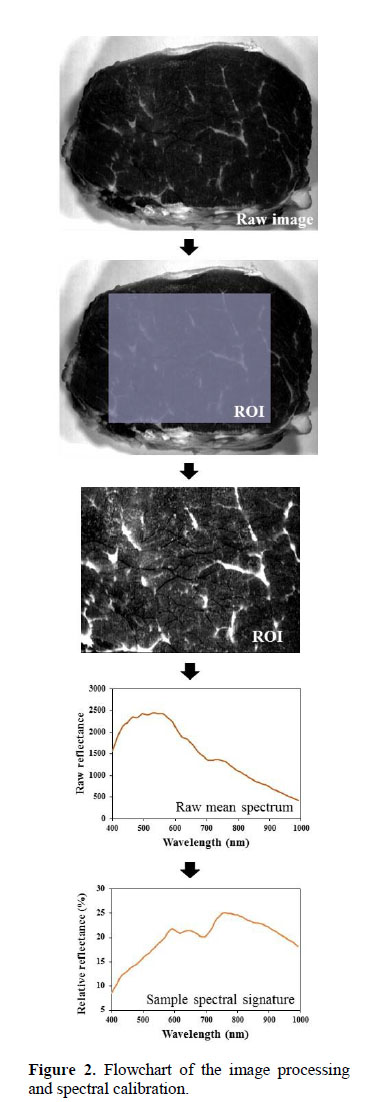
The region of interest (ROI) was selected using a "select rectangle" tool to delimit an area with only useful information of the sample. The ROI was composed of 60% of pixel number of each dimension (length and width) and was located at the center of the original raw image. This tool was more simple and practical than selection of spectrally similar pixels, masking and thresholding since that the sample surface is flat without dispersion of the incident light, present irrelevant elements for the marbling evaluation (external fat and muscular membrane) at the muscle edge, and haven’t saturated reflectance pixels in the images (Figure 2). The ROI selection was performed in raw imagens for increasing the speed in a possible automatized process. Thus, in the ROI of each sample was applied a "mean spectrum" tool to obtain the raw mean spectrum. Both of tools belong to the software Spectronon Pro (Resonon Inc., USA).
Reflectance correction
The mean reflectance of each sample is in fact the reflectance detected by the sensor. Therefore, the reflectance correction of the raw mean spectrum was necessary, and it was performed using two imagens: A dark image acquired to correct the effect of dark current of the camera, and a white image acquired to consider the maximal reflectance in the area of shooting. Both images were acquired under the same setting conditions that the samples images. With these images a corrected reflectance or relative reflectance (R) that corresponds to spectral signature of the sample was calculated, according to: R = (R0 – B) ∙ 100 / (W – B); where: R0 is the raw mean spectrum of the sample, B is the mean reflectance of the dark image (~ 0% reflectance) acquired with the light off and the camera lens completely covered by the cap, and W is the mean reflectance of the white image acquired from a white surface of Teflon material (Resonon Inc, USA) (~99.9% reflectance).
Partial Least Squares Regression (PLSR) modelling
PLSR is a statistical procedure applied in high-dimensional and collinear data predictors as spectral data. This regression reduces the original number of descriptors to a new dataset based on a few orthogonal factors called latent variables (LV). The number of LV were optimized using the minimum value of Mean Squared Error of Prediction (MSEP) to avoid underfitting or overfitting of the models. The model is represented by: Y = X∙b + e; where Y is the response matrix (44 samples of the calibration set x 1) of the BMS (beef marbling standard) score, X is the set of predictors data or matrix spectral data (44 samples of the calibration set × 75 wavelengths), "b" is the matrix of regression coefficients (75 coefficients x 1), "e" is the residual information matrix that is not explained by the LV.
The external validation was carried out using the PLSR model to predict the BMS score of 14 samples (prediction set) that not were used for the build of the model. The statistical parameters used to evaluate the PLSR model were the following: calibration correlation coefficient "rc", standard error of calibration (SEC), prediction correlation coefficient "rp", and standard error of prediction (SEP). The PLSR modelling was performed in Matlab (MathWorks, Inc. USA).
3. Results and discussion
Samples reflectance
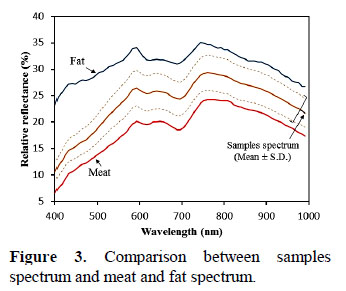
Spectrum or spectral signature of the samples varied between typical fat and meat spectrums (Figure 3). A muscle image is composed for two types of pixels (meat pixels and fat pixels) and the marbling score is based on the presence of fat in the muscle. Thus, the spectral signature of the samples has useful information to be correlated with the marbling score assigned by the judges (1.2 5.3 BMS).
PLSR modelling
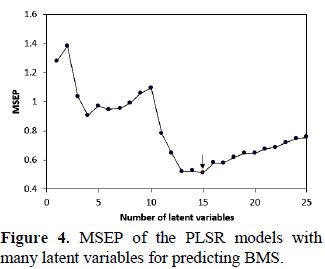
The critical step for the PLSR modelling is the selection of the number of latent variables. In this work, using as reference the minimal MSEP, it was determinate that with 15 latent variables (Figure 4) is possible built an optimal PLSR model without overfitting and underfitting.
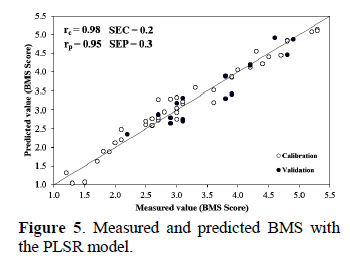
The PLSR model showed in the calibration a high correlation coefficient (r = 0.98) and a low Standard Error of Calibration (SEC) of 0.2 BMS, and in the validation the model showed a good prediction (r = 0.95) and a Standard Error of Prediction (SEP) of 0.3 BMS (Figure 5). The success of the model could be explained by the quality of the spectral information obtained from the selection of region of interest (ROI), according to Qiao et al. (2007) this step is critical and has profound impact on the performance of prediction models.
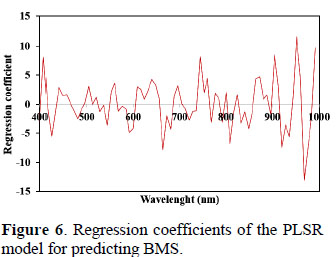
Some works of prediction of marbling by HSI has been reported. In this way, Li et al. (2011) evaluated beef marbling in a spectral region of 400 – 1100 nm, and selected images at 530 nm for extract three characteristic parameters (large-particle fat area, medium–particle fat area and smallparticle fat area) with the aim of establish a Multiple Linear Regression (MLR) model, which obtained a coefficient of determination (R2) of 0.92 and Standard Error of Cross Validation (SECV) of 0.45. Liu et al (2012) evaluated pork marbling in a spectral region of 400 – 1000 nm, in this work the marbling standards and the marbling samples were regarded as line patterns extracted by the wide line detector and expressed as proportion of marblings (PM). Based on the PM of marbling standards in RGB channels was developed a MLR model, which obtained an adjusted coefficient of determination (R2) of 0.9992 and a root mean square error of leave-oneout cross-validation (RMSECV) of 0.0938. As result it can affirm that the PLSR model developed is reliable and the proceeding is more practical that other works, and advantageous for the easily for recalibration and implement for meat industries. Hyperspectral data have high dimensionality and collinearity due to the correlation between adjacent variables (wavelengths), these defects can be reduced retiring the wavelengths that no have important information (Liu et al., 2014). In this sense, a criterion usually utilized is selection the wavelengths with the regression coefficients of highest absolute value. As can be observed in the Figure 6, the majority of the wavelengths had a high influence in the model, making very difficult the effective data reduction. An influent factor was the low spectral resolution (8 nm) used in this work, apparently in each 8 nm was obtained relevant spectral information.
In future works is recommend explore a superior spectral resolution, for a probable effective identification of influent wavelengths in the prediction of marbling. For an application in another geographic location is important the recalibration of the model to embrace the typical variation of the BMS score of the samples.
4. Conclusions
A Partial Least Squares Regression (PLSR) model was built to predict beef marbling using hyperspectral images of longissimus dorsi muscle and scores of a traditional evaluation expressed as continuous values (from1.2 to 5.3) based on Beef Marbling Japanese Standard.
The PLSR model utilized the full spectrum (400 1000nm) with resolution of 8 nm. This model was not simplified due to that the most of wavelengths shown influence in the prediction. The model calibration showed a high correlation coefficient (r = 0.98) and a low Standard Error of Calibration (SEC) of 0.2 BMS, and the model validation showed a good prediction (r = 0.95) and a Standard Error of Prediction (SEP) of 0.3 BMS.
In future work, spectral resolutions greater than 1000 nm should be explored for a probable effective identification of influent wavelengths in the prediction of marbling.
Acknowledgement
Victor Aredo and Lía Velásquez thanks the "Ministerio de Educación del Perú" for the scholarship support by the program "Programa Nacional de Becas y Crédito Educativo" (PRONABEC). Raúl Siche thanks the following institutions for funding: Programa Nacional de Innovación para la Competitividad y Productividad Innóvate Perú – Ex-FINCyT (Contract 407-PNICP-PIAP-2014) and Universidad Nacional de Trujillo UNT (PIC2-2013 / UNT).
References
Barbin, D. F.; Elmasry, G.; Sun, D-W; Allen, P. 2012. Near-infrared hyperspectral imaging for grading and classification of pork. Meat Science 90(1): 259–268. [ Links ]
Elmasry, G.; Kamruzzaman, M.; Sun, D-W; Allen, P. 2012a. Principles and Applications of Hyperspectral Imaging in Quality Evaluation of Agro-Food Products: A Review. Critical Reviews in Food Science and Nutrition 52(11): 999-1023. [ Links ]
Elmasry, G.; Sun, D-W; Allen, P. 2013. Chemical-free assessment and mapping of major constituents in beef using hyperspectral imaging Journal of Food Engineering 117: 235–246. [ Links ]
Elmasry, G.; Sun, D-W; Allen, P. 2012b. Near-infrared hyperspectral imaging for predicting colour, pH and tenderness of fresh beef. Journal of Food Engineering 110: 127–140 [ Links ]
Huang, H.; Liu, L.; Ngadi, M.O.; Gariépy, C. 2013. Prediction of pork marbling scores using pattern analysis techniques. Food Control 31(1): 224-229. [ Links ]
Jackman, P.; Sun, D-W; Du, C-J; Allen, P.; Downey, G. 2008. Prediction of beef eating quality from colour, marbling and wavelet texture features. Meat Science 80: 1273–1281. [ Links ]
JMGA (Japan Meat Grading Association). 2000. Beef Carcass Grading Standards. Tokyo. Japan. http://wagyu.org/uploads/page/JMGA%20Meat%20Grading%20Brochure_english.pdf [ Links ]
Kuchida, K.; Kono, S.; Konishi, K.; Van Vleck, L.D.; Suzuki, M.; Miyoshi, S. 2000. Prediction of crude fat content of longissimus muscle of beef using the ratio of fat area calculated from computer image analysis: comparison of regression equations for prediction using different input devices at different stations. Journal of Animal Science 78(4): 799-803. [ Links ]
Li, Y.; Shan, J.; Peng, Y.; Gao, X. 2011. Nondestructive assessment of beef-marbling grade using hyperspectral imaging technology. In New Technology of Agricultural Engineering (ICAE) International Conference on (779-783) [ Links ].
Liu, L.; Ngadia, M.O.; Prashera, S.O.; Gariépy, C. 2012. Objective determination of pork marbling scores using the wide line detector. Journal of Food Engineering 110(3): 497–504. [ Links ]
Mcafee, A.J.; Mcsorley, E.M.; Cuskelly, G.J.; Moss, B.W.; Wallace, J.M.; Bonham, M.P.; Fearon, A.M. 2010. Red meat consumption: an overview of the risks and benefits. Meat Science 84(1): 1–13. [ Links ]
Qiao, J.; Ngadi, M.O.; Wang, N.; Gariépy, C.; Prasher, S. 2007. Pork quality and marbling level assessment using a hyperspectral imaging system. Journal of Food Engineering 83(1): 10–16. [ Links ]
Shiranita, K.; Hayashi, K.; Otsubo, A.; Miyajima, T.; Takiyama, R. 2000. Grading meat quality by image processing. Pattern Recognition 33: 97-104. [ Links ]
Siche, R.; Vejarano, R.; Aredo, V.; Velasquez, L.; Saldaña, E.; Quevedo, R. 2016. Evaluation of Food Quality and Safety with Hyperspectral Imaging (HSI). Food Engineering Reviews 8: 306-322. [ Links ]
Toraichi, K.; Kwan, P.; Katagishi, K.; Sugiyama, T.; Wada, K.; Mitsumoto, M. 2002. On a fluency image coding system for beef marbling evaluation. Pattern Recognition Letters 23: 1277–1291. [ Links ]
Velásquez, L.; Cruz-Tirado, J.P.; Siche, R.; Quevedo, R. 2017. An application based on the decision tree to classify the marbling of beef by hyperspectral imaging. Meat Science 133: 43-50. [ Links ]
Wu, D.; Sun, D-W. 2013. Advanced applications of hyperspectral imaging technology for food quality and safety analysis and assessment: A review — Part II: Applications. Innovative Food Science and Emerging Technologies 19: 15–28. [ Links ]
Wyness, L.; Weichselbaum, E.; O'Connor, A.; Williams, E. B.; Benelam, B.; Riley, H.; Stanner, S. 2011. Red meat in the diet: An update. British Nutrition Foundation Nutrition Bulletin 36: 34–77. [ Links ]
Xiong, Z.; Sun, D-W.; Zeng, X-A.; Xie, A. 2014. Recent developments of hyperspectral imaging systems and their applications in detecting quality attributes of red meats: A review. Journal of Food Engineering 132: 1–13. [ Links ]
Yoshikawa, F.; Toraichi, K.; Wada, K.; Ostu, N.; Nakai, H.; Mitsumoto, M.; Katagishi, K. 2000. On a grading system for beef marbling. Pattern Recognition Letters 21: 1037-1050. [ Links ]
Corresponding author
E-mail: rsiche@unitru.edu.pe (R. Siche)
Received December 07, 2016.
Accepted May 08, 2017.
