


Servicios Personalizados
Revista

Articulo
 Español (pdf)
 Articulo en XML
 Referencias del artículo
 Enviar articulo por email
Indicadores
-
 Citado por SciELO
Links relacionados
-
 Similares en
SciELO
Similares en
SciELO
Compartir

 Permalink
Scientia Agropecuaria
versión impresa ISSN 2077-9917
Scientia Agropecuaria vol.9 no.1 Trujillo ene./mar. 2018
http://dx.doi.org/10.17268/sci.agropecu.2018.01.17
SHORT COMMUNICATION
Determination of gibberellic acid in a commercial seaweed extract by capillary electrophoresis
María Quijano-Avilés1,*; Wendy Gavica2; Ana Barragán1; Patricia Manzano1,3
1 ESPOL Polytechnic University, Escuela Superior Politécnica del Litoral, ESPOL, Centro de Investigaciones Biotecnológicas del Ecuador (CIBE), Campus Gustavo Galindo km 30.5 Vía Perimetral, P.O. Box 09-01-5863, Guayaquil, Ecuador.
2 Universidad de Guayaquil, UG, Facultad de Ciencias Químicas (FCQ), Cdla. Universitaria Salvador Allende Malecón del Salado entre Av. Delta y Av. Kennedy, P.O. Box 09-06-13, Guayaquil, Ecuador.
3 ESPOL Polytechnic University, Escuela Superior Politécnica del Litoral, ESPOL, Facultad de Ciencias de la Vida (FCV). Campus Gustavo Galindo, km. 30.5 vía Perimetral. P.O. Box 09-01-5863, Guayaquil, Ecuador.
Abstract
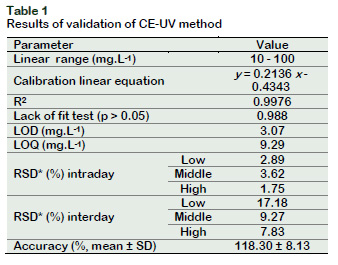
Gibberellic acid (GA3) is an important plant growth regulator used in agriculture. This work has developed and validated a simple method for the quantification of GA3 in a seaweed extract product using capillary electrophoresis with direct UV detection. A fused-silica capillary of 50 µm inner diameter and 30 cm of effective length with extended light path, 50 mmol.L-1 of borate buffer as background electrolyte solution (pH 9.11), voltage of +30kV applying hydrodynamic injection of 50 mbar for 5 s and length detection of 200 nm were employed. The method was validated according to the International Conference Harmonisation guidelines. Satisfactory results in the range of 10 – 100 mg.L-1 were obtained for precision (RSD below 3.62%), linearity (R2: 0.9976, lack of fit test p > 0.05), specificity and accuracy for which the limit of detection and quantitation were 3.07 and 9.29 mg.L-1, respectively. The results indicate that the method is suitable for implementation in agroindustry in order to assure the quality control of GA3 of seaweed products.
Keywords: Algae extract; gibberellin; phytohormone, uv-vis, validation.
1. Introduction
Gibberellic acid (GA3) is a class of phytohormone that plays a major role in plant growth and development (Ge et al., 2007). GA3 has been used to improve fruit quality of sweet cherry cultivars, peaches, increase phenolic content in globe artichoke and prolong shelf life of apples (Ozkan et al., 2016) (Dagar et al., 2012) (Sharaf-Eldin et al., 2007) (Krishna et al., 2012).
Seaweeds (macroalgae) are an important source of GA3 and they are found commercially as extracts of brown and red algae and are used as a replacement of chemical fertilizers (Ghosh et al., 2015).
Traditional techniques employed for the determination of GA3 include high performance liquid chromatography (HPLC), gas chromatography (GC), spectrophotometry and thin layer chromatography (TLC) (Nhujak et al., 2005).
Capillary electrophoresis (CE) has appeared as an alternative technique to HPLC that allows developing fast methods with a low quantity of sample, solvent and reagents (Le et al., 2017). CE has been employed to identify GA3 in flowers, soybean and citrus callus (Liu et al., 2002a) (Zhu et al., 2013) (Assunção et al., 2009). However, CE-UV direct method has not been previously reported for determination of GA3 from commercial seaweed extract. The aim of this work is to develop and validate a direct method for the quantifycation of GA3 in a commercial seaweed extract using CE-UV and demonstrate the applicability of this technique in agricultural analytical laboratories.
2. Material and methods
Reagents and chemicals
HPLC grade methanol (J.T.Baker, USA), boric acid (J.T.Baker, USA), sodium hydroxide p.a (J.T. Baker, USA) and hydrochloric acid (J.T.Baker, USA) were used. Water was purified using a Milli-Q system (Milipore, USA). Gibberellic acid (GA3) was purchased from Sigma-Aldrich and the stock standard solution was prepared in HPLC grade methanol. All solutions were filtered through a 0.2 µm pore size filter (Agilent Technologies, Germany) and treated with ultrasound at a frequency of 35 kHz (VWR® Ultrasonic Cleaners, Radnor, PA) to remove air bubbles.
Apparatus
The experiment was performed using a capillary electrophoresis system (Agilent Technologies 7100, Germany) equipped with a diode array detector (DAD). A fusedsilica capillary of 50 µm inner diameter and 30 cm of effective length with extended light path (Polymicro TechnologiesTM, USA) was used. Temperature control system was adjusted at 25 ºC, voltage of +30kV applying hydrodynamic injection of 50 mbar for 5 s and length detection was set at 200 nm. Agilent ChemStation® software was used to calculate peak integration and purity ratio. New capillary was activated and conditioned with ultra-pure water for 2 min, followed by 5 min of HPLC methanol, 5 min 0.1 M HCl, 5 min 0.1 M NaOH. Between each step ultra-pure water wash was applied by 2 min. Finally the capillary was washed with background electrolyte (BGE) solution (50 mmol.L-1 of borate buffer, pH 9.11) for 8 min. At the beginning of each working day the capillary was flushed with 0.1 M NaOH for 10 min, followed by ultra-pure water for 20 min and BGE solution for 10 min, then two blank samples were injected in order to stabilize the cassette temperature. Preconditioning and postconditioning steps were programmed between each run. 0.1 M NaOH for 2 min, ultra-pure water for 3 min and BGE solution for 5 min was set as preconditioning; meanwhile, ultra-pure water for 2 min and BGE solution for 8 min was applied as postconditioning step.
Sample preparation
Commercial seaweed extract (growth regulator containing liquid gibberellic acid and algae extract) was used for the experiment. The sample was appropriately dilute and filtered through a 0.20 µm membrane before injection and analyzed in triplicate.
Method validation
Validation procedure was carried out according to the ICH (International Conference Harmonisation) guidelines (ICH, 2013). Linearity, limits of detection and quantification, repeatability, specificity and accuracy were the parameters validated.
3. Results and discussion
Optimization of CE parameters
Preliminary experiments demonstrated that buffer conditions at 50 mmol.L-1 of borate buffer, pH 9.11 gave the best results for separation of compounds. Voltage effect was studied for method development. Different voltage values were evaluated in a range of +20 to +30 kV applying hydrodynamic injection of 50 mbar in an interval of 5 to 25 s. High voltage value decreased time of migration. However, a combination of high voltage with high time of injection caused capillary break. In order to work with shorter times, voltage of +30 kV was selected considering a hydrodynamic injection of 50 mbar during 5 s and changing buffer solution after three runs.
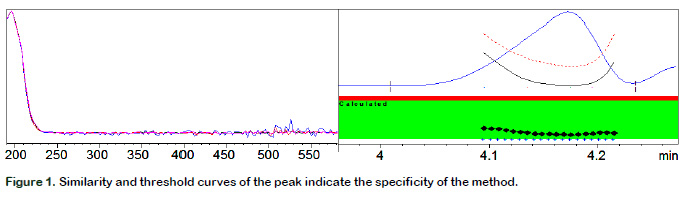
Specificity
Purity ratio was calculated to determinate specificity in spiked samples. Figure 1 shows the similarity and threshold curves of the peak. Purity ratio values were below 1, displayed in the green band, which indicated that the spectral peak is pure and consist of a single compound and no additional procedure was necessary to identify the analyte because no interference was caused by the matrix.
Precision
Repeatability (intraday values) was calculated by triplicated using three different concentration levels of standard solutions (low, medium and high). This procedure was repeated for three consecutive days to determinate the intermediate precision.
Repeatability and intermediate precision were expressed as relative standard deviation (RDS). Table 1 shows RSD intraday values below to 4%, while RSD values for intermediate precision increased up to 17.17% for the lowest concentration.
Accuracy
This parameter was assessed by spiking a blank sample matrix with a known concentration of a standard solution using nine determinations. Results show a percentage of recovery less than 120% (Table 1), which indicates a good accuracy rate of the method (Della-Betta et al., 2014).
Linearity, LOD and LOQ
Calibration curve constructed by five points and lack of fit test were performed to evaluate the linearity of the method. The linear model proposed in Table 1 satisfies the lack of fit test for linearity (p > 0.05) (Araujo, 2009) and shows a coefficient of determination near to 1. LOD and LOQ were calculated by signal-to-noise ratio of 3 and 10 respectively, and considering the slope of the calibration curve and the standard deviation of the blank. LOD value is adequate to quantified GA in seaweed extract because this value is lower than the normal concentration reported on this kind of product.
Range
Linear range of the method was set to 10 to 100 mg.L-1. At this interval, the method is able to quantify the analyte with precision, accuracy and linearity.
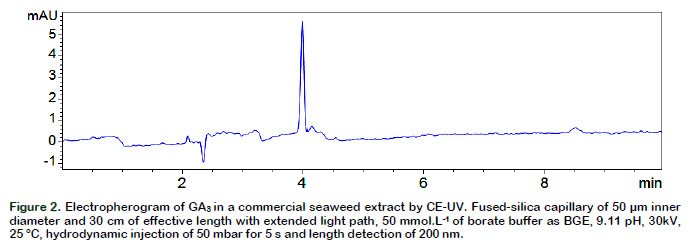
The method for the analysis of GA3 allowed identifying this compound in commercial seaweed extract (Figure 2). The detection of the compound was performed in less of 5 min using UV detection and no derivatization step was needed. According to the literature, GA3 can be detected at 5 minutes by CE but with an additional step that involves 6-Oxy-(acetyl piperazine) fluorescein derivatization (Chen et al., 2011). Micellar electrokinetic capillary
MS method takes about of 25 min to separate 11 GA compounds (Ge et al., 2007). On the other hand, a membranesupported liquid–liquid–liquid micro-extraction coupled to CE-UV presents a higher sensitive but an equal time of process to the method proposed in this research (Huang et al., 2014). These findings suggest that the method developed is suitable for quality control of GA3 during the manufacturing process.
4. Conclusions
An efficient method was developed using CE-UV instrument for quantification of GA3 in commercial seaweed extract. Sample pretreatment step is not required to identify the compound with makes the analysis fast, cheap and environmentally friendly. This method represents an economical alternative for industry to ensure quality control of seaweed extract products.
Acknowledgements
Financial support from Escuela Superior Politécnica del Litoral.
References
Araujo, P. 2009. Key aspects of analytical method validation and linearity evaluation. Journal of Chromatography B 877: 2224–2234. [ Links ]
Assunção, N.; Arruda, S.C; Martinelli, A.P.; Carrilho, E. 2009. Direct determination of plant-growth related metabolites by capillary electrophoresis with spectrophotometric UV detection. Journal of the Brazilian Chemical Society 20: 183–187. [ Links ]
Chen, H.; Guo, X.F.; Zhang, H.S.; Wang, H. 2011. Simultaneous determination of phytohormones containing carboxyl in crude extracts of fruit samples based on chemical derivatization by capillary electrophoresis with laser-induced fluorescence detection. Journal of Chromatography B 879: 1802–1808. [ Links ]
Dagar, A.; Weksler, A.; Friedman, H.; Lurie, S. 2012. Gibberellic acid (GA3) application at the end of pit ripening: Effect on ripening and storage of two harvests of "September Snow" peach. Scientia Horticulturae 140: 125–130. [ Links ]
Della-Betta, F.; Vitali, L.; Fett, R.; Costa, A. C. O. 2014. Development and validation of a sub-minute capillary zone electrophoresis method for determination of nitrate and nitrite in baby foods. Talanta 122: 23–29. [ Links ]
Ge, L.; Peh, C.Y.C.; Yong, J.W.H.; Tan, S.N.; Hua, L.; Ong, E.S. 2007. Analyses of gibberellins by capillary electrophoresis–mass spectrometry combined with solid-phase extraction. Journal of Chromatography A 1159: 242–249. [ Links ]
Ghosh, A.; Vijay-Anand, K.G.; Seth, A. 2015. Life cycle impact assessment of seaweed based biostimulant production from onshore cultivated Kappaphycus alvarezii (Doty) Doty ex Silva—Is it environmentally sustainable? Algal Research 12: 513–521. [ Links ]
Huang, L.; He, M.; Chen, B.; Hu, B. 2014. Membranesupported liquid–liquid–liquid microextraction combined with anion-selective exhaustive injection capillary electrophoresis-ultraviolet detection for sensitive analysis of phytohormones. Journal of Chromatography A 1343: 10–17. [ Links ]
Krishna, H.; Das, B.; Attri, B.L.; Kumar, A.; Ahmed, N.; Krishna, H. 2012. Interaction between different preand postharvest treatments on shelf life extension of "Oregon Spur" apple. Fruits 67(671): 31–40. [ Links ]
Le, T.H.H.; Nguyen, T.Q.H.; Tran, C.S.; Vu, T.T.; Nguyen, T.L.; Cao, V.H.; Mai, T.D. 2017. Screening determination of food additives using capillary electrophoresis coupled with contactless conductivity detection: A case study in Vietnam. Food Control 77: 281–289. [ Links ]
Liu, B.-F.; Zhong, X.-H.; Lu, Y.-T. 2002. Analysis of plant hormones in tobacco flowers by micellar electrokinetic capillary chromatography coupled with online large volume sample stacking. Journal of Chromatography A 945: 257–265. [ Links ]
Nhujak, T.; Srisa-art, M.; Kalampakorn, K.; Tolieng, V.; Petsom, A. 2005. Determination of Gibberellic Acid in Fermentation Broth and Commercial Products by Micellar Electrokinetic Chromatography. Journal of Agricultural and Food Chemistry 53: 1884–1889. [ Links ]
Ozkan, Y.; Ucar, M.; Yildiz, K.; Ozturk, B. 2016. Preharvest gibberellic acid (GA 3) treatments play an important role on bioactive compounds and fruit quality of sweet cherry cultivars. Scientia Horticulturae 211: 358–362. [ Links ]
Sharaf-Eldin, M.A.; Schnitzler, W.H.; Nitz, G.; Razin, A.M.; El-Oksh, I. I. 2007. The effect of gibberellic acid (GA3) on some phenolic substances in globe artichoke (Cynara cardunculus var. scolymus (L.) Fiori). Scientia Horticulturae, 111: 326–329. [ Links ]
Zhu, G.; Long, S.; Sun, H.; Luo, W.; Li, X.; Hao, Z. 2013. Determination of gibberellins in soybean using tertiary amine labeling and capillary electrophoresis coupled with electrochemiluminescence detection. Journal of Chromatography B 941: 62–68. [ Links ]
* Corresponding author
E-mail: mquijano@espol.edu.ec (M. Quijano-Avilés).
Received August 10, 2017.
Accepted January 30, 2018.

