


Serviços Personalizados
Journal

Artigo
 Inglês (pdf)
 Artigo em XML
 Referências do artigo
 Enviar este artigo por email
Indicadores
-
 Citado por SciELO
Links relacionados
-
 Similares em
SciELO
Similares em
SciELO
Compartilhar

 Permalink
Scientia Agropecuaria
versão impressa ISSN 2077-9917
Scientia Agropecuaria vol.10 no.1 Trujillo jan./mar. 2019
http://dx.doi.org/10.17268/sci.agropecu.2018.01.16
REVIEW
Trends in application of NIR and hyperspectral imaging for food authentication
Jeffrey Mendez 1; Liz Mendoza 1; J. P. Cruz-Tirado 2 ORCID iD https://orcid.org/0000-0002-1963-4965; Roberto Quevedo 3 ORCID iD http://orcid.org/0000-0001-8132-838X; Raúl Siche 1,* ORCID iDhttps://orcid.org/0000-0003-3500-4928
1 Facultad de Ciencias Agropecuarias, Universidad Nacional de Trujillo, Av. Juan Pablo II s/n. Ciudad Universitaria, Trujillo, Perú.
2 Department of Food Engineering, University of Campinas, Brazil.
3 Departamento de Acuicultura y Recursos Agroalimentarios, Programa FITOGEN, Universidad de Los Lagos, Av. Fuchslocher 1305, Osorno, Chile.
Abstract
Food fraud can cause damage to consumer health and affect their confidence, destroy brands and generate large economic losses in the industry. Food authenticity allows to identify if food composition, geographical origin, genetic variety and farming system corresponds to what has been declared on the label. Although there are currently standardized methods to identify certain adulterants, the complexity of the food, the complexity of the supply chain and the appearance of new adulteran ts require the continuous development of analytical techniques to detect food fraud. NIR and Hyperspectral imaging (HSI) in tandem with chemometrics are non-destructive, non-invasive and accurate techniques for food authentication. This review focuses on N IR and HIS approaches to food authentication, including adulteration by substitution, geographical origin and farming system. In this context, the advances in NIR and HSI approaches reported since 2014 are discussed regarding their potential use in food authentication. Both techniques have shown to have efficiency, precision and selectivity to detect adulterants and identify geographic origin, genetic variety and farming system. Portability and remote access are shown as the next step for the industrializat ion of NIR and HSI devices.
Keywords: food fraud; spectroscopy; discrimination; regression.
1. Introduction
Food authentication has become a growing need throughout the world. Food authentication is aimed at detecting food fraud, which is an illegal action carried out for economic purposes through the adulteration of a food or false information on the label (Barreto et al., 2018; Danezis et al., 2016). This may include genetic variety, geographical origin, processing technology and food composition (Esteki et al., 2018). Also, food authentication is important because food fraud sometimes has unfortunate consequences, for instance, the adulteration of milk powder reported in China in 2008 (Gossner et al., 2009), which caused the death of six children and the hospitalization of thousands of others (Branigan, 2008). Cases of food fraud cause, in addition to mistrust in the consumer, large economic losses to companies or governments, destroying brands and devaluing the market value of the affected products. For instance, during the pork crisis in Ireland due to dioxin contamination, 1800 jobs were lost, and the cost was estimated at US$138 million (Kennedy et al., 2009), while it is estimated that the adulteration of olive oil with hazelnut oil causes a loss of 4 million euros per year for the European Union (Ozen and Mauer, 2002).
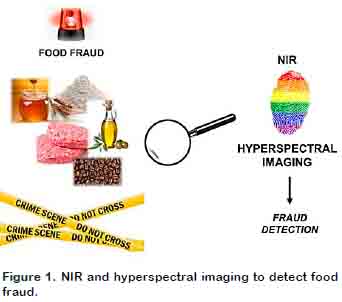
In order to identify food fraud in food, various techniques have been developed using sophisticated and efficient technolo- gies, which includes chromatographic methods (Esteki et al., 2018), proteomics, metabolomics and genomics-based methods (Böhme et al., 2019; Ortea et al., 2016) and spectroscopy techniques (Abbas et al., 2018). This last group includes techniques such as near-infrared spectros-copy (NIR), hyperspectral imaging (HIS), Fourier-transform infrared spectroscopy (FT-IR) and Raman (Figure 1).
NIR is based on the absorption of electromagnetic radiation (light) in a wavelength range between 780 - 2500 nm (Esteki et al., 2018). Each food presents a characteristic spectrum, a fingerprint that allows its identification and differentiation (Barbin et al., 2015). Variations in the absorption of radiation at each wavelength are related to the chemical composition of the food (Rady and Adedeji, 2018). There- fore, factors such as the crop/process conditions, geographical origin, variety or genotype that affect the chemical composition of foods are related with different levels of absorption of radiation at a certain wavelength (Cozzolino, 2016). This allows us, with the help of supervised and unsupervised chemometric methods, to differentiate and classify a wide variety of foods based on the NIR spectral information.
On the other hand, for certain food analysis cases, NIR has not allowed to achieve the expected efficiency, mainly because it is a punctual technique. Hyperspectral imaging (HIS) is a variation of NIR (NIR-HIS), which combines the spectral information obtained from the absorption of the radiation with the spatial information obtained from the image (Kamruzzaman et al., 2016). NIR-HIS provides a greater amount of information than NIR, so one of the key approaches for its possible industrial application is the variable selection and the creation of multispectral models that spend less processing time.
This review shows a summary of the most recent applications of NIR and NIR-HIS for food authentication, which includes: geo- graphical origin, genotype, genetic variety and adulteration by addition/substitution.
2. Recent applications of NIR and NIR-HIS for food authentication
2.1 Vegetable oil
Vegetable oils are one of the foods most susceptible to adulteration, both by addition and by false information regarding their geographical origin (Table 1). For instance, The Rapid Alert System for Food and Feed (RASFF) exposed a food fraud case in sunflower oil with high levels of mineral oil on 23 April 2008 (Picouet et al., 2018). This led to Picouet et al. (2018) to develop a technique to detect "at-line" mineral oil in sunflower oil, using a portable NIR coupled with a reflection probe, coupled with an immersion probe and a prototype of a multichannel Quasi Imaging Visible NIR spectrometer coupled to an immersion probe. The prototype has been useful to detect adulteration at levels above 2.5%. However, portable NIR coupled to reflection probe to be more efficient (R2cal better than 0.99), achieving pure samples of sunflower oil with a probability of 98.5%, and samples adulterated with mineral oil with a probability of 95%. Nevertheless, the authors conclude that detection of adulterated samples below 0.5% is difficult using NIR, therefore, chromatographic techniques should be use to confirm the fraud.
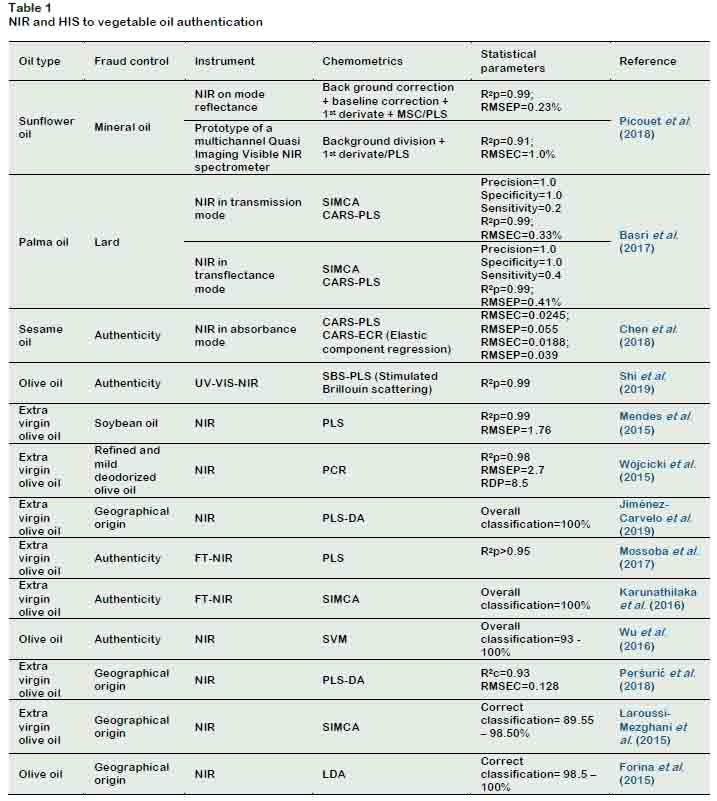
On the other hand, NIR in transmission and transflectance modes combined with SIMCA classifier allowed detect lard in palm oil with accuracy > 0.95 (Basri et al., 2017). Also, the quantitative analyses were performed by PLS coupled with variable selection based on cumulative adaptive reweighted sampling (CARS) (Li et al., 2009). CARS allowed identify important wavelength interacted with the fat and oil chemical structure, being used for building robust prediction model (R2p > 0.99). CARS- PLS and CARS-ECR (elastic component regression) also showed good results for identify adulterated samples of sesame oil with different oil (see Table 1) (Chen et al., 2018). Therefore, this selection variable method should be tested in other oil type with different adulterants or different geographical origin.
One of the vegetable oils with the highest risk of adulteration is olive oil (van Ruth et al., 2018) established that after the spice supply chain, the olive oil supply chain is the most susceptible to food fraud, mainly related on fraud factors of (1) fraud detectability in raw material and (2) fraud detectability in final product, (3) historical evidence of fraud, (4) valuable components or attributes and (5) level of competition branch of industry. For this reason, NIR spectroscopy has been a useful tool for the detection of olive oil adulteration. Azizian et al. (2016) developed PLS models using information from the FT-NIR to predict the content of various compositional parame- ters of olive oil and relate it to its authenticity. From 66 samples, 50 from California (USA), 15 from different European countries and 1 from Spain, only 23 met the authenticity requirements. FT- NIR allowed in less than 5 min time to identify the samples and assign them to different groups based on their compo- sition. Similar results were found to detect extra-virgin olive oil adulterated with edible oils using FT-NIR spectral data combined with SIMCA classifier (Karunathilaka et al., 2016) and for olive oil blended with edible oil using NIR coupled by SVM (Wu et al., 2016). Also, NIR was very efficient to detect soybean oil (Mendes et al., 2015), different edible oils (Mossoba et al., 2017) and refined and mild deodorized olive oils (Wójcicki et al., 2015) in extra-virgin olive oil.
In contrast, UV-VIS-NIR (in wavelengths 670 and 455 nm) combined with stimulated Brillouin scattering (SBS) achieved to detect olive oil adulteration (Shi et al., 2019). SBS is an inelastic dispersion process that is presented by the fluctuation of the density of the acoustic sources in the medium, which allows to relate it to the properties of the density and refractive index (Shi et al., 2012). These olive oil properties change with adulteration with other oils, and can be used as an efficient method to separate between pure and adulterated samples. The method must be extended for analysis of oils of species with a high index of polyunsaturated fatty acids, as well as their mixtures, because the instability of these oils constantly complicates their identification.
The determination of geographical origin of olive oil is essential for the traceability of the products and because the composition of the product is affected by their process conditions (Nenadis and Tsimidou, 2017; Wang et al., 2016). NIR combined with PLS- DA was more efficient than fluorescence excitation-emission matrix spectroscopy technology to classify Argentinian extra- virgin olive oil (Jiménez-Carvelo et al., 2019). Similar results were found for NIR/SIMCA to classify Tunisian extra-virgin olive oil (Laroussi-Mezghani et al., 2015), NIR/PLSDA to classify Croatian extra-virgin olive oil (Peršurić et al., 2018) and NIR/LDA to classify Italian olive oil (Forina et al., 2015) according geographical origin.
What is questionable, perhaps, is the need for more representative and corroborative sampling. The time storage of oils, the type of olive cultivar and the process kind carried out for oil extraction must be considered (Binetti et al., 2017). These factors affect the composition of the oil, so the differences may be given not by the culture conditions of a specific place (geographical origin), but may be dependent on other factors. For instance, if different cultivars are used, it is very likely that the variations in composition are related to the type of cultivar, so the results cannot be conclusive to differences related to geographical origin.
2.2 Coffee
Coffee is one of the most consumed food species in the world. Among the varieties with greater economic importance is the Arabica coffee (Coffea arabica) and Robusta coffee (Coffea canephora) varieties (Thorburn-Burns et al., 2017). Both species have differentiated organoleptic characteristics, the most appreciated being the Arabica variety, with a higher market price compared to the robust variety. These variations in price are related to the most delicate form of Arabica coffee production, growing at heights between 600 - 2000 m (Barbin et al., 2014; Caporaso et al., 2018). Therefore, the identification of the variety of coffee beans represents a very important research focus. In addition, because coffee is consumed in powder, it can be adulterated at various stages of its supply chain, using lower value coffee or other food waste (i.e. barley). Table 2 summarized the last research in the NIR and HIS application for coffee authentication.
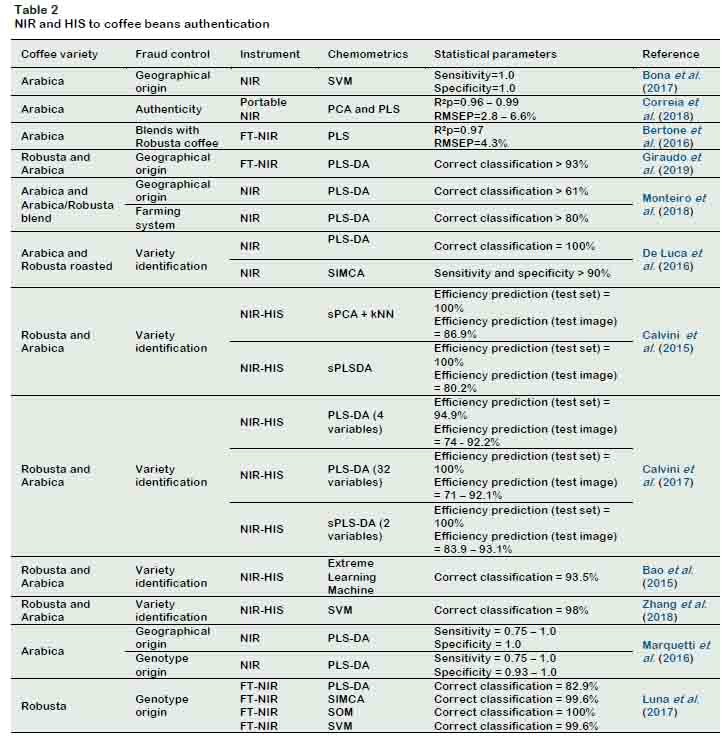
Bona et al. (2017) used support vector machine (SVM) to compare NIR and FT-IR for classification Arabica coffee according geographical origin in Brazil. SVM in tandem with NIR spectral data allowed to classify correctly (100%) Arabica coffee samples. Similar results (sensitivity and specificity = 1.0) were found for identify geographical origin and genotype origin of Arabica coffee using PLS-DA in tandem with NIR (Marquetti et al., 2016). For its part, for Robusta coffee beans, FT-NIR coupled with self-organizing map (SOM) allowed to identify and classify Robusta coffee genotype origin (100% correct classification) (Luna et al., 2017). After, in Brazil, a new research compared proton transfer reaction mass spectrometry (PTR- MS) and NIR to classify Arabica and Arabica/Robusta (rate no informed) coffee according geographical origin (5 cities) and farming system (conventional and organic) (Monteiro et al., 2018). NIR coupled with PLS-DA obtained a correct classification > 80% for identify farming system, which is an advantage compared with PTR-MS due to low price, rapid analysis and minimal sample preparation. More recently, in inter-laboratory analyses was confirmed the FT-NIR potential for classify Arabica and Robusta coffee from different geographical origin (2 continents, 9 countries) (Giraudo et al., 2019). PLS-DA was a chemometric used to develop efficient classification models (correct classification > 93%) for classify coffee beans according continent origin and country origin. At same time, the results were confirmed for two laboratories and no significant difference (p < 0.05) was found, which allows to create more reliable and robust analytical methods.
Variety identification (Robusta or Arabica) in green or roasted beans is important for food fraud control. Roasting coffee is an important stage for its consumption, because roasting process intensifies the organoleptic properties of coffee beans. However, roasting also disguises the appearance of coffee beans, making identification difficult. (De Luca et al., 2016) studied the possibility of using NIR combined with the PLS-DA or SIMCA classifiers to identify the variety (Arabica or Robusta) of roasted coffee. Both classifiers proved to be efficient in differentiating between coffee varieties regardless of coffee origin (Table 2). On the other hand, portable NIR was used successfully to identify blends of Arabica coffee with Robusta coffee (in different roasting levels), corn, peels and sticks (Correia et al., 2018). PCA and PLS were chemometrics employed to identify the adulterated samples, obtaining a quantification limit (LOQ) of 5 – 8% w/w. Similar results (R2p = 0.97) were found using FT-NIR spectral data coupled with PLS to detect Robusta coffee in Arabica coffee (Bertone et al., 2016).
Hyperspectral imaging (HIS) is powerful technique for coffee beans identification and characterization (Caporaso et al., 2018; Zhang et al., 2013). Due to a big data provided by HIS, a variable selection to build a multispectral imaging system is essential for industrial application (Amigo et al., 2013). For Arabica and Robusta coffee discrimination was tested sparse methods (sPCA + KNN and sPLS-DA) using HIS data (Calvini et al., 2015). The sparse methods allow to perform variable selection at the same time as classification, giving parsimonious models. Both sPCA + KNN and sPLS-DA converged to the same important wavelengths, however, the analysis time for sPCA + KNN was higher (13.5 s) than sPLS-DA (< 0.1 s).
After, the same research group used four commercial filters: 1150 nm related to C-H aromatic second overtones, 1200 and 1250 nm C-H aliphatic second overtone and 1400 nm O-H first overtone of aliphatic, to build multispectral model from the data obtained from a hyperspectral image (Calvini et al., 2017).
The results (see Table 2) suggest that the multispectral model (4 variables) in tandem with filters (individual) + PLS-DA or filters (combined) + sPLS-DA are as efficient as the models built using full spectrum (150 variables). However, the analysis time is considerably reduced, which is important for its online application. In the pixel-to- pixel image classification, there is a shape effect of the coffee beans that are most noticeable in the prediction set. Although, in general, the classification was correct (100%), new investigations can be carried out to correct the shape effects, allowing a better prediction in each pixel of the image. These results were better to those found in previous works using NIR-HIS combined with Extreme Learning Machine (correct classification = 93.5%) (Bao et al., 2015) and NIR-HIS coupled with SVM (correct classification = 98%) (Zhang et al., 2018) using full spectra.
2.3 Cereals
Grains of cereals, wheat, rice, barley, oats; and its derivatives, such as derived flour, are important ingredients for the most important staple foods throughout the world, since they make foods such as breads, pastas, cakes and cookies (Murniece and Straumite, 2014). For this, the risk for the illicit activity associated with cereals and derived products, are part of a big problem because of the impact for everyone. Appropriate prevention measures can only be implemented if the nature and type of illegal activity is understood (Tähkäpää et al., 2015). Therefore, this research aims to determine and analyze the extent of reported cases of food adulteration in cereals and products to identify potential trends and frame the development of future empirical research in this area. In this case, optical techniques arise, such as the use of NIR and hyperspectral images, as efficient methods to control the quality of these foods.
The adulteration of wheat flour using cheaper flours is a common fraud case. HSI overcomes the difficulties of the heterogeneity of the sample, allowing to efficiently detect flours of different grains. Methods based on HSI with multivariate analysis such as multivariate statistical process control method (MSPC) (Verdú et al., 2016) and PLS-DA (Ziegler et al., 2016) allowed to discriminate between pure wheat samples and adulterated samples.
In many countries, including China, Japan and South American countries, rice (Oryza sativa L.) is one of the staple foods of their daily diet (Maione and Barbosa, 2018). Rice is a source of vitamins, minerals, fiber and many essential elements (da Silva et al., 2018; Dang and Vasanthan, 2019). The determination of the geographical origin and variety of rice has been an increasing research line in recent years, especially in Asia region (Maione and Barbosa, 2018). And, although the analysis of isotopes and minerals have been quite decisive for the authentication of rice (Mo et al., 2017), NIR spectroscopy is shown as a promising technique (Table 3).
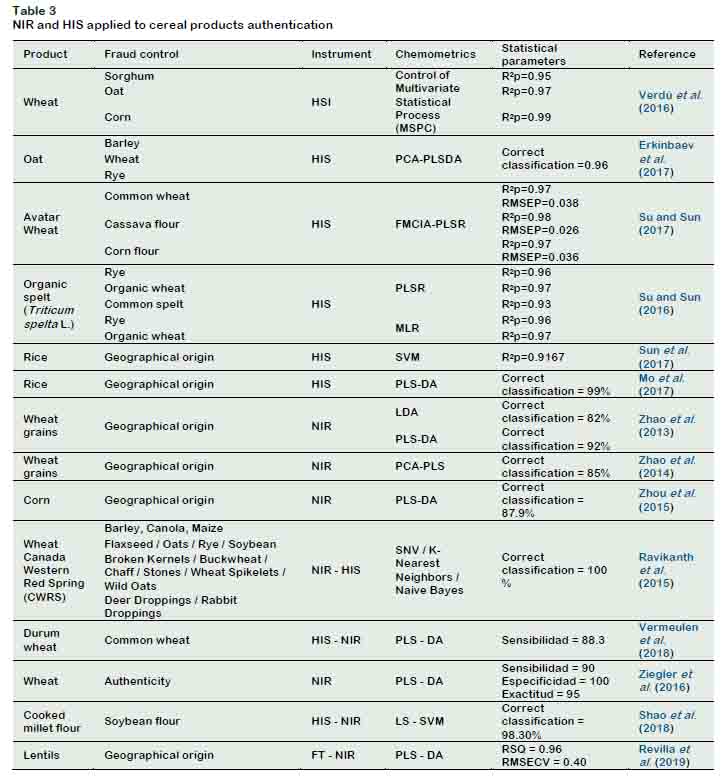
NIR coupled with support vector data description (SVDD) was used to verify the black rice authenticity (Chen et al., 2018). SVDD showed a best performance (100% specificity and 94.2% sensitivity to identify authentic black rice) compared with k- nearest neighbor data description (KNNDD) and GAUSS method. This study should be extended for all rice varieties and more chemometrics as PLS-DA and SIMCA must be used. On the other hand, diverse wavelength selection methods should be tested in order to reduce analysis time by creating multispectral models.
In other research, the NIR potential was tested to identify and classify rice according farming system: organic or conventional (Xiao et al., 2018). PCA and PLS were used to analyze NIR spectral data. PLS showed a good performance (R2cv=0.8430 and RMSECV=0.1992) to identify organic and conventional rice. However, the PLS was constructed using pure samples and no wavelength selections was performed. Then, PLS-DA, KNN or SIMCA probably present a better discrimination capacity to classify rice according farming system, and new research should be drive in this sense. Hyperspectral imaging allowed identify and classify rice from different China’s regions (Sun et al., 2017). The spectral, texture and morphological features obtained of rice´s hyperspectral imaging were combined with SVM for classify rice according geographical origin. The features were tested individually and combined, being the spectral-texture-morphological model (based on 9 important wavelengths) better (correct classification = 91.67%) than other models.
The correct sample collection is essential to develop an analysis method based on spectral information, which should be represent the variability studied (i.e. geographical origin). For instance, if the aim is to differentiate by geographical origin, factors such as genetic variety, genotypes (cultivars) and year of harvest must be controlled.
2.4 Meat and fish
Adulteration in meat and meat products with undeclared animal species has generated concern among consumers, because these meats are considered an edible (i.e. horse meat in USA) or due to social taboos (i.e. pork meat in Mulsim and Jewish communities) (Boyacı et al., 2014; Monahan et al., 2018; Nakyinsige et al., 2012). Perhaps the greatest likelihood of food fraud is found in meat products. Because the meat processing removes external morphological features of a muscle, which makes it difficult to identify the meat species in the processed product (Sentandreu and Sentandreu, 2014). Due to the dynamism of the meat industry, fast, reliable and robust methods are needed that allow the authentication of meat and meat products (Amaral et al., 2016; Kumar and Chandrakant-Karne, 2017). NIR and HIS are presented as powerful, non- destructive, non-invasive, fast and reliable technologies for meat authentication (Aredo et al., 2017; Cheng et al., 2017). Table 4 shows the last research focused in meat and fish authentication.
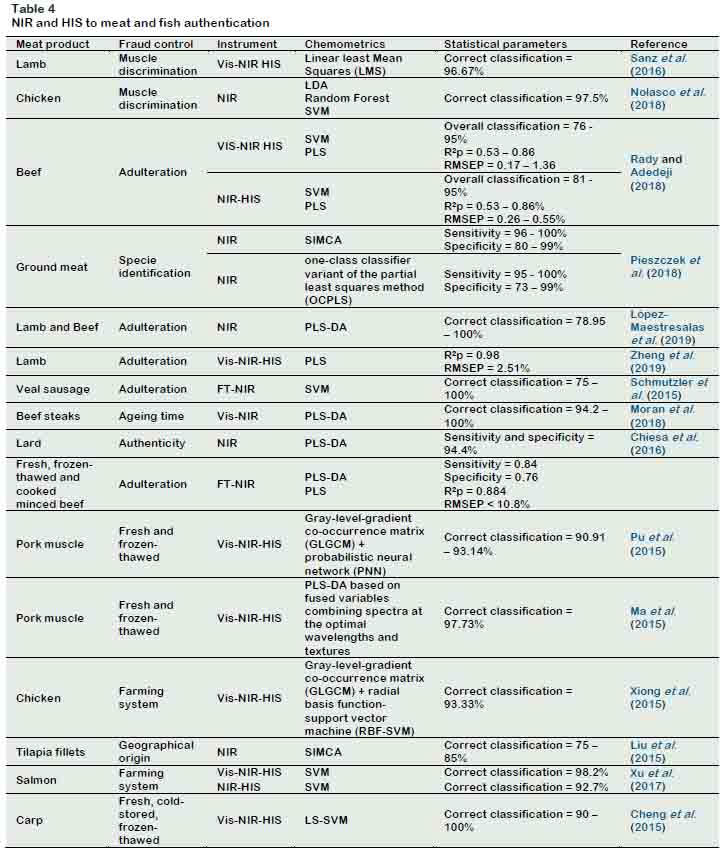
The taste and texture of the meat varies depending on the type of muscle con- sumed, and many times various undeclared muscles are mixed with fraudulent econo- mic motivations. Hyperspectral images of Lamb muscles: Longissimus dorsi, Psoas major, Semimembranosus and Semiten- dinosus, were acquired in order to classify according muscle type (Sanz et al., 2016). After testing different machine learning techniques, the linear Least Mean Squares (LMS) classifier showed the best result (96.67% correct classification). Nolasco et al. (2018) studied the use of NIR to classify different chicken parts: drumstick, breast and thigh. The linear discriminant analysis (LDA), random forest (RF), and support vector machine (SVM) algorithms were used and a correct classification of 97.5% was achieved. It should be noted that this research was conducted using a portable NIR, which is more attractive and less expensive industrially.
Rady and Adedeji (2018) studied the adulteration of beef with chicken or pork and with vegetable protein using Vis-NIR-HIS and NIR-HIS. Both sensors (Vis-NIR-HIS and NIR-HIS) showed to be efficient to classify pure samples of beef, chicken, pork, texturized vegetable protein (TVP) and wheat gluten (WG) (100% correct classification) and adulterated samples (96% using selected wavelengths). The adulterant identification was more difficult, but acceptable (69 – 100% correct classifi- cation). Vis-NIR-HIS in selected wave- lengths was more efficient [r(RDP)] for predict adulterant concentration in minced beef: 0.85 (1.77) for pork, 0.86 (1.95) for TVP, 0.86 (1.98) for chicken, 0.86 (1.87) and 0.87 (1.64) for WG. In addition, Vis-NIR-HIS coupled with PLS regression allowed to quantify duck meat concentration in min- ced lamb (R2p = 0.98) (Zheng et al., 2019).
On the other hand, NIR coupled with one- class classifier variant of the partial least squares method (OCPLS) and the soft independent modeling of class analogy (SIMCA) allowed to classify ground meat according specie origin (lamb, beef and pork) (Pieszczek et al., 2018). Therefore, it is possible that NIR coupled with any of these two classification techniques (SIMCA or OCPLS) is appropriate and feasible to identify ground beef according to its species at industrial level. Later, the potential of NIR to identify and classify beef and lamb meat adulterated with pork, chicken, Lidia breed cattle or foal was studied (López-Maestresalas et al., 2019). NIR spectral data in tandem with PLS-DA achieved a correct classification between 78.95 - 100% in validation set. The adulte- ration of lamb and beef with chicken meat was more difficult to access. However, the Lidia breed cattle and foal in minced beef could be detected at levels of adulteration above 2% and 1%, respectively. These results were better than those found to identify and quantify turkey meat in minced beef (fresh, frozen-thawed and cooked) using FT-NIR with PLS-DA (Sensitivity = 0.84; specificity = 0.76) (Alamprese et al., 2016). On the other hand, it was possible identify and classify (Correct classification = 94.2 – 100%) beef steaks according their ageing time (3, 7, 14 and 21 days post mortem) using Vis-NIR spectral data combined with PLS-DA (Moran et al., 2018). Also, the authenticity of Italian Valle d’Aosta Arnad Protected Designation of Origin (PDO) lard can be determine using NIR spectral data in tandem with PLS-DA (Sensitivity and Specificity = 94.4%), although with less precision than using volatile compound (VOC) or fatty acid (FA) analyses (Sensitivity and Specificity = 100%) (Chiesa et al., 2016). For its part, FT-NIR in tandem with SVM allowed to analyze and classify veal sausage adulterated with pork and pork fat (10 – 50% w/w) (Schmutzler et al., 2015). The results found in this work are quite relevant, since the method developed in the laboratory was tested in industrial and on-site instrumental setups, analyzing them successfully through their plastic packaging (75 - 100% correct classification).
Currently, the fish production and marketing chain has been internationalized, with fish exported from developing to developed countries. NIR spectroscopy in tandem with SIMCA was used to classify tilapia fillets according to their geographical origin (China) (Liu et al., 2015).
The results showed that the NIR spectral information is able to classify, acceptably (Correct classification = 75 - 85%), between tilapia fillets from different regions of China (Guangdong Province, Hainan Province, Guangxi Province and Fujian Province). On the other hand, Vis-NIR-HIS was tested for classify fresh from cold-stored (4 °C for 7 days) and frozen-thawed (−20 °C and −40 °C for 30 days) grass carp fish fillets (Cheng et al., 2015). SIMCA, PLS-DA, least squares- support vector machine (LS-SVM) and probabilistic neural network (PNN) classi- fiers were tested using full and important wavelengths (446, 528, 541, 596, 660, 759 and 970 nm).
1st derivate pre-processing technique and LS-SVM showed the best performance using full wavelengths (94.29% correct classification) and important wavelengths (91.43% correct classification). Later, (Xu et al., 2017) studied and compared the potential of computational vision and Vis- NIR-HIS for classify salmon according farming system: organic and conventional. Vis-NIR-HIS combined with SVM was more successful (98.2% correct classification) than using computational vision (83.6% correct classification using PLS-DA) or NIR- HIS (92.7% correct classification using SVM) to classify salmon.
2.5. Honey
Honey is probably one of the most complex and consumed natural food (Pita-Calvo et al., 2017). Bees (Apis mellifera) collect nectar, plant secretions or excretions of plant‐sucking insects to produce honey, after complex enzymatic process. Honey is a complex mixture of carbohydrates (70-80% w / w), water (10-20% w / w) and a large number of minor components (Ouchemoukh et al., 2007).
Fructose/glucose and fructose/glucose disaccharide are the main carbohydrates in honey (65-80% w/w) (de la Fuente et al., 2006). Therefore, a common adulteration practice is through mislabeling and mixing sugar syrup and lower-quality honeys or production honey using sugar instead of nectar.
In this context, NIR is probably a most sensitive spectroscopy technique to detect honey fraud (Naila et al., 2018). However, some studies show the efficiency of hyper- spectral images to identify adulteration and the origin of honey. Table 5 summarizes the works that apply NIR and hyperspectral images to determine honey authenticity.
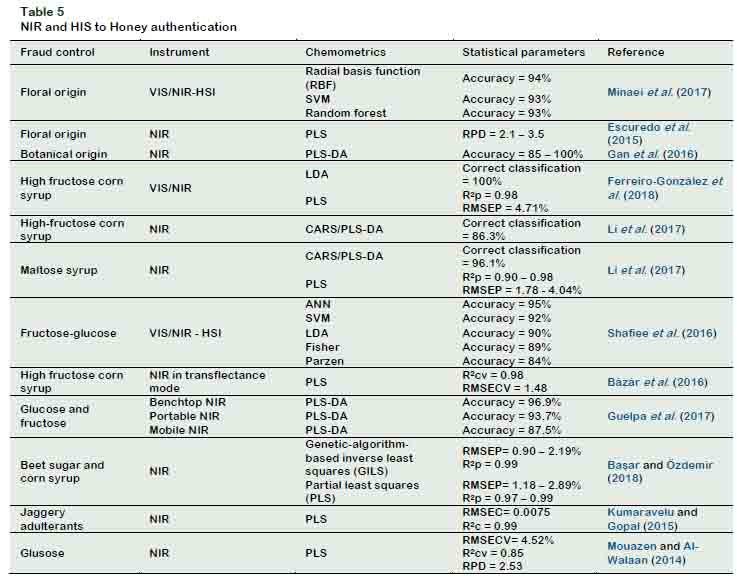
The chemical composition and nutritional properties of honey make it a healthy and desired food. Therefore, its market value is more expensive than common sweeteners such as sugar beet, cane, inverted syrups and syrups with high fructose content (Pita- Calvo et al., 2017). But, the adulteration of honey with inverted syrups or high fructose syrups is usually difficult to detect, because they mimic the sucrose-glucose-fructose profile of honey (Paradkar and Irudayaraj, 2002). NIR is presented as a potential tool to identify adulterated honey with high fructose syrups. Discriminant methods are main chemometrics to classify unknown honey samples into clusters on the basis of similarities (Sivakesava and Irudayaraj, 2001). NIR spectral data in tandem with LDA allowed to identify high fructose corn syrup in honey (CCR = 100%) and to predict adulterant concentration (Ferreiro- González et al., 2018). For high fructose corns syrup and maltose syrup adulterants, a multispectral model based on NIR data combined with CARS/PLS-Da achieved high precision (CCR = 88.3%) (Li et al., 2017). CARS allows to select important wavelengths, to build multispectral model for on-line applications (Li et al., 2009). However, multispectral models must be equal or more accurate than models using whole spectrum. On the other hand, NIR spectral data obtained using fiber optic immersion probe (transmittance mode) was used to build PLS models for detecting accurately high fructose corn syrup in honey (RMSECV = 1.48; R2CV = 0.987) (Bázár et al., 2016). Later, Başar and Özdemir (2018) built regression models to detect beet sugar and corn syrup in honey. Two regression chemometrics was tested: (1) PLS and (2) Genetic‐algorithm‐based inverse least squares (GILS) (Karaman et al., 2009). Both showed similar accuracy to predict adulterant concentration, but multispectral model can be constructing for on-line applications.
For detecting glucose and fructose in adulterated honey sample, more one of discriminant analysis was tested accurately. PLS-DA was selected as chemometrics tool to build discriminant models for authenticity of South African honey based on prediction of glucose and fructose concentrations (Guelpa et al., 2017). This work shows that the loss of precision is minimal compared to portable NIR with table NIR, which industrially is quite important. Similar results was showed for glucose (Mouazen and Al-Walaan, 2014) and jaggery (Kumaravelu and Gopal, 2015) adulterants in honey using NIR spectral data in tandem with PLS regression. On the other hand, VIS/NIR-HSI showed a good performance to detect honey adulterated with fructose and glucose using SVM, LDA and ANN (Shafiee et al., 2016). Chemical maps based on ANN model were built for visual identification of sample adulteration. However, the large amount of information offered by HSI makes its industrial application difficult to implement. New works should be directed to identify the wavelengths important for the identification of each adulterant. Thus, the imple- mentation of HSI in the honey supply chain is less costly and easier to manage.
Honey can be unifloral or multifloral. Unifloral honey is more expensive, due to its low production, therefore its susceptibility to adulteration is higher. For this, there is a protected designation of origin (PDO) and protected geographical indication (PGI) for honey (Cajka et al., 2009), and its identification is economically important. For more information on denomination of origin regulations, diverse analytical methods for authentication and analysis of honey composition you can access the reviews of Pita-Calvo et al. (2017), Trifković et al. (2017), Soares et al. (2017), Naila et al. (2018), Wu et al. (2017), among others.
Pollen types (Castanea, Eucalyptus, Rubus and Erica) related with honey floral (or botanical) origin was successfully determinate using NIR in tandem with PLS (Escuredo et al., 2015). Similar results (CCR=100%) for botanical origin was reported using NIR and iPLS (Gan et al., 2016) (Table 4). Later, VIS/NIR-HIS combined with radial basis (RBF), SVM and Random forest showed similar accuracy for detect honey floral origin (Minaei et al., 2017). Since hyperspectral imaging is a combination of machine vision and spectroscopy, the adulterant distribution can be observed in sample, and their use could be expanded to associate chemical image with adulterant or adulterant/honey features.
3. Data fusion in food authentication
The data fusion strategy has allowed obtaining, in many cases, more precise and conclusive results than using several techniques separately (Borràs et al., 2015; Li et al., 2019). Data fusion can be done in three levels (Figure 2) (Biancolillo et al., 2014):
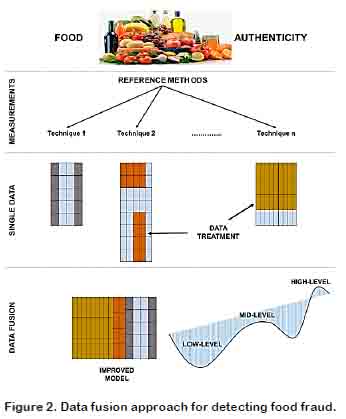
(1) Low-level: a single matrix is created that includes all the raw data of the analyzed sources, as long as the data of the sensors are proportional (same row and column number), being observations of similar physical quantities (Banerjee et al., 2016; Di Rosa et al., 2017).
(2) mid-level: the data obtained from each sensor are analyzed separately and relevant characteristics are extracted from each information block. Then, the information is joined in a single matrix to perform the multivariate analysis (Borràs et al., 2015).
(3) high-level: the information is analyzed separately and a model is generated for each block of data, and then, the responses are combined for a final fused response (Doeswijk et al., 2011). Perhaps the majority vote method is the easiest and most widely used in food analysis (Di Rosa et al., 2017).
Data fusion has extended in various areas such as intelligence system design (Hong et al., 2003), image processing (Zhu and Basir, 2006) and food analysis (included authentication) (Ballabio et al., 2018; Sanaeifar et al., 2018). Initially, the data fusion strategy was based on two data blocks (i.e. spectral and textural data obtained from hyperspectral imaging) (Xiong et al., 2015), but now, the literature reports researches based on fusion data using three (Borràs et al., 2016; Di Rosa et al., 2017), four (Erich et al., 2015) and even five techniques (Biancolillo et al., 2014). In this section we summarized and described the researches based on fusion data strategy for food authentication using NIR or HIS combined with other analytic techniques.
Low-level data fusion showed good performance for classify black, green, white, yellow, dark, and oolong teas (Dankowska and Kowalewski, 2019). For this purpose, UV–Vis, synchronous fluorescence and NIR spectroscopies (individually and fused) were combined with Linear Discriminant Analysis (LDA), Quadratic Discriminant Analysis (QDA), Regularized Discriminant Analysis (RDA) and Support Vector Machine (SVM). Data fusion model based on NIR and UV-Vis in tandem with SVM presented the lowest classification error (<1.4%) of tea samples. However, it must be considered that low- level data fusion requires a greater amount (time) calculation, and may not compensate the non-essential variance obtained by adding the same blocks (Sun et al., 2017). On the other hand, data fusion based on FT- Raman and NIR spectral (middle- and high- level) in tandem with Soft Independent Modelling of Class Analogy (SIMCA) were used for classify hazelnut paste adulterated with almond (Márquez et al., 2016). Individually, FT-Raman and NIR showed sensitivity and specificity values between 75 – 100%. While, the data fusion in mid level and high-level showed best performances for sensitivity and specificity: 96 – 100% and 88 – 100%, respectively. Mid- level data fusion based on NIR data combined with high-resolution mass spectrometry also obtained good performance to classify sulfur-fumigated Chinese herb using (Dai et al., 2018). Similar results (100% correct classification in test samples) were found using mid-level data fusion based on NIR and MIR spectral data for identification of rhubarb (Sun et al., 2017). The mid-level data fusion is more efficient than low-level data fusion, since by previously selecting the relevant variables of each sensor, the calculation time is reduced.
Forina et al. (2015) used data fusion strategy to combine artificial nose, NIR and UV–visible spectroscopy for authentication of the PDO Chianti Classico olive oil. Individually, NIR spectral data (pre-treated by 1st derivate) presented the best performance with 100% for sensitivity and specificity. Great results were achieved (only 3 false positives) using data fusion combining 5 variables (3 NIR + 1 UV-visible + 1 artificial nose) selected by Stepwise- Linear Discriminant Analysis (STEP-LDA).
In this specific case, NIR spectral data is enough to classify correctly PDO Chianti Classico olive oil. Later, NIR and mid infrared (MIR) spectroscopy were combined using data fusion (low-, mid- and high-level) for the quantification of rapeseed oil in olive oil blends (Li et al., 2019). PLS regression models were constructed using the three conceptions (low-, mid- and high-level) and using the spectral data of each technique separately. The lowest RMSEP (2.86) and highest R2p (0.988) was obtained for high-level data fusion strategy, being the most reliable technique for quantitative analysis. Similar results (accuracy 99% is test samples) were found using high-level data fusion based on Raman + NIR + Proton Transfer Reaction – Time of Flight – Mass Spectrometry (PTR-MS) in tandem with PLS-DA for identify and classify 8 Italian honey botanical varieties (Ballabio et al., 2018). One of the advantages of using high- level data fusion is its flexibility, since classification models do not need to be constructed using the same set of samples (Callao and Ruisánchez, 2018). Hyperspectral images have the advantage of providing spectral and spatial information, so the fusion of data consists of obtaining characteristics of the image (i.e. texture) and combining it with the spectral data. Vis-NIR-HIS is also able to differentiate between frozen and frozen- thawed meat samples. Simultaneously, two investigations showed the ability of Vis-NIR- HIS to classify between fresh and frozen- thawed pork Longissimus Dorsi muscles by combining spectral information and textural features (Table 3). Pu et al. (2015) used six features wavelengths (400, 446, 477, 516, 592 and 686 nm) and textural features obtained by histogram statistics (HS), gray level co-occurrence matrix (GLCM) and gray level-gradient co-occurrence matrix (GLGCM). The selected wavelengths and textural features obtained by GLGCM were integrated for in a probabilistic neural network (PNN) model (classification rate = 90.91 - 93.14%). For its part, Ma et al. (2015) used eight important wavelengths (624, 673, 460, 588, 583, 448, 552 and 609 nm) and 45 textural features obtained by GLGCM to obtain the best correct classification (97.73%) based on PLS-DA. On the other hand, gray level-gradient co- occurrence matrix (GLGCM) selected 35 textural features, later they were fusion with HIS spectral data to differentiate successfully (93.3% correct classification) between free-range and broiler chicken meats (Xiong et al., 2015). These studies suggest that the fusion of spectral information and textural characteristics of hyperspectral images can improve the discrimination capacity of classification models.
4. Chemometrics in food authentication
Chemometrics methods are an analytical strategy to analyze the spectral information and generate mathematical models to address the problems related to food fraud (Callao and Ruisánchez, 2018). NIR and HSI provide a large amount of complex information, which often cannot be used in its gross form to generate discriminant / regression models (Pasquini, 2018). In addition, spectroscopic devices can generate information with defects such as noise, edge effect, light scattering and base line shift (Amigo et al., 2015). First, spectral data should be corrected for improve model performance. The most used espectral pre-processes are: (1) multipli- cative scatter correction (MSC) and (2) standard normal variate (SNV) for reducing the spectral variability caused by scattering effects (Rinnan et al., 2009), and (3) Norris-Williams (NW) derivates and Savitzky-Golay polynomial derivative filters for smoothing spectra, removing variations in baseline and resolution of overlapping peaks is used Norris-Williams (NW) derivates and Savitzky-Golay polynomial derivative filters (Brown et al., 2000). This pre-processing spectral tools were successfully applied for treating NIR and HSI spectral data in order to generate discriminant/regression models for food authentication. However, care must be taken with the application of pre-process algorithms, since vital information can be compromised. Therefore, it is important that the analyst knows the conditions of the sample and can determine if the pre- process has not compromised the analysis. In addition, some works show, erroneously, combinations of pre-process algorithms that were designed to correct the same spectral defect (as SNV and MSC). This places multidisciplinary research as an essential pillar that allows us to omit basic errors due to lack of knowledge of a specific technique.
Previous discriminant/regression model established, exploratory analysis is com- monly performed. Among the unsupervised analyzes, principal component analysis (PCA) has been the most used for analysis of spectral data NIR or HSI for food authentication purposes (See Tables 1 – 5). PCA is a technique that reduces information by creating some new variables called principal components (PC) from a linear combination of the original variables (Borràs et al., 2015). PCA allows to observe if the spectral characteristics allow the grouping or separation into groups of samples with specific characteristics defined previously (i.e. geographical origin). If there are no differences between the groups of samples analyzed, it should be considered to reassess the objectives of the work or verify the information referring to the response variable with which the model is being fed.
After, discriminant models or regression model are established to identify food fraud. There is a great diversity of discriminant and regression methods that allow generating mathematical models to detect fraud. A classification or prediction algorithm is not exclusive to a group of data or to a specific case of fraud.
In several cases, research on food authentication are driving to build only classification models. The main classification supervised techniques are: partial least squares discriminant analysis (PLS-DA), linear discriminant analysis (LDA) (Vandeginste et al., 1998) and quadratic discriminant analysis (QDA); k nearest neighbours (KNN) (Callao and Ruisánchez, 2018), soft independent modelling of class analogy (SIMCA) (Moseholm, 1988), support vector machines (SVM) (Sliwinska et al., 2014), random forest (Xu et al., 2017) and artificial neural networks (Mu et al., 2016). These models are used to establish specific classes based on the similarities and differences of the samples analyzed. Then, an external sample can be classified or not in a certain class. The choice of classifier happens not only for having a high precision, but also for reducing the computational time of analysis. Many of the models studied in this review have been created using the full spectrum. However, it is necessary that new studies be directed to evaluate methods of selection of variables in order to establish more precise models.
Between regression algorithms, partial least square (PLS) is the most popular supervised techniques used to build regression models based on spectral data for food identification (see Table 1–5). PLS goal is to analyze or predict a set of dependent variables from a set of predictors (independent variable) which are rotated to ensure maximum correlation efficiency (Alamprese et al., 2013). Therefore, PLS generates a mathematical model that correlates linearly the spectral variables with the variable of interest (i.e. adulterant concentration) (Alamprese et al., 2016). These linear combinations are called latent variables, and they have a great predictive capacity, especially the first latent variables (Kumar and Chandrakant- Karne, 2017). It is important, especially for HSI applications, that PLS models be cons- tructed using only significant wavelengths.
5. Future trends
This review summarizes and analyzes the latest advances in the use of NIR and HSI for food authentication. In the case of NIR, although it seems to be a fairly mature technique (Pasquini, 2018), it can still be explored for new foods and new forms of fraud. For its part, HSI is a technique still in exploration for food authentication purposes. Although HSI can have the advantage of incorporating spatial information, processing that information is very tiring, time consuming and impractical for industrial applications. Future works based on HSI, but also on NIR, must generate multispectral models that allow the technology to be explored at an industrial level. Multispectral models are constructed with the appropriate selection of variables, therefore, new methods in the selection of variables should be explored. On the other hand, although the developed models based on NIR and HSI may have outstanding results, they may not be conclusive. Some limitations in the applications of both techniques have been overcome using data fusion. The fusion of data, at a certain level, allows to obtain more robust and precise models. Perhaps an important challenge in the next works is to establish new ways to merge groups of data to obtain more precise results.
Regarding the manageability of NIR and HSI devices. It is expected that in the not too distant future, smaller portable devices will be available. These devices must be manageable, cheap, robust and easy to apply (Crocombe, 2018). The loss of precision in portable devices is a topic to be addressed by the scientific community. Therefore, it is necessary to publish more research using portable devices, considering the influence of temperature and the movement of the sample in on-line system. Thinking about the final consumer, the NIR and HSI devices must be implemented in smartphone (Kartakoullis et al., 2019), with a friendly language and an interface that is easy to apply. In addition, devices should respond to different food groups. For this, it is important to build these equipment using important wavelen- gths for faster and more accurate analysis.
6. Conclusions
The application of NIR and HSI for food authentication has gained more interest in recent years. Both techniques require a minimum or no sample preparation, are non-invasive, do not use reagents ("green analytical method") and are quite reliable. The spectral information of NIR and HSI combined with chemometrics are generally sufficient to create mathematical models to identify geographic origin, farming system, genetic variety and adulterated samples. The ease of obtaining NIR data allows it to be the technique with the greatest industrial proximity. Although there are still challenges for its implementation in large- scale production lines. For its part, HSI can overcome the limitations of the heterogeneity of the sample and for certain cases obtain a greater amount of valuable information to detect food fraud. Most papers report models based on HSI information using the full spectrum. What would not be industrially viable, therefore, multispectral models are usually a very useful solution. When both techniques, NIR and HSI, do not reach the expected results individually, the data fusion strategy is shown as a promising alternative. The portability of the equipment and the remote access via Wi-Fi or Bluetooth will allow fraud control to be carried out throughout the production chain. In addition, network connections will allow NIR and HSI devices to record information on the network, becoming part of the "Internet of things". Finally, the studies registered in this review are mostly laboratory-level applications, therefore, it is very likely that with the continuous development of technology, more manageable and precise NIR and HSI devices allow industrial studies.
References
Abbas, O.; Zadravec, M.; Baeten, V.; Mikuš, T.; Lešić, T.; Vulić, A.; Prpić, J.; Jemeršić, L.; Pleadin, J. 2018. Analytical methods used for the authentication of food of animal origin. Food Chemistry 246: 6-17.
Alamprese, C.; Amigo, J. M.; Casiraghi, E.; Engelsen, S. B. 2016. Identification and quantification of turkey meat adulteration in fresh, frozen-thawed and cooked minced beef by FT-NIR spectroscopy and chemometrics. Meat Science 121: 175-181. [ Links ]
Alamprese, C.; Casale, M.; Sinelli, N.; Lanteri, S.; Casiraghi, E. 2013. Detection of minced beef adulteration with turkey meat by UV–vis, NIR and MIR spectroscopy. LWT - Food Science and Technology 53: 225-232. [ Links ]
Amaral, J.; Meira, L.; Oliveira, M. B. P. P.; Mafra, I. 2016. 14 - Advances in Authenticity Testing for Meat Speciation. In G. Downey (Ed.), Advances in Food Authenticity Testing. Woodhead Publishing. Pp. 369-414.
Amigo, J.M.; Babamoradi, H.; Elcoroaristizabal, S. 2015. Hyperspectral image analysis. A tutorial. Analytica Chimica Acta 896: 34-51. [ Links ]
Amigo, J. M.; Martí, I.; Gowen, A. 2013. Hyperspectral imaging and chemometrics: a perfect combination for the analysis of food structure, composition and quality. In data handling in science and technology. Elsevier. Pp. 343 - 370. [ Links ]
Aredo, V.; Velásquez, L.; Siche, R. 2017. Prediction of beef marbling using Hyperspectral Imaging (HSI) and Partial Least Squares Regression (PLSR). Scientia Agropecuaria 8: 169-174. [ Links ]
Azizian, H.; Mossoba, M.M.; Fardin-Kia, A.R.; Karunathilaka, S.R.; Kramer, J.K.G. 2016. Developing FT-NIR and PLS1 Methodology for Predicting Adulteration in Representative Varieties/Blends of Extra Virgin Olive Oils. Lipids 51: 1309-1321. [ Links ]
Ballabio, D.; Robotti, E.; Grisoni, F.; Quasso, F.; Bobba, M.; Vercelli, S.; Gosetti, F.; Calabrese, G.; Sangiorgi, E.; Orlandi, M.; Marengo, E. 2018. Chemical profiling and multivariate data fusion methods for the identification of the botanical origin of honey. Food Chemistry 266: 79-89. [ Links ]
Banerjee, R.; Tudu, B.; Bandyopadhyay, R.; Bhattacharyya, N. 2016. A review on combined odor and taste sensor systems. Journal of Food Engineering 190: 10-21. [ Links ]
Bao, Y.-d.; Chen, N.; He, Y.; Liu, F.; Zhang, C.; Kong, W.- w. 2015. Rapid identification of coffee bean variety by near infrared hyperspectral imaging technology. Optics and Precision Engineering 23: 349-355. [ Links ]
Barbin, D.F.; Felicio, A.L.d.S.M.; Sun, D.-W.; Nixdorf, S.L.; Hirooka, E.Y. 2014. Application of infrared spectral techniques on quality and compositional attributes of coffee: An overview. Food Research International 61: 23-32. [ Links ]
Barbin, D.F.; Kaminishikawahara, C.M.; Soares, A.L.; Mizubuti, I.Y.; Grespan, M.; Shimokomaki, M.; Hirooka, E.Y. 2015. Prediction of chicken quality attributes by near infrared spectroscopy. Food Chemistry 168: 554-560. [ Links ]
Barreto, A.; Cruz-Tirado, J. P.; Siche, R.; Quevedo, R. 2018. Determination of starch content in adulterated fresh cheese using hyperspectral imaging. Food Bioscience 21: 14-19. [ Links ]
Basri, K.N.; Hussain, M.N.; Bakar, J.; Sharif, Z.; Khir, M.F.A.; Zoolfakar, A.S. 2017. Classification and quantification of palm oil adulteration via portable NIR spectroscopy. Spectrochimica Acta Part A: Molecular and Biomolecular Spectroscopy 173: 335-342. [ Links ]
Başar, B.; Özdemir, D. 2018. Determination of honey adulteration with beet sugar and corn syrup using infrared spectroscopy and genetic-algorithm-based multivariate calibration. Journal of the Science of Food and Agriculture 98: 5616-5624. [ Links ]
Bertone, E.; Venturello, A.; Giraudo, A.; Pellegrino, G.; Geobaldo, F. 2016. Simultaneous determination by NIR spectroscopy of the roasting degree and Arabica/Robusta ratio in roasted and ground coffee. Food Control 59: 683-689. [ Links ]
Biancolillo, A.; Bucci, R.; Magrì, A. L.; Magrì, A. D.; Marini, F. 2014. Data-fusion for multiplatform characterization of an italian craft beer aimed at its authentication. Analytica Chimica Acta 820: 23-31. [ Links ]
Binetti, G.; Del Coco, L.; Ragone, R.; Zelasco, S.; Perri, E.; Montemurro, C.; Valentini, R.; Naso, D.; Fanizzi, F.P.; Schena, F.P. 2017. Cultivar classification of Apulian olive oils: Use of artificial neural networks for comparing NMR, NIR and merceological data. Food Chemistry 219: 131-138. [ Links ]
Bona, E.; Marquetti, I.; Link, J.V.; Makimori, G.Y.F.; da Costa Arca, V.; Guimarães Lemes, A.L.; Ferreira, J. M.G.; dos Santos Scholz, M. B.; Valderrama, P.; Poppi, R.J. 2017. Support vector machines in tandem with infrared spectroscopy for geographical classification of green arabica coffee. LWT - Food Science and Technology 76: 330-336. [ Links ]
Borràs, E.; Ferré, J.; Boqué, R.; Mestres, M.; Aceña, L.; Busto, O. 2015. Data fusion methodologies for food and beverage authentication and quality assessment – A review. Analytica Chimica Acta 891:1-14. [ Links ]
Borràs, E.; Ferré, J.; Boqué, R.; Mestres, M.; Aceña, L.; Calvo, A.; Busto, O. 2016. Olive oil sensory defects classification with data fusion of instrumental techniques and multivariate analysis (PLS-DA). Food Chemistry 203: 314-322. [ Links ]
Boyacı, I.H.; Temiz, H.T.; Uysal, R.S.; Velioğlu, H.M.; Yadegari, R.J.; Rishkan, M.M. 2014. A novel method for discrimination of beef and horsemeat using Raman spectroscopy. Food chemistry 148: 37-41. [ Links ]
Branigan, T. 2008. In the Guardian, Guardian News and Media, London. [ Links ]
Brown, C.D.; Vega-Montoto, L.; Wentzell, P.D. 2000. Derivative Preprocessing and Optimal Corrections for Baseline Drift in Multivariate Calibration. Applied Spectroscopy 54: 1055-1068. [ Links ]
Bázár, G.; Romvári, R.; Szabó, A.; Somogyi, T.; Éles, V.; Tsenkova, R. 2016. NIR detection of honey adulteration reveals differences in water spectral pattern. Food chemistry 194: 873-880. [ Links ]
Böhme, K.; Calo-Mata, P.; Barros-Velázquez, J.; Ortea, I. 2019. Recent applications of omics-based technologies to main topics in food authentication. TrAC Trends in Analytical Chemistry 110: 221-232. [ Links ]
Cajka, T.; Hajslova, J.; Pudil, F.; Riddellova, K. 2009. Traceability of honey origin based on volatiles pattern processing by artificial neural networks. Journal of Chromatography A 1216: 1458-1462. [ Links ]
Callao, M.P.; Ruisánchez, I. 2018. An overview of multivariate qualitative methods for food fraud detection. Food Control 86: 283-293. [ Links ]
Calvini, R.; Amigo, J.M.; Ulrici, A. 2017. Transferring results from NIR-hyperspectral to NIR-multispectral imaging systems: A filter-based simulation applied to the classification of Arabica and Robusta green coffee. Analytica Chimica Acta 967: 33-41. [ Links ]
Calvini, R.; Ulrici, A.; Amigo, J.M. 2015. Practical comparison of sparse methods for classification of Arabica and Robusta coffee species using near infrared hyperspectral imaging. Chemometrics and Intelligent Laboratory Systems 146: 503-511. [ Links ]
Caporaso, N.; Whitworth, M. B.; Grebby, S.; Fisk, I. D. 2018. Rapid prediction of single green coffee bean moisture and lipid content by hyperspectral imaging. Journal of Food Engineering 227: 18-29. [ Links ]
Chen, H.; Lin, Z.; Tan, C. 2018. Fast quantitative detection of sesame oil adulteration by near- infrared spectroscopy and chemometric models. Vibrational Spectroscopy 99: 178-183. [ Links ]
Chen, H.; Tan, C.; Lin, Z. 2018. Authenticity Detection of Black Rice by Near-Infrared Spectroscopy and Support Vector Data Description. International journal of analytical chemistry. [ Links ]
Cheng, J.-H.; Nicolai, B.; Sun, D.-W. 2017. Hyperspectral imaging with multivariate analysis for technological parameters prediction and classification of muscle foods: A review. Meat Science 123: 182-191. [ Links ]
Cheng, J.-H.; Sun, D.-W.; Pu, H.-B.; Chen, X.; Liu, Y.; Zhang, H.; Li, J.-L. 2015. Integration of classifiers analysis and hyperspectral imaging for rapid discrimination of fresh from cold-stored and frozen- thawed fish fillets. Journal of Food Engineering 161: 33-39. [ Links ]
Chiesa, L.; Panseri, S.; Bonacci, S.; Procopio, A.; Zecconi, A.; Arioli, F.; Cuevas, F. J.; Moreno-Rojas, J. M. 2016. Authentication of Italian PDO lard using NIR spectroscopy, volatile profile and fatty acid composition combined with chemometrics. Food Chemistry 212: 296-304. [ Links ]
Correia, R.M.; Tosato, F.; Domingos, E.; Rodrigues, R.R.T.; Aquino, L.F.M.; Filgueiras, P.R.; Lacerda, V.; Romão, W. 2018. Portable near infrared spectroscopy applied to quality control of Brazilian coffee. Talanta 176: 59-68. [ Links ]
Cozzolino, D. 2016. 16 - Authentication of Cereals and Cereal Products. In G. Downey (Ed.), Advances in Food Authenticity Testing. Woodhead Publishing. Pp. 441 - 457. [ Links ]
Crocombe, R.A. 2018. Portable Spectroscopy. Applied Spectroscopy 72: 1701-1751. [ Links ]
Dai, S.; Lin, Z.; Xu, B.; Wang, Y.; Shi, X.; Qiao, Y.; Zhang, J. 2018. Metabolomics data fusion between near infrared spectroscopy and high-resolution mass spectrometry: A synergetic approach to boost performance or induce confusion. Talanta 189: 641-648. [ Links ]
Danezis, G. P.; Tsagkaris, A. S.; Brusic, V.; Georgiou, C. A. 2016. Food authentication: state of the art and prospects. Current Opinion in Food Science 10: 22-31. [ Links ]
Dang, T.T.; Vasanthan, T. 2019. Modification of rice bran dietary fiber concentrates using enzyme and extrusion cooking. Food Hydrocolloids 89: 773-782. [ Links ]
Dankowska, A.; Kowalewski, W. 2019. Tea types classification with data fusion of UV–Vis, synchronous fluorescence and NIR spectroscopies and chemometric analysis. Spectrochimica Acta Part A: Molecular and Biomolecular Spectroscopy 211: 195-202. [ Links ]
da Silva, I.J.S.; Paim, A.P.S.; da Silva, M.J. 2018. Composition and estimate of daily mineral intake from samples of Brazilian rice. Microchemical Journal 137: 131-138. [ Links ]
de la Fuente, E.; Sanz, M.L.; Martínez-Castro, I.; Sanz, J. 2006. Development of a robust method for the quantitative determination of disaccharides in honey by gas chromatography. Journal of Chromatography A 1135: 212-218. [ Links ]
De Luca, S.; De Filippis, M.; Bucci, R.; Magrì, A.D.; Magrì, A.L.; Marini, F. 2016. Characterization of the effects of different roasting conditions on coffee samples of different geographical origins by HPLC- DAD, NIR and chemometrics. Microchemical Journal 129: 348-361. [ Links ]
Di Rosa, A.R., Leone, F.; Cheli, F.; Chiofalo, V. 2017. Fusion of electronic nose, electronic tongue and computer vision for animal source food authentication and quality assessment – A review. Journal of Food Engineering 210: 62-75. [ Links ]
Doeswijk, T. G.; Smilde, A. K.; Hageman, J. A.; Westerhuis, J. A.; van Eeuwijk, F. A. 2011. On the increase of predictive performance with high-level data fusion. Analytica Chimica Acta 705: 41-47. [ Links ]
Erich, S.; Schill, S.; Annweiler, E.; Waiblinger, H.-U.; Kuballa, T.; Lachenmeier, D.W.; Monakhova, Y.B. 2015. Combined chemometric analysis of 1H NMR, 13C NMR and stable isotope data to differentiate organic and conventional milk. Food Chemistry 188: 1-7. [ Links ]
Erkinbaev, C.; Henderson, K.; Paliwal, J. 2017. Discrimination of gluten-free oats from contaminants using near infrared hyperspectral imaging technique. Food Control 80: 197-203. [ Links ]
Escuredo, O.; González-Martín, M. I.; Rodríguez-Flores, M. S.; Seijo, M. C. 2015. Near infrared spectroscopy applied to the rapid prediction of the floral origin and mineral content of honeys. Food Chemistry 170: 47-54. [ Links ]
Esteki, M.; Shahsavari, Z.; Simal-Gandara, J. 2018. Use of spectroscopic methods in combination with linear discriminant analysis for authentication of food products. Food Control 91: 100-112. [ Links ]
Esteki, M.; Simal-Gandara, J.; Shahsavari, Z.; Zandbaaf, S.; Dashtaki, E.; Vander Heyden, Y. 2018. A review on the application of chromatographic methods, coupled to chemometrics, for food authentication. Food Control 93: 165-182. [ Links ]
Ferreiro-González, M.; Espada-Bellido, E.; Guillén- Cueto, L.; Palma, M.; Barroso, C. G.; Barbero, G. F. 2018. Rapid quantification of honey adulteration by visible-near infrared spectroscopy combined with chemometrics. Talanta 188: 288-292. [ Links ]
Forina, M.; Oliveri, P.; Bagnasco, L.; Simonetti, R.; Casolino, M.C.; Nizzi Grifi, F.; Casale, M. 2015. Artificial nose, NIR and UV–visible spectroscopy for the characterisation of the PDO Chianti Classico olive oil. Talanta 144: 1070-1078. [ Links ]
Gan, Z.; Yang, Y.; Li, J.; Wen, X.; Zhu, M.; Jiang, Y.; Ni, Y. 2016. Using sensor and spectral analysis to classify botanical origin and determine adulteration of raw honey. Journal of Food Engineering 178: 151-158. [ Links ]
Giraudo, A.; Grassi, S.; Savorani, F.; Gavoci, G.; Casiraghi, E.; Geobaldo, F. 2019. Determination of the geographical origin of green coffee beans using NIR spectroscopy and multivariate data analysis. Food Control 99: 137-145. [ Links ]
Gossner, C.M.-E.; Schlundt, J.; Embarek, P.B.; Hird, S.; Lo-Fo-Wong, D.; Beltran, J.J.O.; Teoh, K.N.; Tritscher, A. 2009. The melamine incident: implications for international food and feed safety. Environmental health perspectives 117: 1803. [ Links ]
Guelpa, A.; Marini, F.; du Plessis, A.; Slabbert, R.; Manley, M. 2017. Verification of authenticity and fraud detection in South African honey using NIR spectroscopy. Food Control 73: 1388-1396. [ Links ]
Hong, B.; Jun, L.; Xian-Yun, Z.; Jing, Z. 2003. A fire detection system based on intelligent data fusion technology. In Proceedings of the 2003 International Conference on Machine Learning and Cybernetics (IEEE Cat. No.03EX693) 2: 1096-1101. [ Links ] Jiménez-Carvelo, A.M.; Lozano, V.A.; Olivieri, A.C. 2019.
Comparative chemometric analysis of fluorescence and near infrared spectroscopies for authenticity confirmation and geographical origin of Argentinean extra virgin olive oils. Food Control 96: 22-28.
Kamruzzaman, M.; Makino, Y.; Oshita, S. 2016. Parsimonious model development for real-time monitoring of moisture in red meat using hyperspectral imaging. Food Chemistry 196: 1084-1091. [ Links ]
Karaman, I.; Tanriverdi, H.; Özdemir, D. 2009. Prediction of Lignin and Extractive Content of Pinus nigra Arnold. var. Pallasiana Tree Using Near Infrared Spectroscopy and Multivariate Calibration AU - Uner, B. Journal of Wood Chemistry and Technology 29: 24-42. [ Links ]
Kartakoullis, A.; Comaposada, J.; Cruz-Carrión, A.; Serra, X.; Gou, P. 2019. Feasibility study of smartphone-based Near Infrared Spectroscopy (NIRS) for salted minced meat composition diagnostics at different temperatures. Food Chemistry 278: 314-321. [ Links ]
Karunathilaka, S. R.; Kia, A.-R. F.; Srigley, C.; Chung, J. K.; Mossoba, M. M. 2016. Nontargeted, Rapid Screening of Extra Virgin Olive Oil Products for Authenticity Using Near-Infrared Spectroscopy in Combination with Conformity Index and Multivariate Statistical Analyses. Journal of Food Science 81: C2390-C2397. [ Links ]
Kennedy, J.; Delaney, L.; McGloin, A.; Wall, P.G. 2009. Public perceptions of the dioxin crisis in Irish pork. [ Links ] Kumar, Y.; Chandrakant-Karne, S. 2017. Spectral analysis: A rapid tool for species detection in meat products. Trends in Food Science & Technology 62: 59-67. [ Links ]
Kumaravelu, C.; Gopal, A. 2015. Detection and quantification of adulteration in honey through near infrared spectroscopy. International Journal of Food Properties 18: 1930-1935. [ Links ]
Laroussi-Mezghani, S.; Vanloot, P.; Molinet, J.; Dupuy, N.; Hammami, M.; Grati-Kamoun, N.; Artaud, J. 2015. Authentication of Tunisian virgin olive oils by chemometric analysis of fatty acid compositions and NIR spectra. Comparison with Maghrebian and French virgin olive oils. Food Chemistry 173: 122-132. [ Links ]
Li, H.; Liang, Y.; Xu, Q.; Cao, D. 2009. Key wavelengths screening using competitive adaptive reweighted sampling method for multivariate calibration. Analytica Chimica Acta 648: 77-84. [ Links ]
Li, S.; Zhang, X.; Shan, Y.; Su, D.; Ma, Q.; Wen, R.; Li, J. 2017. Qualitative and quantitative detection of honey adulterated with high-fructose corn syrup and maltose syrup by using near-infrared spectroscopy. Food Chemistry 218: 231-236. [ Links ]
Li, Y.; Xiong, Y.; Min, S. 2019. Data fusion strategy in quantitative analysis of spectroscopy relevant to olive oil adulteration. Vibrational Spectroscopy 101: 20-27. [ Links ]
Liu, Y.; Ma, D.-h.; Wang, X.-c.; Liu, L.-p.; Fan, Y.-x.; Cao, J.-x. 2015. Prediction of chemical composition and geographical origin traceability of Chinese export tilapia fillets products by near infrared reflectance spectroscopy. LWT - Food Science and Technology 60: 1214-1218. [ Links ]
Luna, A.S.; da Silva, A.P.; Alves, E.A.; Rocha, R.B.; Lima, I.C.A.; de Gois, J.S. 2017. Evaluation of chemometric methodologies for the classification of Coffea canephora cultivars via FT-NIR spectroscopy and direct sample analysis. Analytical Methods 9: 4255-4260. [ Links ]
López-Maestresalas, A.; Insausti, K.; Jarén, C.; Pérez-Roncal, C.; Urrutia, O.; Beriain, M.J.; Arazuri, S. 2019. Detection of minced lamb and beef fraud using NIR spectroscopy. Food Control 98: 465-473. [ Links ]
Ma, J.; Pu, H.; Sun, D.-W.; Gao, W.; Qu, J.-H.; Ma, K.-Y. 2015. Application of Vis–NIR hyperspectral imaging in classification between fresh and frozen-thawed pork Longissimus Dorsi muscles. International Journal of Refrigeration 50: 10-18. [ Links ]
Maione, C.; Barbosa, R.M. 2018. Recent applications of multivariate data analysis methods in the authentication of rice and the most analyzed parameters: A review. Critical reviews in food science and nutrition 1-12. [ Links ]
Marquetti, I.; Link, J.V.; Lemes, A.L.G.; Scholz, M.B.d.S.; Valderrama, P.; Bona, E. 2016. Partial least square with discriminant analysis and near infrared spectroscopy for evaluation of geographic and genotypic origin of arabica coffee. Computers and Electronics in Agriculture 121: 313-319. [ Links ]
Mendes, T.O.; da Rocha, R.A.; Porto, B.L.S.; de Oliveira, M.A.L.; dos Anjos, V.d.C.; Bell, M.J.V. 2015. Quantification of Extra-virgin Olive Oil Adulteration with Soybean Oil: a Comparative Study of NIR, MIR, and Raman Spectroscopy Associated with Chemometric Approaches. Food Analytical Methods 8: 2339-2346. [ Links ]
Minaei, S.; Shafiee, S.; Polder, G.; Moghadam-Charkari, N.; van Ruth, S.; Barzegar, M.; Zahiri, J.; Alewijn, M.; Kuś, P. M. 2017. VIS/NIR imaging application for honey floral origin determination. Infrared Physics & Technology 86: 218-225. [ Links ]
Mo, C.; Lim, J.; Kwon, S.W.; Lim, D.K.; Kim, M. S.; Kim, G.; Kang, J.; Kwon, K.-D.; Cho, B.-K. 2017. Hyperspectral imaging and partial least square discriminant analysis for geographical origin discrimination of white rice. Journal of Biosystems Engineering 42: 293-300. [ Links ]
Monahan, F.J.; Schmidt, O.; Moloney, A.P. 2018. Meat provenance: Authentication of geographical origin and dietary background of meat. Meat Science 144: 2-14. [ Links ]
Monteiro, P.I.; Santos, J.S.; Alvarenga Brizola, V.R.; Pasini Deolindo, C.T.; Koot, A.; Boerrigter-Eenling, R.; van Ruth, S.; Georgouli, K.; Koidis, A.; Granato, D. 2018. Comparison between proton transfer reaction mass spectrometry and near infrared spectroscopy for the authentication of Brazilian coffee: A preliminary chemometric study. Food Control 91: 276-283. [ Links ]
Moran, L.; Andres, S.; Allen, P.; Moloney, A. P. 2018. Visible and near infrared spectroscopy as an authentication tool: Preliminary investigation of the prediction of the ageing time of beef steaks. Meat Science 142: 52-58. [ Links ]
Moseholm, L. 1988. Analysis of air pollution plant exposure data: the soft independent modelling of class analogy (SIMCA) and partial least squares modelling with latent variable (PLS) approaches. Environmental Pollution 53: 313-331. [ Links ]
Mossoba, M.M.; Azizian, H.; Fardin-Kia, A.R.; Karunathilaka, S.R.; Kramer, J.K.G. 2017. First Application of Newly Developed FT-NIR Spectroscopic Methodology to Predict Authenticity of Extra Virgin Olive Oil Retail Products in the USA. Lipids 52: 443-455. [ Links ]
Mouazen, A. M.; Al-Walaan, N. 2014. Glucose adulteration in Saudi honey with visible and near infrared spectroscopy. International journal of food properties 17: 2263-2274. [ Links ]
Mu, T.; Chen, S.; Zhang, Y.; Chen, H.; Guo, P.; Meng, F. 2016. Portable Detection and Quantification of Olive Oil Adulteration by 473-nm Laser-Induced Fluorescence. Food Analytical Methods 9: 275-279. [ Links ]
Murniece, I.; Straumite, E. 2014. The information presented on labels for bread produced in Latvia. Food Chemistry 162: 117-121. [ Links ]
Márquez, C.; López, M.I.; Ruisánchez, I.; Callao, M.P. 2016. FT-Raman and NIR spectroscopy data fusion strategy for multivariate qualitative analysis of food fraud. Talanta 161: 80-86. [ Links ]
Naila, A.; Flint, S.H.; Sulaiman, A.Z.; Ajit, A.; Weeds, Z. 2018. Classical and novel approaches to the analysis of honey and detection of adulterants. Food Control 90: 152-165. [ Links ]
Nakyinsige, K.; Man, Y.B.C.; Sazili, A.Q. 2012. Halal authenticity issues in meat and meat products. Meat science 91: 207-214. [ Links ]
Nenadis, N.; Tsimidou, M.Z. 2017. Perspective of vibrational spectroscopy analytical methods in on‐ field/official control of olives and virgin olive oil. European Journal of Lipid Science and Technology 119: 1600148. [ Links ]
Nolasco, I.M.; Badaró, A.T.; Barbon, S.; Barbon, A.P.A.C.; Pollonio, M.A.R.; Barbin, D.F. 2018. Classification of Chicken Parts Using a Portable Near-Infrared (NIR) Spectrophotometer and Machine Learning. Applied Spectroscopy 72: 1774-1780. [ Links ]
Ortea, I.; O'Connor, G.; Maquet, A. 2016. Review on proteomics for food authentication. Journal of Proteomics 147: 212-225. [ Links ]
Ouchemoukh, S.; Louaileche, H.; Schweitzer, P. 2007. Physicochemical characteristics and pollen spectrum of some Algerian honeys. Food Control 18: 52-58. [ Links ]
Ozen, B. F.; Mauer, L. J. 2002. Detection of hazelnut oil adulteration using FT-IR spectroscopy. Journal of agricultural and food chemistry 50: 3898-3901. [ Links ]
Paradkar, M.M.; Irudayaraj, J. 2002. Discrimination and classification of beet and cane inverts in honey by FT-Raman spectroscopy. Food Chemistry 76: 231-239. [ Links ]
Pasquini, C. 2018. Near infrared spectroscopy: A mature analytical technique with new perspectives – A review. Analytica Chimica Acta 1026: 8-36. [ Links ]
Peršurić, Ž.; Saftić, L.; Mašek, T.; Kraljević Pavelić, S. 2018. Comparison of triacylglycerol analysis by MALDI-TOF/MS, fatty acid analysis by GC-MS and non-selective analysis by NIRS in combination with chemometrics for determination of extra virgin olive oil geographical origin. A case study. LWT - Food Science and Technology 95: 326-332.
Picouet, P.A.; Gou, P.; Hyypiö, R.; Castellari, M. 2018. Implementation of NIR technology for at-line rapid detection of sunflower oil adulterated with mineral oil. Journal of Food Engineering 230: 18-27. [ Links ]
Pieszczek, L.; Czarnik-Matusewicz, H.; Daszykowski, M. 2018. Identification of ground meat species using near-infrared spectroscopy and class modeling techniques – Aspects of optimization and validation using a one-class classification model. Meat Science 139: 15-24. [ Links ]
Pita-Calvo, C.; Guerra-Rodríguez, M.E.; Vázquez, M. 2017. Analytical Methods Used in the Quality Control of Honey. Journal of Agricultural and Food Chemistry 65: 690-703. [ Links ]
Pu, H.; Sun, D.-W.; Ma, J.; Cheng, J.-H. 2015. Classification of fresh and frozen-thawed pork muscles using visible and near infrared hyperspectral imaging and textural analysis. Meat Science 99: 81-88. [ Links ]
Rady, A.; Adedeji, A. 2018. Assessing different processed meats for adulterants using visible-near- infrared spectroscopy. Meat Science 136: 59-67. [ Links ]
Ravikanth, L.; Singh, C.B.; Jayas, D.S.; White, N.D.G. 2015. Classification of contaminants from wheat using near-infrared hyperspectral imaging. Biosystems Engineering 135: 73-86. [ Links ]
Revilla, I.; Lastras, C.; González-Martín, M.I.; Vivar- Quintana, A.M.; Morales-Corts, R.; Gómez-Sánchez, M.A.; Pérez-Sánchez, R. 2019. Predicting the physicochemical properties and geographical ORIGIN of lentils using near infrared spectroscopy. Journal of Food Composition and Analysis 77: 84-90. [ Links ]
Rinnan, Å.; Berg, F.v.d.; Engelsen, S.B. 2009. Review of the most common pre-processing techniques for near-infrared spectra. TrAC Trends in Analytical Chemistry 28: 1201-1222. [ Links ]
Sanaeifar, A.; Jafari, A.; Golmakani, M.-T. 2018. Fusion of dielectric spectroscopy and computer vision for quality characterization of olive oil during storage. Computers and Electronics in Agriculture 145: 142-152. [ Links ]
Sanz, J.A.; Fernandes, A.M.; Barrenechea, E.; Silva, S.; Santos, V.; Gonçalves, N.; Paternain, D.; Jurio, A.; Melo-Pinto, P. 2016. Lamb muscle discrimination using hyperspectral imaging: Comparison of various machine learning algorithms. Journal of Food Engineering 174: 92-100. [ Links ]
Schmutzler, M.; Beganovic, A.; Böhler, G.; Huck, C. W. 2015. Methods for detection of pork adulteration in veal product based on FT-NIR spectroscopy for laboratory, industrial and on-site analysis. Food Control 57: 258-267. [ Links ]
Sentandreu, M.Á.; Sentandreu, E. 2014. Authenticity of meat products: Tools against fraud. Food Research International 60: 19-29. [ Links ]
Shafiee, S.; Polder, G.; Minaei, S.; Moghadam-Charkari, N.; van Ruth, S.; Kuś, P. M. 2016. Detection of Honey Adulteration using Hyperspectral Imaging. IFAC- PapersOnLine 49: 311-314. [ Links ]
Shao, Y.; Xuan, G.; Hu, Z.; Gao, X. 2018. Identification of adulterated cooked millet flour with Hyperspectral Imaging Analysis. IFAC-PapersOnLine 51: 96-101. [ Links ] Shi, J.; Tang, Y.; Wei, H.; Zhang, L.; Zhang, D.; Shi, J.;
Gong, W.; He, X.; Yang, K.; Liu, D. 2012. Temperature dependence of threshold and gain coefficient of stimulated Brillouin scattering in water. Applied Physics B 108: 717-720.
Shi, J.; Yuan, D.; Hao, S.; Wang, H.; Luo, N.; Liu, J.; Zhang, Y.; Zhang, W.; He, X.; Chen, Z. 2019. Stimulated Brillouin scattering in combination with visible absorption spectroscopy for authentication of vegetable oils and detection of olive oil adulteration. Spectrochimica Acta Part A: Molecular and Biomolecular Spectroscopy 206: 320-327. [ Links ]
Sivakesava, S.; Irudayaraj, J. 2001. Detection of inverted beet sugar adulteration of honey by FTIR spectroscopy. Journal of the Science of Food and Agriculture 81: 683-690. [ Links ]
Sliwinska, M.; Wisniewska, P.; Dymerski, T.; Namiesnik, J.; Wardencki, W. 2014. Food analysis using artificial senses. Journal of agricultural and food chemistry 62: 1423-1448. [ Links ]
Soares, S.; Amaral, J.S.; Oliveira, M.B.P.P.; Mafra, I. 2017. A Comprehensive Review on the Main Honey Authentication Issues: Production and Origin. Comprehensive Reviews in Food Science and Food Safety 16: 1072-1100. [ Links ]
Su, W.-H.; Sun, D.-W. 2016. Facilitated wavelength selection and model development for rapid determination of the purity of organic spelt (Triticum spelta L.) flour using spectral imaging. Talanta 155: 347-357. [ Links ]
Su, W.-H.; Sun, D.-W. 2017. Evaluation of spectral imaging for inspection of adulterants in terms of common wheat flour, cassava flour and corn flour in organic Avatar wheat (Triticum spp.) flour. Journal of Food Engineering 200: 59-69. [ Links ]
Sun, J.; Lu, X.; Mao, H.; Jin, X.; Wu, X. 2017. A Method for Rapid Identification of Rice Origin by Hyperspectral Imaging Technology. Journal of Food Process Engineering 40: e12297. [ Links ]
Sun, W.; Zhang, X.; Zhang, Z.; Zhu, R. 2017. Data fusion of near-infrared and mid-infrared spectra for identification of rhubarb. Spectrochimica Acta Part A: Molecular and Biomolecular Spectroscopy 171: 72-79. [ Links ]
Thorburn-Burns, D.; Tweed, L.; Walker, M.J. 2017. Ground Roast Coffee: Review of Analytical Strategies to Estimate Geographic Origin, Species Authenticity and Adulteration by Dilution. Food Analytical Methods 10: 2302-2310. [ Links ]
Trifković, J.; Andrić, F.; Ristivojević, P.; Guzelmeric, E.; Yesilada, E. 2017. Analytical methods in tracing honey authenticity. Journal of AOAC International 100: 827-839. [ Links ]
Tähkäpää, S.; Maijala, R.; Korkeala, H.; Nevas, M. 2015. Patterns of food frauds and adulterations reported in the EU rapid alert system for food and feed and in Finland. Food Control 47: 175-184. [ Links ]
van Ruth, S. M.; Luning, P. A.; Silvis, I. C. J.; Yang, Y.; Huisman, W. 2018. Differences in fraud vulnerability in various food supply chains and their tiers. Food Control 84: 375-381. [ Links ]
Vandeginste, B.G.M.; Massart, D.L.; De Jong, S.; Massaart, D.L.; Buydens, L.M.C. 1998. Handbook of chemometrics and qualimetrics: Part B: Elsevier. [ Links ]
Verdú, S.; Vásquez, F.; Grau, R.; Ivorra, E.; Sánchez, A. J.; Barat, J. M. 2016. Detection of adulterations with different grains in wheat products based on the hyperspectral image technique: The specific cases of flour and bread. Food Control 62: 373-380. [ Links ]
Vermeulen, P.; Suman, M.; Fernández Pierna, J. A.; Baeten, V. 2018. Discrimination between durum and common wheat kernels using near infrared hyperspectral imaging. Journal of Cereal Science 84: 74-82. [ Links ]
Wang, P.; Sun, J.; Zhang, T.; Liu, W. 2016. Vibrational spectroscopic approaches for the quality evaluation and authentication of virgin olive oil. Applied Spectroscopy Reviews 51: 763-790. [ Links ]
Wu, J.; Dong, J.; Dong, W.; Chen, Y.; Liu, C. 2016. Rapid authentication of adulteration of olive oil by near- infrared spectroscopy using support vector machines. In International Symposium on Optoelectronic Technology and Application 2016, vol. 10157. Pp. 12: SPIE. [ Links ]
Wu, L.; Du, B.; Vander Heyden, Y.; Chen, L.; Zhao, L.; Wang, M.; Xue, X. 2017. Recent advancements in detecting sugar-based adulterants in honey – A challenge. TrAC Trends in Analytical Chemistry 86: 25-38. [ Links ]
Wójcicki, K.; Khmelinskii, I.; Sikorski, M.; Caponio, F.; Paradiso, V. M.; Summo, C.; Pasqualone, A.; Sikorska, E. 2015. Spectroscopic techniques and chemometrics in analysis of blends of extra virgin with refined and mild deodorized olive oils. European Journal of Lipid Science and Technology 117: 92-102. [ Links ]
Xiao, R.; Liu, L.; Zhang, D.; Ma, Y.; Ngadi, M. O. 2018. Discrimination of organic and conventional rice by chemometric analysis of NIR spectra: a pilot study. Journal of Food Measurement and Characterization 1-12. [ Links ]
Xiong, Z.; Sun, D.-W.; Pu, H.; Zhu, Z.; Luo, M. 2015. Combination of spectra and texture data of hyperspectral imaging for differentiating between free-range and broiler chicken meats. LWT - Food Science and Technology 60: 649-655. [ Links ]
Xu, J.-L.; Riccioli, C.; Sun, D.-W. 2017. Comparison of hyperspectral imaging and computer vision for automatic differentiation of organically and conventionally farmed salmon. Journal of Food Engineering 196: 170-182. [ Links ]
Zhang, C.; Liu, F.; He, Y. 2018. Identification of coffee bean varieties using hyperspectral imaging: influence of preprocessing methods and pixel-wise spectra analysis. Scientific Reports 8: 2166. [ Links ]
Zhang, X.; Li, W.; Yin, B.; Chen, W.; Kelly, D. P.; Wang, X.; Zheng, K.; Du, Y. 2013. Improvement of near infrared spectroscopic (NIRS) analysis of caffeine in roasted Arabica coffee by variable selection method of stability competitive adaptive reweighted sampling (SCARS). Spectrochimica Acta Part A: Molecular and Biomolecular Spectroscopy 114:350-356. [ Links ]
Zhao, H.; Guo, B.; Wei, Y.; Zhang, B. 2013. Near infrared reflectance spectroscopy for determination of the geographical origin of wheat. Food Chemistry 138: 1902-1907. [ Links ]
Zhao, H.; Guo, B.; Wei, Y.; Zhang, B. 2014. Effects of grown origin, genotype, harvest year, and their interactions of wheat kernels on near infrared spectral fingerprints for geographical traceability. Food Chemistry 152: 316-322. [ Links ]
Zheng, X.; Li, Y.; Wei, W.; Peng, Y. 2019. Detection of adulteration with duck meat in minced lamb meat by using visible near-infrared hyperspectral imaging. Meat Science 149: 55-62. [ Links ]
Zhou, X.; Yang, Z.; Haughey, S. A.; Galvin-King, P.; Han, L.; Elliott, C. T. 2015. Classification the geographical origin of corn distillers dried grains with solubles by near infrared reflectance spectroscopy combined with chemometrics: A feasibility study. Food Chemistry 189: 13-18. [ Links ]
Zhu, H.; Basir, O. 2006. A novel fuzzy evidential reasoning paradigm for data fusion with applications in image processing. Soft Computing 10: 1169-1180. [ Links ]
Ziegler, J.U.; Leitenberger, M.; Longin, C.F.H.; Würschum, T.; Carle, R.; Schweiggert, R.M. 2016. Near-infrared reflectance spectroscopy for the rapid discrimination of kernels and flours of different wheat species. Journal of Food Composition and Analysis 51: 30-36. [ Links ]
Received December 10, 2018.
Accepted March 2, 2019.
* Corresponding author
E-mail: rsiche@unitru.edu.pe (R. Siche).

