


Serviços Personalizados
Journal

Artigo
 Inglês (pdf)
 Artigo em XML
 Referências do artigo
 Enviar este artigo por email
Indicadores
-
 Citado por SciELO
Links relacionados
-
 Similares em
SciELO
Similares em
SciELO
Compartilhar

 Permalink
Scientia Agropecuaria
versão impressa ISSN 2077-9917
Scientia Agropecuaria vol.10 no.2 Trujillo abr./jun. 2019
http://dx.doi.org/10.17268/sci.agropecu.2019.02.07
ARTÍCULOS ORIGINALES
Microbiological indicators of tropical soils quality in ecosystems of the north-east area of Peru
Renzo Alfredo Valdez-Nuñez1ORCID iD https://orcid.org/0000-0002-5273-0182; José Carlos Rojas-García1 ORCID iD https://orcid.org/0000-0002-6513-3379 ; Winston Franz RíosRuiz1,*ORCID iD https://orcid.org/0000-0002-2513-8423
1 Universidad Nacional de San Martin – Tarapoto; Jr. Maynas 177, Tarapoto, San Martin, Peru.
Abstract
Tropical soils withstand heavy pressure due to deforestation as a result of the change in land use, decreasing their quality. Traditionally, the quality of soil has been based on physical and chemical indicators; however, the biological ones can predict variations in the quality, in an early and effective way. In this research, the microbiological quality of soils from two ecosystems was evaluated, one from the Cumbaza Sub-Basin (CSB) and the other from Degraded Pastures at Cuñumbuque (DPC), both in San Martín, Peru. The physicochemical characteristics were studied and the microbial populations of Total Bacteria (TB), Sporulated Bacteria (SB), Total Fungi (TF), Actinobacteria (ACT), and parameters of microbial activity such as Basal Respiration (BR), Microbial Biomass (MB), Metabolic Quotient (qCO2) and Microbial Quotient (qMIC). According to the Principal Component Analysis (PCA), the soils of the CSB had on average a lower biological quality compared to the DPC soils. The PCA discriminated that the microbial populations of TB, SB, ACT and MB represented effective microbiological indicators to evaluate the quality of the soils, in this respect the soils of Shapumba, Chontal, Aucaloma and Vista Alegre are degraded and require the application of new technologies and public policies for their recovery.
Keywords: Microbial soil activity; changes in land use; principal component analysis; microbial biomass.
1. Introduction
Soil microorganisms play an important role in maintaining their fertility (Cardoso et al., 2013), which is why their metabolic and enzymatic activity are considered efficient indicators during the recovery process of total soil quality (Burns et al., 2013). The microorganisms increase the viability of the nutrients through exclusive processes, such as the biological fixation of nitrogen, the solubilization of phosphates, or bioavailability of nutrients, allowing to recover the structure of the soil, improving its aggregation and stability (Rashid et al., 2016). In this way, soil microorganisms can be classified into functional groups according to their participation in the biogeochemical cycles (Cardoso et al., 2013).
Soil degradation causes reduction in organic matter levels and total productivity (Oliveira et al., 2016a), including changes in the functional potential, structure and composition of soil microbial communities (Zhang et al., 2017). That is why microbiological indicators can be used to monitor the recovery of soil sustainability, to optimize the stability and productivity of natural ecosystems, as well as to reduce degradation and minimize negative environmental impacts on the soil (Azcón-Aguilar and Barea, 2015). These can be direct methods, by quantifying microbial populations over a period of time, and indirect, through the measurement of microbial activity (Horwath, 2017).
Thus, there are studies on carbon (C) and nitrogen (N) from microbial biomass, metabolic quotient, specific enzyme activities such as dehydrogenase, β-glycosidase (cycle C), urease (cycle N), acid and alkaline phosphatase (cycle Phosphorus), mycotrophic capacity and number of spores of arbuscular mycorrhizal fungi, all of them< evaluated in soils of forest plantations, coffee plantations or with conventional management systems, organic or integrated with legumes (Azevedo et al., 2017; Canei et al., 2018; Lammel et al., 2015; Ríos-Ruiz et al., 2019; Zagatto et al., 2019). Studies of the effect of altitude on microbiological attributes have also been carried out (Qinling et al., 2018), showing a significant impact of this factor on the microbial characteristics of the soil. On the other hand, Silva et al. (2018) evaluated the microbiological attributes of the soil of a mining area rehabilitated with grass, determining the presence of an active microbial community in the soil recovery process after mining activities. However, despite these studies, there is still little information on how microbiological attributes vary in tropical ecosystems with soils degraded by migratory cultivation (Ríos-Ruiz et al., 2019) and overgrazing, so that the use of these attributes can constitute important indicators for the evaluation of soil quality in a given area.
In that regard, the objective of the study was to determine the physicochemical and microbiological parameters of soils in two areas of the San Martin region, under different types of land use, and to determine which microbiological indicators are more susceptible to changes, as well as the soils found in degradation process.
2. Materials and methods
The study was conducted in degraded areas with different land use in the provinces of Lamas and San Martin. Soil samples were collected from six areas from DPC: Carañayacu (6˚31'45" S, 76˚31'48" W; 589 m.a.s.l), Bosalao (6˚31'7" S, 76˚30'23" O; 412 m.a.s.l), Estero (6˚33'38" S, 76˚28'10" W; 490 m.a.s.l), Cercado (6˚30'29" S, 76˚28'36" W; 306 m.a.s.l), Difuntillo (6˚31'23" S, 76˚28'28" W; 262 m.a.s.l) and Chacrilla (6˚32'46" S, 76˚26'58" W; 244 m.a.s.l). Another 6 samples were collected in degraded lands of the CSB by migratory agriculture and with the presence of Pteridium aquilinum (Shapumba), from the upper and middle CSB. In the upper CSB, samples were taken from Chirikyacu (6˚22'15" S, 76˚29'6" W; 1109 m.a.s.l); Chontal (6˚20'24" S, 76˚30'45" W; 1168 m.a.s.l) and Vista Alegre (6˚22'52" S, 76˚31'8" W; 786 m.a.s.l) and in the middle CSB in Aucaloma (6˚26'21" S, 76˚31'28" W, 684 m.a.s.l); San Antonio de Cumbaza (6˚24'18" S, 76˚25'9" W; 560 m.a.s.l) and Shapumba (6˚25'19" S, 76˚28'58" W; 596 m.a.s.l). The most predominant types of soils in DPC were the vertisol type and in the CSB the inceptisols, entisoles and alfisols type (Soil Survey Staff, 2015).
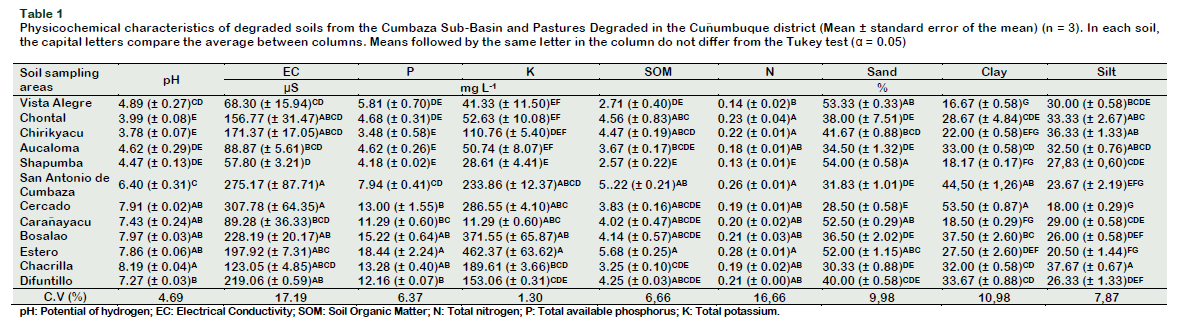
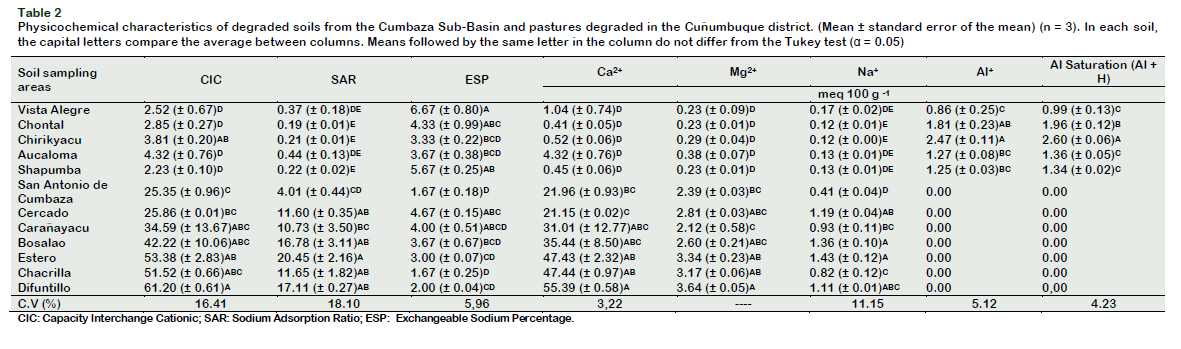
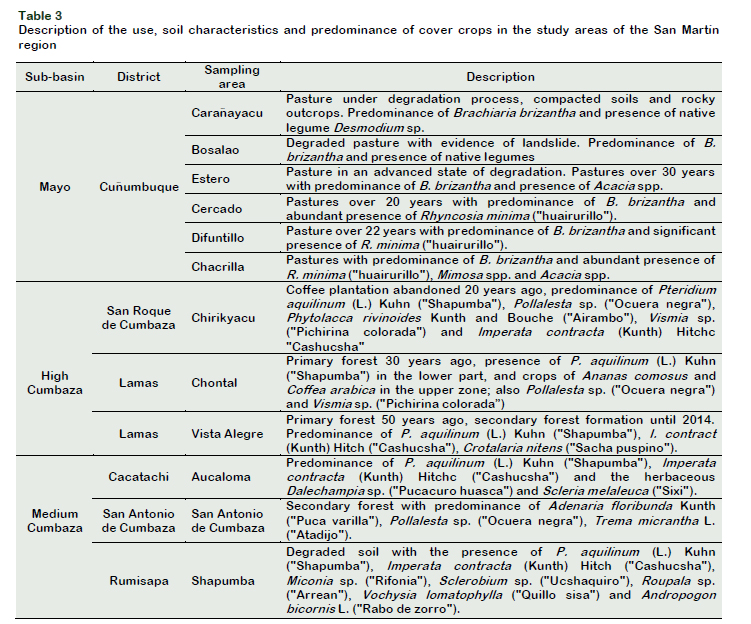
Soil samples were collected between April and May 2016. Table 1 shows the use, characteristics and predominance of plant coverage in the sampling sites. Samples were collected at a depth of 0.0-0.20 m. Ten subsamples were extracted from each area, dried, sieved (2 mm) and stored at room temperature until analysis was carried out. A composite of each soil sample was selected for physicochemical characterization. Soil physicochemical analyses were carried out according to Soil Survey Staff (2014). The texture analysis was determined using the Bouyoucos hydrometer and the textural classes calculated according to the textural triangle in the Soil Texture Calculator (USDA, 2018). The pH was determined in the soil suspension: distilled water (1:2.5). The phosphorus (P) was extracted using a modified Olsen solution (0.5 M NaHCO3, pH 8.5) and determined by visible light spectrophotometry The K+, Ca2+, Mg2+ and Na+ were extracted with 1.0 N ammonium acetate and determined by atomic absorption. Al+ was extracted with neutral solution of KCl and determined by titration with NaOH. Soil Organic Matter (SOM) was determined by the method of Walkley and Black (1934). The Sodium Adsorption Ratio (SAR) was calculated as follows: SAR = Na+/ ({[Ca2+] + [Mg2+]}/2)1/2. Exchangeable Sodium Percentage (ESP) was calculated as follows: ESP = [Exch. Na+/Exch. (Ca2++Mg2++K++Na+)] × 100 (Ashaduzzaman et al., 2011). The determination of the Conductivity Electric (CE) and the Capacity Interchange Cationic (CIC), was carried according to the methodology suggested by Soil Survey Staff (2014). The chemical composition of the soils under study is shown in Table 1 and Table 2.
Basal respiration (BR) was determined according to the methodology of the static system (Alef, 1995), using 100 g of soil corrected to 60% moisture retention capacity and were incubated at room temperature for 168 hours (1 week); The results were expressed as C-CO2 mg Kgˉ¹ hˉ¹. The microbial biomass (MB) was evaluated by the method of respiration induced by the substrate (Anderson and Domsch, 1978), using 20 g of soil corrected to 60% moisture retention capacity and 60 mg of glucose anhydrous followed by preincubation and incubation at 22 °C for 6 hours. The results were expressed as μg C gˉ¹ of soil.
The methodology to determine the qCO2 (mg C-CO2 gˉ¹ dayˉ¹) was reported by Insam and Haselwandter (1989) and for the qMIC (C-MB / Total Organic Carbon (TOC)) was used by Insam and Domsch (1988). The number of total and sporulated bacteria (TB and SB), total fungi (TF) and Actinobacteria (ACT) was determined, according to the methodology suggested by Kandeler (2015). Agar Thornton, Martin and Caseinate-Glucose media were used for the counting of TB and SB, TF and ACT, respectively. The plates containing the microorganisms were incubated for 3 days for TB and SB, 5 days for TF and 7 days for ACT. Each analysis was conducted in triplicate. The results were expressed in colony forming units per gram of soil (cfu g-1 soil). Finally, the data were subjected to an analysis of variance and the means were compared using the Tukey and Scott and Knott test at 5% significance. The Principal Component Analysis (PCA) was carried out (Hotelling, 1933) as a dimension reduction technique. The analysis was represented in a graph of the Biplot type (Gabriel, 1971), which also included the analysis of Minimum Path Tree (Gower and Ross, 1969), to show the smallest distance or similarity between two soils in the multivariate space. The analysis was performed using the statistical method InfoStat (Version 2017).
3. Results and discussion
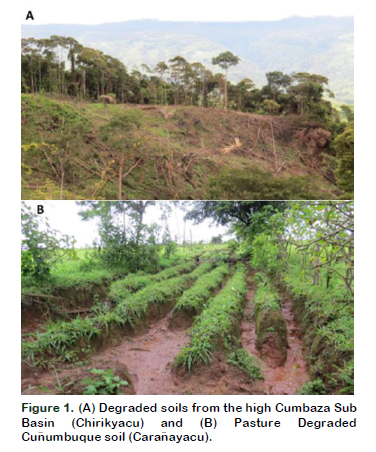
The type of soil influences the development of plant composition, and this in turn on the diversity and functionality of the microbial communities present in the soil. Soils in the study areas have variable uses. In Cuñumbuque they are used for the production of pastures, while in Chirikyacu and Shapumba they are dedicated to agricultural activity, some of them were abandoned more than 20 years ago, because of shifting cultivation (Figure 1). Navarrete et al. (2015) reported that deforestation, clearing and overgrazing, cause a decrease in soil organic matter inputs and an increase in soil compaction, causing negative alterations in microbial activity.
In relation to the cover crops, Brachiaria brizantha is predominant in PDC soils and in soils coming from the CSB, the predominant cover plant is P. aquilinum "Shapumba" (Table 3). The predominance of cover crop species in an agricultural or natural ecosystem is influenced directly or indirectly by the rhizospheric microbiota (Philippot et al., 2013), as well as B. brizantha and P. aquilinum, predominant in PDC soils and the CSB, respectively, could present rhizospheric microbiota of biotechnological interest.
The microbial populations of the soil showed greater variability than the physicochemical analysis. TB population counts were numerically superior in PDC soils than in CSB soils, statistically significant and higher in Bosalao and Estero soils (> 107 cfu g-1 soil), as well as lower counts in Chontal soils, Aucaloma and Shapumba (105 cfu g-1 soil) (Table 4), probably due to a greater content of SOM and texture, that favors its proliferation (Rashid et al., 2016).
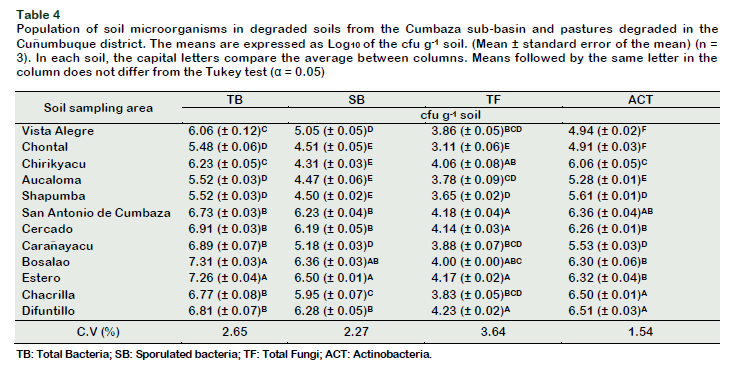
The TB population possess a positive correlation between the MB (r = 0.90) and the pH (r = 0.89), and very low with the Al parameters (-0.78 to -0.79) (Table 4). The MB is intimately related to the BR and therefore of a greater bacterial population releasing CO2 (Ferreira et al., 2017). Lauber et al. (2009), reported a positive correlation (r = 0.79) of the total bacterial communities and the pH of 88 soils in North America, finding that soil pH influences the diversity of bacterial communities being more diverse in soils close to neutral pH.
Likewise, TB populations have a high correlation with EC (r = 0.60) and Na+ (r = 0.90), this differs from that reported by Ashaduzzaman et al. (2011), who found a negative correlation between TB and CEC populations (r = -0.67) as well as interchangeable Na+ (r = -0.60) in saline soils of southern Korea. One explanation for this contradict-tion may be because the soils in this study do not have salt problems. CIC values and TB populations showed positive correlation (r = 0.83), being frequently overlooked as an important determinant of the composi-tion and diversity of bacterial populations in the soil (Lauber et al., 2009). The TF populations of the soil (filamentous molds and yeast) were higher than 104 cfu g-1 in the soils under study (Table 4). The populations of saprophytic fungi in the soil vary in number and diversity according to the most abundant substrate class (cellulose), pH, N-NH4+ concentration, and SOM (Spurgeon et al., 2013).
The pH of the soil showed a positive correlation with the number of TF (r = 0.56), as reported by Spurgeon et al. (2013) and contrasts with Spurgeon et al. (2013) that showed that pH negatively affects filamentous fungi populations (r = -0.40), that is, fungi prefer environments with higher acidity than bacteria.
The ACT reached populations higher than 106 cfu g-1 of soil, being statistically signifycant in pasture soils (Table 4). Rampelotto et al. (2013) reported a greater distribution of the filo actinobacteria in pasture soils, since these play an important role in the decomposition of SOM. In addition to presenting high resistance to ultraviolet radiation, heat and desiccation, this would explain their abundance in pasture soils since they have little vegetation cover, and therefore are more exposed to radiation (Rampelotto et al., 2013). In our study, the concentration of aluminum negatively influenced the populations of actinobacteria, unlike other reports in tropical soils, where apparently this population is not affected by high levels of aluminum (Silva et al., 2013). This can be explained by the high concentration of Al in our soils (1.53 meq 100 g-1) unlike the previous study (0.19 meq 100 g-1). The microbial activity of soils can be measured by calculating the MB, through the activity of soil enzymes, and by evaluating BR (Ferreira et al., 2017). The BR reflects the metabolic and physiological capacity of the heterotrophic microbial cells of the soil, important in the nutrient cycling (Cardoso et al., 2013), which is why it is considered a potential biological indicator for the provision of ecosystem services (Creamer et al., 2014). In soils from DPC, BR was higher, compared to the soils from the CSB (Table 5). Karhu et al. (2014) reported that pasture soils showed a higher respiratory rate than forest soils. The soil from Difuntillo had a significantly elevated BR (8.60 mg CO2 kg-1h-1) (Table 5) compared to other areas of degraded pastures. These elevated respiratory activities in pasture soils have been reported by Assis et al. (2017), in Nova Canaã do Norte soils (5.07 mg CO2 kg-1h-1), and could be due to the presence of animals and the constant addition of manure and slurry to the soil, which promotes a significant increase in the MB.
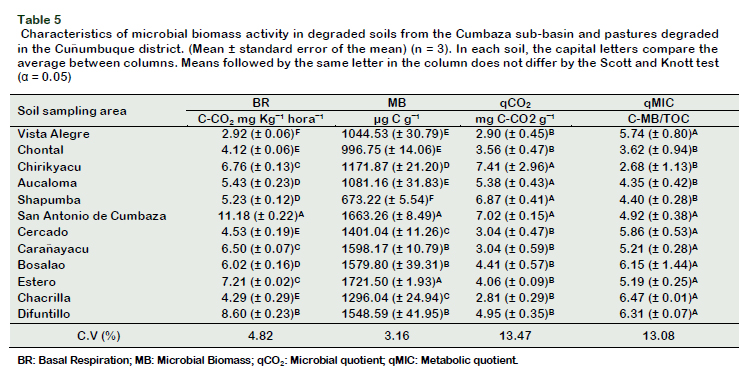
Among the zones under study from the CSB, the soils of San Antonio de Cumbaza showed the significantly higher levels (11.18 mg CO2 kg-1 h-1) (Table 5), this zone represents a secondary forest of 10 years old, which supports a cover crops recovered in a natural way, without tillage or addition of xenobiotics that interfere with the cycling of nutrients. However, the results of BR should be interpreted carefully, a high BR may reflect stress condition for the soil microbiota, rapid decomposition of SOM and loss of physicochemical quality of the soil and on the other hand may reflect high levels of productivity in the soil ecosystem, due to an efficient cycling of nutrients.
The BR depends on the quantity and quality of the SOM, temperature, humidity and aeration of the same (Bünemann et al., 2018). The physicochemical factors that positively influenced the BR in our soils were the SOM (r = 0.67, p = 0.0178) and the nitrogen content (N) (r = 0.63, p = 0.0268). The SOM can supply substrates to heterotrophic microorganisms, and several studies show a positive correlation with the BR (Lai et al., 2012; Zhou et al., 2013).
The fertilization addition of N in the soil greatly affects the microbial activity as well as the recycling of carbon and nutrients in the soil (Geisseler and Scow, 2014). We found a positive correlation between the N content and the BR of the total soils (r = 0.63, p = 0.0268), but this correlation was greater in soils from the CSB (r = 0.69) than in DPC (r = 0.50) (Data not shown). To explain this difference, it is necessary to know the supply of N in each of the ecosystems. On the other hand, while CBS soils have a wide range of N content, DPC soils have intermediate levels of N, due to the entry of N into the manure and slurry of the cattle when grazing, but that is insufficient to keep the productivity of the pastures. These results could be explained through what was reported by Mooshammer et al. (2014), when the N is insufficient to satisfy the N needs of the cover crops and the microbial biomass (tropical forests saturated in N) this does not constitute a limitation for the carbon cycle and microbial activity.
The MB is the living portion of the SOM, constituted by bacteria, archaea and eukaryotes, playing an important role in the cycling of nutrients, suppression of pathogens, decomposition of residues and degradation of contaminants, considering itself the best soil quality indicator (Kaschuk et al., 2010; Kandeler, 2015). In general, PDC soils showed MB levels in the range of 1296.04 (± 24.94) to 1721.50 (± 1.93) μg C gˉ¹, in Chacrilla and Estero soils, respectively (Table 5). Likewise, San Antonio de Cumbaza, exceptionally to the soils of the CSB, accumulated a MB of 1663.26 (± 8.49) μg C gˉ¹ (Table 5). Compared to natural forests, pastures can stimulate a greater accumulation of MB due to the fasciculate radical system of grasses, the entry of SOM (manure and slurry), as well as a greater supply of photosynthates by photosynthesis of C4 plants (Kaschuk et al., 2010). In contrast, the Shapumba soils reached the lowest values of microbial biomass 673.22 (± 5.54) μg C gˉ¹ (Table 5).
Factors that positively affected MB levels in the study areas were pH (r = 0.77, p = 0.0033), salinity (CE, r = 0.64, p = 0.0264), SAR, related to Ca2+ (r = 0.77, p = 0.0037), Mg2+ (r = 0.82, p = 0.0010) and Na+ (r = 0.78, p = 0.0028) and indicators related to soil fertility, such as SOM (r = 0.70, p = 0.0111), concentration N (r = 0.72, p = 0.0081), P (r = 0.78, p = 0.0030), K (r = 0.68, p = 0.0160), as well as CIC (r = 0.78, p = 0.0030). Therefore, the MB is considered as the indicator of soil quality that responds more quickly to environmental changes, influencing the productivity of cover crops (Kaschuk et al., 2010). Several studies show a positive correlation between pH and BR (Pietri and Brookes, 2008, 2009).
Oliveira et al. (2016b) reported that the conversion of primary forests into pastures, leads to an increase in SOM, a similar situation has been reported in our study. On the contrary, the levels of Al (r = -0.72, p = 0.0038) and Al + H (r = -0.73, p = 0.0068) correlated inversely with the accumulation of MB in the soils under study. In most forest ecosystems with acidic soils, cover crops show no symptoms of Al toxicity, but soil microorganisms and nutrient cycling mediated by microorganisms can be affected by Al toxicity (Kunito et al., 2016), and it has even been reported that toxic concentrations of Al affect the diversity of microorganisms adapted to these acidic conditions.
The metabolic quotient (qCO2) (Insam and Haselwandter, 1989) and microbial quotient (qMIC) (Insam and Domsch, 1988) are derivatives of MB. The qCO2 indicates the efficiency by which soil microorganisms use carbon in the soil. According to Araújo et al. (2013), low levels of qCO2 reflect a stable environment or close to a balanced condition, systems that promote low levels of qCO2 have a more balanced MB, with greater mineralization and lower volatilezation of C in the soil. Chirikyacu soils have significantly higher values of qCO2 (7.41) and the lowest was Chacrilla (2.81) (Table 5). In Chirikyacu, the zones were recently deforested, so the disturbance process is recent, and the MB is of low resistance, meaning that the MB decreased significantly after the disturbance. In Chacrilla, the area under sampling was a degraded pasture but in the process of stabilization of pastures, so the resistance of the MB is high. In general, pastures in recovery have a low metabolic ratio due to the decrease in the metabolic stress of the microbial community (Santos et al., 2015), while in degraded soils, quality declines and the productivity of pastures is reduced due to increased compaction, nutrient leaching and erosion (Kaschuk et al., 2010).
The factors that positively influenced qCO2 correspond to the BR (r = 0.58, p < 0.05) and to the Al concentration (r = 0.44, p = 0.1493); and those that do it inversely correspond to the qMIC (r = -0.58, p <0.05), and to the pH (r = -0.49, p = 0.1073). The variations in the qCO2 are controlled by several factors categorized as biological, meteorological and edaphic, from the biological point of view, the qCO2 is affectted by the structure of the bacterial community, MB and BR (Jiang et al., 2013). Xu et al. (2017), in a meta-analysis that covered research in the period 1970-2015, covering a total of 2444 observations in 14 biomes of the planet, reported positive correlations with the BR (r = 0.50, p < 0.01), as well as negative correlations with the MB (r = -0.35; p < 0.01), as we found in our study. Among the edaphic factors, the following correlations were found: Slime content (r = 0.25, p < 0.01), clay (r = 0.084, p < 0.01), sand (r = 0.099, p < 0.01) and pH (r = 0.11, p <0.01), similar results are reported in this research (Table 1).
The microbial quotient (qMIC) expresses how much carbon is immobilized by the microbial population (Xu et al., 2014). The MB / TOC ratio (%), constitutes a microbial parameter of the soil to describe changes in ecosystems influenced by man and above all in soil recovery, can be considered superior to MB and TOC, and even to other parameters (Insam and Domsch, 1988). It correlates positively with MB and high and low values expressing the frequency of accumulation or loss of C, respectively (Kaschuk et al., 2010). The qMIC gives us an idea of the capacity of soils to support microbial growth, and it is expected that better quality soils will have high qMIC values (Kaschuk et al., 2010). The qMIC values can vary from 0.3% to 7.0% and depends on the use, management and type of soil, as well as the type of cover crops and sampling time (Paz-Ferreiro and Fu, 2016). In our study, the qMIC (Table 5) was significantly correlated with some biological parameters, such as TB (r = 0.62, p < 0.05) and SB (r = 0.77, p < 0.005), significantly qMIC was negatively correlated with qCO2 (r = -0.58, p < 0.05), this situation has also been reported by other authors (Singh et al., 2016; Signor et al., 2018).
In relation to the chemical parameters, the levels of P (r = 0.71, p < 0.01), Ca2+ (r = 0.72, p < 0.01), Mg2+ (r = 0.73, p < 0.01) and CIC (r = 0.71, p < 0.01) were positively correlated with qMIC, all of them related to soil fertility and nutrient availability; while the levels of Al+ (r = -0.88, p = 0.0002) and Al + H+ (r = - 0.87, p = 0.0002) were negatively correlated. The values of qMIC were solved in two groups, the soils of DPC, including San Antonio de Cumbaza and Vista Alegre, were statistically similar (4.92 6.47%), on the contrary the soils of Chontal, Chirikyacu, Aucaloma and Shapumba showed low values, statistically similar (2.68 4.92%) (Table 5). Low values explain the reduced efficiency in the use of carbon substrates, since more substrates are derived to catabolic processes than to anabolic processes, reducing MB levels (Pietri and Brookes, 2008).
The PCA is a powerful tool to discriminate soil quality, it is used to identify sensitive indicators for soil quality recovery (Biswas et al., 2017), to determine the effect of organic amendments (Kumar et al., 2017) and application of pesticides (Borowik et al., 2017). In this study, the PCA shows that CP1, CP2 and CP3 are responsible for 81% of all variability.
Figure 2 shows the scatter plot using as axes CP1 (59.3%) and CP2 (14.9%), which allows to visualize the greatest variability between soil quality parameters. It shows two large separated groups according to the quality of the soil, on one hand Chirikyacu, Shapumba, Vista Alegre, Aucaloma and Chontal, and on the other hand Carañayacu, San Antonio de Cumbaza, Chacrilla, Bosalao, Difuntillo, Cercado and Estero. The CP1 separates the physical characteristics of texture such as % of Sand (-0.08) and % of Silt (-0.15); chemical characteristics such as Al3+ (0.22), Al3+ + H (-0.23) and ESP (-0.16) and biological characteristics such as qCO2 (0.07). These parameters explain a greater variability of the low soil quality in these areas.
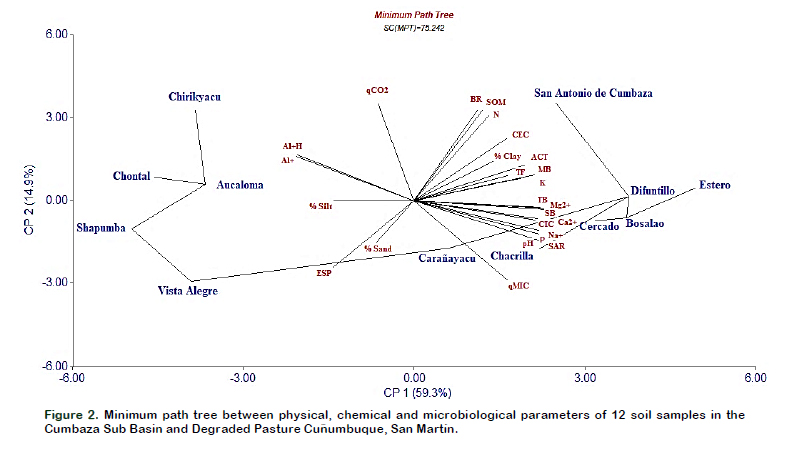
In Figure 2 is also possible to analyze the influence and variability contributed by a physicochemical or biological parameter to a given soil for example: qCO2, Al3+ and Al3++ H in Chirikyacu soils; the % of silt in soils of Chontal, Shapumba and Aucaloma; % sand and ESP; in Vista Alegre soils; the qMIC in Carañayacu and Chacrilla soils; TB, SB, Mg2+, in soils of Bosalao, Estero and Difuntillo; SAR with Chacrilla soils; BR, SOM%, N, CEC%, Clay, ACT, TF, K and MB in soils of San Antonio de Cumbaza. Figure 2 also contains a Minimum Path Tree diagram, which allows a better visualization of the associations between soils depending on the physicochemical or microbiological parameter evaluated. It follows that the soils of Chontal and Aucaloma are more related to the soils of Chirikyacu, with respect to the concentration and saturation of aluminum in the soils.
4. Conclusions
The Soils from DPC showed a better soil quality compared to soil samples from the CSB. According to the PCA, of the 25 quality parameters (three physical parameters, fourteen chemical parameters and eight microbiological parameters), TB, SB, ACT and MB populations represented effective microbiological indicators to evaluate soil quality, while Mg2+, pH, P, Na+ and SAR, are for chemical analysis. It is concluded that the soils of Shapumba, Chontal, Aucaloma and Vista Alegre are degraded and require immediate intervention for their recovery. On the other hand, the Estero soils were the most stable in relation to their resistance and resilience, however it is necessary to set forth an agrosilvopastoral program to improve the quality of pastures.
Acknowledgments
We thank to the Consejo National de Ciencia, Tecnología e Innovación Tecnológica (CONCYTEC), for financing the project "Restoration of degraded soils by migratory agriculture using beneficial microorganisms associated with cover crops in the protected zone of the Cumbaza subbasin, in San Martín ", Convention No. 150-2015. Likewise, to the Ministerio de Educación (MINEDU) for financing the project "Recovery of degraded pastures using beneficial microorganisms and legumes associated with a agrosilvopastoril system in Cuñumbuque, San Martín, Peru", Convention No. 205-2015.
References
Alef, K. 1995. Soil respiration. p. 225-227. In: Alef K.; Nanipieri, P. eds. Methods in applied soil Microbiology and biochemistry. London: Academic Press. [ Links ]
Anderson, J.P.E.; Domsch, K.H. 1978. A physiological method for the quantitative measurement of microbial biomass in soils. Soil Biology and Biochemistry 10: 215-221. [ Links ]
Araújo, A.S.F.; Cesarz, S.; Leite, L.F.C.; Borges, C.D.; Tsai, S.M.; Eisenhauer, N. 2013. Soil microbial properties and temporal stability in degraded and restored lands of Northeast Brazil. Soil Biology and Biochemistry 66: 175181. [ Links ]
Ashaduzzaman, S.M.; Tipayno, S.C.; Kim, K.; Chung, J.B.; Sa, T. 2011. Influence of varying degree of salinity-sodicity stress on enzyme activities and bacterial populations of coastal soils of Yellow Sea, South Korea. Journal of Microbiology and Biotechnology 21: 341-346. [ Links ]
Assis, P.C.R.; Stone, L.F.; Silveira, A.L.R.D.; Oliveira, J.D.M.; Wruck, F J.; Madari, B. E. 2017. Biological Soil Properties in Integrated Crop-Livestock-Forest Systems. Revista Brasileira de Ciência do Solo, 41. [ Links ]
Azcón-Aguilar, C.; Barea, J.M. 2015. Nutrient cycling in the mycorrhizosphere. Journal of Soil Science and Plant Nutrition 15: 372-396. [ Links ]
Azevedo, R.R.; Santos, J.B.; Baretta, D.; Ramos, A.C.; Cardoso, E.J.B.N. 2017. Chemical and microbiological soil properties in organic and conventional management systems of Coffea arabica L. Journal of Plant Nutrition 40: 20762086. [ Links ]
Biswas, S.; Hazra, G.C.; Purakayastha, T.J.; Saha, N.; Mitran, T.; Roy, S.S.; Mandal, B. 2017. Establishment of critical limits of indicators and indices of soil quality in ricerice cropping systems under different soil orders. Geoderma 292: 34-48. [ Links ]
Borowik, A.; Wyszkowska, J.; Kucharski, J.; Baćmaga, M.; Tomkiel, M. 2017. Response of microorganisms and enzymes to soil contamination with a mixture of terbuthylazine, mesotrione, and S-metolachlor. Environmental Science and Pollution Research 24: 1910-1925. [ Links ]
Bünemann, E.K.; Bongiorno, G.; Bai, Z.; Creamer, R.E.; De Deyn, G.; de Goede, R.; Fleskens, L.; Geissen, V.; Kuyper, T.W.; Mader, P.; Pulleman, M.; Sukkel, W.; van Groenigen, J.W.; Brussaard, L. 2018. Soil quality–A critical review. Soil Biology and Biochemistry 120: 105-125. [ Links ]
Burns, R.G.; De Forest, J.L.; Marxsen, J.; Sinsabaugh, R.L.; Stromberger, M.E.; Wallenstein, M.D.; Weintraub, M.N.; Zoppini, A. 2013. Soil enzymes in a changing environment: current knowledge and future directions. Soil Biology and Biochemistry 58: 216-234. [ Links ]
Canei, A.D.; Hernández, A.G.; Morales, D.M.L.; da Silva, E.P.; Souza, L.F.; Loss, A.; Lourenzi, C.R.; dos Reis, M.S.; Soares, C.R.F.S. 2018. Atributos microbiológicos e estrutura de comunidades bacterianas como indicadores da qualidade do solo em plantios florestais na mata atlántica. Ciência Florestal, Santa Maria 28: 1405-1417. [ Links ]
Cardoso, E.J.B.N.; Vasconcellos, R.L.F.; Bini, D.; Miyauchi, M.Y.H.; Santos, C.A.; Alves, P.R.L.; Paula, A.M.; Nakatani, A.S.; Pereira, J.M.; Nogueira, M.A. 2013. Soil health: looking for suitable indicators. What should be considered to assess the effects of use and management on soil health? Scientia Agrícola 70: 274-289. [ Links ]
Creamer, R.E.; Schulte, R.P.O.; Stone, D.; Gal, A.; Krogh, P.H.; Papa, G.L.; Murray, P.J.; Pérès, G.; Foerster, B.; Rutgers, M.; Sousa, J.P.; Winding, A. 2014. Measuring soil respiration across Europe: do incubation temperature and incubation period matter? Ecological Indicators 36: 409–418. [ Links ]
Ferreira, E.P.D.B.; Stone, L.F.; Martin-Didonet, C.C.G. 2017. Population and microbial activity of the soil under an agro-ecological production system. Revista Ciência Agronômica 48: 22-31. [ Links ]
Gabriel, K.R. 1971. The biplot graphic display of matrices with application to principal component analysis. Biometrika 58: 453-467. [ Links ]
Geisseler, D.; Scow, K.M. 2014. Long-term effects of mineral fertilizers on soil microorganisms–A review. Soil Biology and Biochemistry 75: 54-63. [ Links ]
Gower, J.C.; Ross, G.J.S. 1969. Minimum spanning trees and single linkage cluster analysis. Applied Statistics 18: 54-64. [ Links ]
Horwath, W.R. 2017. The role of the soil microbial biomass in cycling nutrients. p. 41-66. In: Tate, K.R. ed. Microbial Biomass: A Paradigm Shift in Terrestrial Biogeochemistry. World scientific. [ Links ]
Hotelling, H. 1933. Analysis of a complex of statistical variables into principal components. Journal of Educational Psychology 24(6): 417-441. [ Links ]
Insam, H.; Domsch, K.H. 1988. Relationship between soil organic carbon and microbial biomass on chronosequences of reclamation sites. Microbial ecology 15: 177-188. [ Links ]
Insam, H.; Haselwandter, K. 1989. Metabolic quotient of the soil microflora in relation to plant succession. Oecologia 79: 174-178. [ Links ]
Jiang, Y.; Sun, B.; Jin, C.; Wang, F. 2013. Soil aggregate stratification of nematodes and microbial communities affects the metabolic quotient in an acid soil. Soil Biology and Biochemistry 60: 1-9. [ Links ]
Kandeler, E. 2015. Physiological and biochemical methods for studying soil biota and their function. p. 53-83. In: Eldor, P. ed. Soil Microbiology, Ecology and Biochemistry Fourth Edition. Academic Press-Elsevier. [ Links ]
Karhu, K.; Auffret, M.D.; Dungait, J.A.; Hopkins, D.W.; Prosser, J.I.; Singh, B.K.; Gouriveau, F. 2014. Temperature sensitivity of soil respiration rates enhanced by microbial community response. Nature 513: 81. [ Links ]
Kaschuk, G.; Alberton, O.; Hungria, M. 2010. Three decades of soil microbial biomass studies in Brazilian ecosystems: lessons learned about soil quality and indications for improving sustainability. Soil Biology and Biochemistry 42: 1-13. [ Links ]
Kunito, T.; Isomura, I.; Sumi, H.; Park, H.D.; Toda, H.; Otsuka, S.; Nagaoka, K.; Saeki, K.; Senoo, K. 2016. Aluminum and acidity suppress microbial activity and biomass in acidic forest soils. Soil Biology and Biochemistry 97: 23-30. [ Links ]
Kumar, U.; Shahid, M.; Tripathi, R.; Mohanty, S.; Kumar, A.; Bhattacharyya, P.; Jambhulkar, N.N. 2017. Variation of functional diversity of soil microbial community in sub-humid tropical rice-rice cropping system under long-term organic and inorganic fertilization. Ecological Indicators 73: 536-543. [ Links ]
Lai, L.; Zhao, X.; Jiang, L.; Wang, Y.; Luo, L.; Zheng, Y.; Chen, X.; Rimmington, G. M. 2012. Soil respiration in different agricultural and natural ecosystems in an arid region. PloS one 7(10): e48011. [ Links ]
Lammel, D.R.; Azevedo, L.C.B.; Paula, A.M.; Armas, R.D.; Baretta, D.; Cardoso, E.J.B.N. 2015. Microbiological and faunal soil attributes of coffee cultivation under different management systems in Brazil. Brazilian Journal of Biology 75: 894-905. [ Links ]
Lauber, C.L.; Hamady, M.; Knight, R.; Fierer, N. 2009. Pyrosequencing-based assessment of soil pH as a predictor of soil bacterial community structure at the continental scale. Applied and Environmental Microbiology 75: 5111-5120. [ Links ]
Mooshammer, M.; Wanek, W.; Hämmerle, I.; Fuchslueger, L.; Hofhansl, F.; Knoltsch, A.; Schnecker, J.; Takriti, M.; Watzka, M.; Wild, B.; Keiblinger, K.M.; Zechmeister-Boltenstern, S.; Richter, A. 2014. Adjustment of microbial nitrogen use efficiency to carbon: nitrogen imbalances regulates soil nitrogen cycling. Nature communications 5: 3694. [ Links ]
Navarrete, A.A.; Tsai, S.M.; Mendes, L.W.; Faust, K.; de Hollander, M.; Cassman, N.A.; Raes, J.; van Veen, J.A.; Kuramae, E.E. (2015). Soil microbiome responses to the short‐term effects of Amazonian deforestation. Molecular ecology 24: 2433-2448. [ Links ]
Oliveira, S.P.; Cândido, M.J.D.; Weber, O.B.; Xavier, F.A.S.; Escobar, M.E.O.; Oliveira, T. S. 2016a. Conversion of forest into irrigated pasture I. Changes in the chemical and biological properties of the soil. Catena 137: 508-516. [ Links ]
Oliveira, S. P., Cândido, M. J. D., Weber, O. B., Xavier, F. A. S., Escobar, M. E. O., & Oliveira, T. S. 2016b. Conversion of forest into irrigated pasture II. Changes in the physical properties of the soil. Catena 143, 70-77. [ Links ]
Paz-Ferreiro, J.; Fu, S. 2016. Biological indices for soil quality evaluation: Perspectives and limitations. Land Degradation & Development 27: 14-25. [ Links ]
Philippot, L.; Raaijmakers, J.M.; Lemanceau, P.; Van Der Putten, W.H. 2013. Going back to the roots: the microbial ecology of the rhizosphere. Nature Reviews Microbiology 11: 789-799. [ Links ]
Pietri, J.C.-A.; Brookes, P.C. 2008. Relationships between soil pH and microbial properties in a UK arable soil. Soil Biology and Biochemistry 40: 1856-1861. [ Links ]
Pietri, J.A.; Brookes, P.C. 2009. Substrate inputs and pH as factors controlling microbial biomass, activity and community structure in an arable soil. Soil Biology and Biochemistry 41: 1396-1405. [ Links ]
Qinling, Z.; Zhanbin, L.; Ying, L. 2018. Study of Soil Microbiological Character at Different Altitudes in the Region of Dry and Hot River Valley. Nature Environment and Pollution Technology 17: 1-10. [ Links ]
Rampelotto, P.H.; de Siqueira F.A.; Barboza, A.D.M.; Roesch, L.F.W. 2013. Changes in diversity, abundance, and structure of soil bacterial communities in Brazilian Savanna under different land use systems. Microbial Ecology 66: 593-607. [ Links ]
Rashid, M.I.; Mujawar, L.H.; Shahzad, T.; Almeelbi, T.; Ismail, I.M.; Oves, M. 2016. Bacteria and fungi can contribute to nutrients bioavailability and aggregate formation in degraded soils. Microbiological Research 183: 26-41. [ Links ]
Ríos-Ruiz, W.F.; Barrios-López, L.; Rojas-García, J.C.; Valdez-Nuñez, R.A. 2019. Mycotrophic capacity and diversity of native arbuscular mycorrhizal fungi isolated from degraded soils. Scientia Agropecuaria 10: 99-108. [ Links ]
Santos, C.A.D.; Krawulski, C.C.; Bini, D.; Goulart Filho, T.; Knob, A.; Medina, C.C.; Filho, G.A.; Nogueira, M.A. 2015. Reclamation status of a degraded pasture based on soil health indicators. Scientia Agrícola 72: 195-202. [ Links ]
Signor, D.; Deon, M.D.I.; Camargo, P.B.D.; Cerri, C.E.P. 2018. Quantity and quality of soil organic matter as a sustainability index under different land uses in Eastern Amazon. Scientia Agricola 75: 225-232. [ Links ]
Silva, A.O.; da Costa, A.M.; Teixeira, A.F.S.; Guimarães, A.A.; dos Santos, J.V.; Moreira, F.M.S. 2018. Soil microbiological attributes indicate recovery of an iron mining area and of the biological quality of adjacent phytophysiognomies. Ecological Indicators 93: 142–151. [ Links ]
Singh, K.; Trivedi, P.; Singh, G.; Singh, B.; Patra, D.D. 2016. Effect of different leaf litters on carbon, nitrogen and microbial activities of sodic soils. Land Degradation & Development 27: 1215-1226. [ Links ]
Soil Survey Staff. 2014. Soil survey field and laboratory methods manual. Soil survey investigations Report No. 51, Version 2.0, R. Burt and Soil Survey Staff. ed. U.S. Department of Agriculture, Natural Resources Conservation Service. [ Links ]
Soil Survey Staff. 2015. Illustrated guide to soil taxonomy. USDA-Natural Resources Conservation Service, National Soil Survey Center, Lincoln, Nebraska. USA [ Links ]
Spurgeon, D.J.; Keith, A.M.; Schmidt, O.; Lammertsma, D.R.; Faber, J.H. 2013. Landuse and land-management change: relationships with earthworm and fungi communities and soil structural properties. BMC ecology 13: 46. [ Links ]
Silva, M.; Sales, A.; Magalhães-Guedes, K.; Ribeiro Dias, D.; Schwan, R.F. 2013. Brazilian Cerrado soil actinobacteria ecology. BioMed Research International ID 503805: 1-10.
USDA, Natural Resources Conservation Service Soils. 2018. Soil Texture Calculator. NRCS Soils. Available at: https://www.nrcs.usda.gov/wps/portal/nrcs/detail/soils/survey/?cid=nrcs142p2_054167 [ Links ]
Walkley, A.; Black, I.A. 1934. An examination of the Degtjareff method for determining soil organic matter, and a proposed modification of the chromic acid titration method. Soil Science 37: 29-38. [ Links ]
Xu, X.; Schimel, J.P.; Thornton, P.E.; Song, X.; Yuan, F.; Goswami, S. 2014. Substrate and environmental controls on microbial assimilation of soil organic carbon: a framework for Earth system models. Ecology Letters 17: 547-555. [ Links ]
Xu, X.; Schimel, J.P.; Janssens, I.A.; Song, X.; Song, C.; Yu, G.; Thornton, P. 2017. Global pattern and controls of soil microbial metabolic quotient. Ecological Monographs 87: 429-441. [ Links ]
Zagatto, M.R.G.; Pereira, A.P.A.; de Souza, A.J.; Pereira, R.F.; Baldesin, L.F.; Pereira, C.M.; Lopes, R.V.; Cardoso, E.J.B.N. 2019. Interactions between mesofauna, microbiological and chemical soil attributes in pure and intercropped Eucalyptus grandis and Acacia mangium plantations. Forest Ecology and Management 433: 240–247. [ Links ]
Zhang, H.; Wang, R.; Chen, S.; Qi, G.; He, Z.; Zhao, X. 2017. Microbial taxa and functional genes shift in degraded soil with bacterial wilt. Scientific reports 7:39911. [ Links ]
Zhou, Z.; Zhang, Z.; Zha, T.; Luo, Z.; Zheng, J.; Sun, O.J. 2013. Predicting soil respiration using carbon stock in roots, litter and soil organic matter in forests of Loess Plateau in China. Soil Biology and Biochemistry 57: 135143. [ Links ]
Corresponding author
E-mail: wrios@unsm.edu.pe (W.F. Ríos-Ruiz)
Received November 3, 2018.

