Introduction
In recent years, camu-camu agronomic and genetic research has been highly active. Different aspects have been covered such as fertilization (Abanto et al., 2019; Ferreira et al., 2019; Panduro et al., 2016 and Abanto et al., 2015a, Abanto et al., 2015b), the control of the fruit weevil (Conotrachelus dubiae), defoliation (Pinedo et al., 2017; Durand et al., 2017), pruning and planting density (Durand et al., 2017), fruit retention (Pinedo et al., 2018), carbon sequestration (Diaz et al., 2015) and commercialization (Braga et al., 2018). Progenies and individuals with low levels of incidence of fruit weevil and jumping louse (Tuthillia cognata) were identified, which could mean tolerance or resistance to attack by these important pests (Pinedo et al., 2017).
One of the limitations of camu-camu cultivation is low productivity. Among the causes is the low genetic quality of the seed that has been used in the productive plots. The progress in the pre-improvement works (collection, evaluation, selection) of the species is significant, mainly in Peru (Pinedo et al., 2017) and Brazil (Bardales et al., 2016) with a wide studied sample for four decades. However, we appreciate, as an information gap, the lack of long-term analysis that integrates fragmented progress over time and geographic coverage. So that we can have identified and accessible, reliable select material as a product of various measurements (4 to 10) or harvests.
The genetic selection of superior matrices, especially in fruit trees, has allowed significant progress in favor of their sustainable use. For example, the evaluation of naranjilla (Solanum quitoense Lam.) progenies from interspecific crosses (Silva et al., 2016). Likewise, the selection of hybrids with high performance and resistance to Moniliasis (Solis et al., 2015). In non-arboreal fruit trees such as mulberry (Rubus glaucus Bentham), promising genotypes were selected for the size and color of the fruit, the total content of soluble solids and other morphological markers (Sánchez et al., 2020).
About camu-camu, INIA-Iquitos, during 1986-1988, collected 39 populations in the Ucayali, Amazonas, Marañón and Napo rivers, and evaluated them for 15 years. Ten plants stood out for fruit yield, in floodplains of black water (island of Muyuy) and 10 in soils of highland, with yields between 6 and 25 t ha-1 at 11 years of age (Mendoza et al., 1989).
In IIAP, in the years 2005 and 2006, 715 precocious plants were pre-selected. During 2007, 2008 and 2009, progenies and individuals were evaluated and selected according to vegetative parameters and highlighted the progenies 21 and 222. This analysis showed that early selection by vegetative parameters is important but not definitive in formation for the selection of higher plants according to fruit yield (Pinedo and Paredes, 2011).
In the last 15 years, basic collections, and genetic tests of camu-camu are being evaluated at the San Miguel Experimental Center (CESM-IIAP), which has allowed the increase of the genetic base with top material. Higher plants have been identified in terms of fruit yield, vitamin C content, pest tolerance and other agronomic characteristics.
In the CESM-IIAP, the sixth evaluation of vegetative and reproductive parameters of 37 clones was carried out, which were evalu ated consecutively at 5, 9, 23, 35, 46 and 58 months after planting. At 5 years of age, significant differences were found between clones with respect to canopy diameter (Fc = 10.44, Sig = 0.00) and number of flowers (Fc = 3.46, Sig = 0.019). No significant differ ences were found regarding the parameters basal stem diameter (Fc = 1.773, Sig = 0.157), total basal stem diameter (Fc = 0.368, Sig = 0.76), plant height (Fc = 2.088, Sig = 0.106), number of basal branches (Fc = 0.163, Sig = 0.921) and number of fruits (Fc = 0.76, Sig = 0.55) (Pinedo and Paredes, 2011). Smíd et al., (2017) confirms the high genetic diversity between natural and cultivated populations using molecular markers and the great potential for genetic improvement work.
We present the evaluations in an advanced genetic test of 43 progenies, installed in 2010, at CESM. The evaluation was carried for four years, to select progenies and indi viduals in accordance with the camu-camu genetic improvement plan (Pinedo et al., 2004). These results will provide a reference on the productivity and will serve as a basis for subsequent productivity analysis and consistent selection.
Materials and methods
This work was installed in 2010 and carried out in the Experimental Center “San Miguel” -CESM-IIAP, located on the left bank of the Amazon River, 10 km upstream from the city of Iquitos, between the coordinates 3° 40´ and 3° 45´ South Latitude and 73° 10´ and 73° 11´ West Longitude. The place is floodable located on the banks of the Amazon river, locally known as restinga, classified globally as a wetland (ecosystem permanently or seasonally flooded), globally or as a varzea (floodplains are known to be arable land alongside rivers) in Brazil; with an average temperature of 26 °C, rainfall of 2911.7 mm/year (Pinedo et al., 2018). 43 progenies were installed on a plot of 2580 m2. in ran domized form, with 10 repetitions or half-sisters, experimental units made up of a single plant and distance of 3 x 2 meters. The progenies come from CESM-IIAP-Iquitos, INIA-Loreto and IIAP-Pucallpa. The matrices were chosen for their high yields and stability in the production of fruit during several years of study.
Independent variables evaluated
The descriptors evaluated and analyzed were:
Plant height, number of basal branches (at a maximum height of 50 cm above the ground and at least 2 cm in diameter), number of terminal branches, percentage of fruits attacked by fruit weevil (Conotrachelus dubiae), number of fruits/plant (state 5 to 8), fruit weight (g) (sample of 20 fruits/plant), fruit yield (g) (number of fruits x average weight of the fruit), potential for hydrogen radicals (pH) (on a 30 ml sample of fresh pulp), fruit, pulp and seed weight (average mass from 25 measurements), petiole length, limbo length, limbo width (expressed in millimeters), basal stem diameter (under the first branch, precision to the decimilimeter).
Statistical design
The completely randomized design was applied at progeny level and not by individuals, with the same number of repetitions and one plant per experimental unit; that is, a total of 43 families were evaluated, with ten repetitions each, totaling 430 individuals. For the statistical analyzes the SPSS Version 20 and Selegen-Reml/Blup basic model 63 programs were used. For the selection of supe rior genotypes through a multiannual analysis, model 63 was applied: basic repetitive ness model without delineation (Carias et al., 2016). The statistical model responds to the expression: y = Xm + Wp + e; where “y” is the vector of each of the data “m” vector of the measurement effects (assumed as fixed) added to the general mean “p” vector of the permanent effects (genotypic effects+environmental effects) assumed as random and “e” vector of errors or residuals (random). The capital letters represent the incidence matrices for the afore mentioned effects.
The results obtained were expressed in (a) components of variance (b) efficiency of use of the number of measures and (c) genotypic values with the selection of individuals or progeny (Tables 1 and 2).
The variance components are Vfp: Permanent phenotypic variation between plants (genotypic + permanent environmental from one crop to another); Vet: Variation of temporary environment; Vf: Individual phenotypic variance r = h2: individual repetitiveness rm: repetitiveness of the average of m crops o repeated measures and Acm: precision of the selection based on the average of m crops or repeated measures.
The efficiency of using "m" measures (annual evaluations, which in this case are three) was given by three parameters: determination (coefficient), precision (obtained with m repeated measures) and efficiency (of m measures compared to only one). Accuracy in the range of 0.10 to 0.39 is considered low, values of 0.45 to 0.63 are considered medium or moderate values and values greater than 0.71 are high (Resende, 2002).
The selection of individuals was based on the value of “fp” is permanent phenotypic effect and “u + fp” is permanent phenotypic value, genetic gain, and the new mean as the basis for selection in order of decreasing merit.
The genotypic values of each plant were es timated by: ĝ = MG + βp (MP i - MG) in which: βp = [m ṗ /(1+(m-1) ṗ)] is the coefficient of de termination of the permanent phenotypic value or repetitiveness of the mean of M: 4 measurements in the individual; ṗ: estimate of individual repetitiveness; MG: general average of the plants in several measurements; MP i : general mean of the plant i in the various measurements.
MP is the sum of these variance components, according to Resende (2002), the repetitiveness classification is: high (greater than 0.60), medium (between 0.30 to 0.60) and low (less than 0.30). The same author classifies heritability in the restricted sense as low (between 0.01 to 0.015), medium or moderate between (0.15 to 0.50) and high (greater than 0.50).
Results and discussion
Below we present the results and discussions for the period 2010-2017 in 43 progenies (430 plants) of the plot under study. These results are grouped into 4 sections: fruit yield, repetitivity analysis (vegetative, reproductive, and chemical), correlations, and selections.
Fruit yield
Figure 1 shows a yield range of 1.6 to 2.4 kg.pl-1 of fresh fruit for the top ten individuals among 43 camu-camu progenies evaluated after 4 years of planting in the flood area of the trial under evaluation. It corresponds to the second year of production.
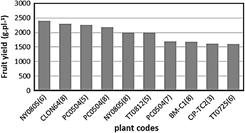
Legend-Plants origin (River-Lake or Farmer-River): NY (Napo-Yuracyacu), CLON64 (Putumayo-Cedro), PC (Putumayo-Cedro), TT (Tigre-Tipishca), BM (Bernardo Mahua-Ucayali), CIP (Tito Caballero-Ucayali).
The yield range of 1.6 to 2.4 kg plant-1, for the top ten individuals among 43 progeny, shown in Figure 1, is within the expected ranges for maximum production plants.
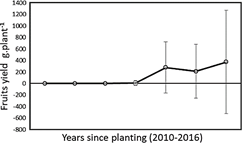
In Figure 2, the yield curve from the third to the sixth year after planting is presented.
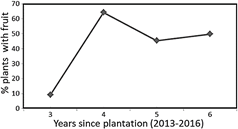
In the third year, the harvest was very small, with an average of 10 g of fruit per plant, which is related to the low percentage of plants that began to fructify, which reached only 10% of the total plants evaluated. In this regard Pinedo et al. (2017), found that said percentage, also in the third year, reached 25%. Figure 4 shows that fruiting begins at the third year of planting with 10% of the plants.
Table 1 Repetitivity analysis of four harvests for “average fruit weight” of 43 camu-camu progenies
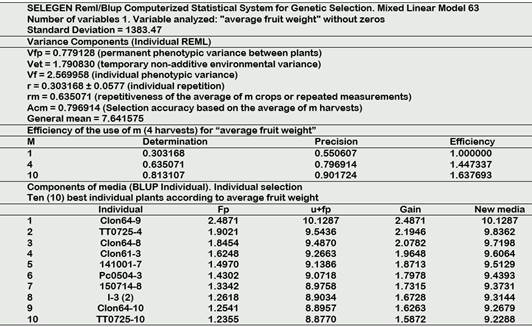
Legend-Plants origin: Clon64 (Putumayo-Cedro), TT (Tigre-Tipichca), Clon61 (Putumayo-Cedro), 141001 (Nanay-Samito), Pc (Putumayo-Coto), 150714 (Nanay-Yuto), I-3 (Ucayali-Pucallpa).
The mentioned alternance is attributed to adverse environmental factors, which may be related to the presence of pests and the minimization of the development of fruitful branches. It is worth mentioning that in the present study, it was preferred not to apply agronomic improvement techniques to favor genetic expression. In the case of the clones evaluated by Pinedo et al. (2017), the trend in terms of long-term fruit yield was similar. Therefore, stake propagated plants were not found to have higher yields than sexual propagated plants. Even if Mathews et al. (2016) for camu-camu in the first 3 years of development, they found superior performance of plants propagated by cuttings compared to plants propagated by sexual seeds.
Almeida (2014) evaluated the initial development of the selected plants for their high content of ascorbic acid (≥ 3000 mg/100 g). Depending on growth and earliness (18 months from sowing), four individuals from the Uatuma River population were recommended. However, it was evidenced that those plants with high vegetative values, during the first three years, did not have high levels of fruit yield. This contradiction left doubts about the applicability of early vegetative parameters (basal stem diameter, plant height, number of basal shoots) for indirect predictive selection of fruit productivity. Sánchez (2020), when evaluating for 8 years the same material as in this study (NYO805, NYO518, TTO725, CLON52 and 151910), found a high yield of fruit and ascorbic acid, which demonstrated the ge netic gain of the individual selection in a different geographical area (Pucallpa).
In Figure 2 the average trend of fruit yield from the third to the sixth year after planting is presented. In the third year the harvest was very small, around 10 g of fruit plant-1. This, due to the low percentage of plants that began to fructify (10% of the total plants evaluated).
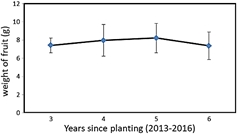
It can be seen in Figure 3, that the average weight of the fruit increases slightly with the age of the plant in the first three years of harvest, a trend that apparently changes towards lower levels in the fourth year of harvest. The range is wide between 2 and 14 g and the average remain at the usual level of 8 g (Pinedo et al., 2004).
Figure 4 shows the percentage of plants that begin fruiting during the 4 years of evaluation. Said percentage reached 10% of plants with fruit, 3 years after planting. The large increase registered in the fourth year (64%) contrasts with the reduction presented in the last two years. Alternance, that is common under low input conditions in flood areas such as the one studied (Iman, 2000).
Repetitivity analysis
In Table 1, the repetitivity analysis for the average fruit weight shows a coefficient r that reaches relatively high levels in the fourth harvest, with a general average (7.64) that approximates frequent values in basic genetic material. As you can see, the coefficient improves with the repetition of measurements until reaching the value of rm = 0.63 in the fourth measurement or year, precision of 0.797 and efficiency of 1.4473. The order of merit for this descriptor places Clone 64-9 first with 10.13 g exceeding the value of the ideotype.
Regarding the average weight of the fruit, the coefficient r reached relatively high levels of rm = 0.635 in the fourth harvest, precision of 0.797 and efficiency of 1.447. The order of merit for this descriptor places the individual Clone64-9 first with 10.13 g that slightly exceeds the value of the ideotype established in the Genetic Improvement Plan (Pinedo et al., 2004). For this variable, Pinedo et al. (2014) found with 3 harvests an r=0.083 for the initial material, which in the fourth year reached an rm=0.268. Explainable by the greater progress in the selection of the majority of the 43 descendants evaluated. However, in the case of the 37 clones evaluated, Pinedo et al. (2017) calculated for the average weight of the fruit, a remarkable value of r = 0.690, which in the fourth year reached an extremely high value of rm = 0.899. This allowed a precision of 0.948. In this case, the improved mean reached a value similar to this test of 43 offspring of 10.041 g. When studying another tropical fruit such as Solanum quitoense (Morillo et al., 2019) they discovered that the weight of the fruit was also one of the most representative variables due to its influence on intraspecific variability and its potential for the selection of higher plants.
The results of the repetitivity analysis for fruit yield in Table 2 show as a result a value of r = 0.189 (intermediate), the same that in the fourth harvest reached rm = 0.48 with a precision of Acm = 0.694. In the individual selection, the TT population (Tigre-Tipishca) occupies the first three places and the TT0725 individual stands out with three half-sisters present in the merit table.
For 16 analyzed markers, Table 3 shows the repetitivity, precision and efficiency coeffi cients, where the descriptor: plant height, with r = 0.44, is notable for greater genetic control. The same that in the fourth year it reached a value of rm = 0.611 and that in the tenth year it would reach r10 = 0.887. Another important descriptor for indirect selection is petiole length, which reached rm = 0.475.
The results for fruit yield are shown in Table 3, which reach an intermediate level (r = 0.19), and in the fourth harvest it increases to rm = 0.48 with a selective precision of Acm = 0.69. Oliva et al. (2014) also with camu-camu ecotypes from the Peruvian Amazon, found similar values to those of the present study. With four harvests of 28 provenances and 770 plants, they found an individual repetitivity for the fruit yield of r = 0.19 that in the fourth harvest increased to rm=0.49 with a selective precision of Acm = 0.70. According to these authors, it can be inferred that the heritability for fruit yield is considered moderate. In this regard, Resende (2002) indicated that the estimation of repetitivity is important, because it imposes an upper limit on the value of heritability in a broad sense.
In the case of the fruit yield of 37 camu-camu clones, Pinedo et al. (2017) found a comparatively lower value of r = 0.117 than in the fifth harvest reached rm=0.398 with an accuracy of 63%. This inferiority is also attributed to the lower advance in selective terms of said marker.
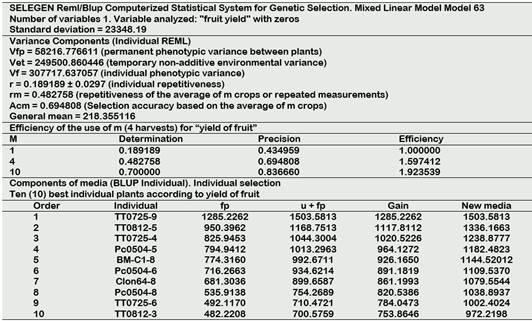
Lejend-Plants Origin: TT(Tigre-Tipishca), Pc(Putumayo-Coto), BM-C(Bernardo Mahua-Ucayali), Clon64(Putumayo-Ce dro).
Oliva and Chura (2010), also calculated that for a precision of 77% in the selection with a determination of 59%, 6 harvests must be evaluated. Regarding our results for the 43 advanced progenies, at 6 years an accuracy of 76.37% would be reached with a determination of 58.33% (Table 3), which is close to the projection of the mentioned authors.
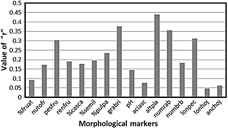
Lejend: %fruat: % attacked fruits, nutofr: total number of fruits, pesfru: average fruit weight; renfru: fruit yield, %casca: %fruit peel, %semil: %seed, %pulpa: %pulp, grabri: brix degree; pH: pH, aciasc: ascorbic acid content, altpla: plant heigh, numrab: number of basal branches, numbrb: number of basal shoots, lonpec: length of petiole, lonhoj: leaf length, anchoj: leaf width.
In Figure 5, five markers of greater genetic control are shown, of which the most predictive for the possibility of evaluating them in the short term are: plant height and petiole length.
Correlations
Table 4 shows the interrelationships be tween fruit yield versus vegetative markers of higher predictive capacity and more easily measurable. These results in combination with the repetitivity or heritability indexes will allow priority descriptors to be chosen for the selection. For example, the significant negative correlation between "petiole length" and "leaf width" with yield. A descriptor that should also be considered is "plant height" which also showed a significant correlation with fruit yield. For later years, no correlation was obtained between these two variables, apparently with the growth and development of the plant, which weakens the relationship. In the case of plant height, the correlation was optimal two years after planting. Therefore, attention should be paid to the age when the correlation is significant to obtain more reliable results.
In Table 4 we find a significant correlation between the height of the plant and the yield in the first harvest (2013) r2 = 0.316* (Table 4) but in the following years (2014, 2015 and 2016) the correlation was of a lower level and turned negative. This trend is probably due to the development of the plant architecture as time passes. Therefore, this correlation presents an opportunity to consider that it would be 2 years after planting. Other researchers also found a significant correlation between these two descriptors for 5 clones in the case of Pinedo et al. (2011) with r2 = 0.142* and highly significant between plants of different ages and locations. Interestingly, the significant negative correlation between petiole length and leaf width with productivity in 2016, with values of r2 = - 0.152* and r2 = - 0.150* respectively. Analyzing the consistency of these correlations of the parameters and yields of the leaves, we can count on Pinedo et al. (2011) who found a relatively high (but positive) value of r2 = 0.371. Pinedo et al. (2017) with a high value of r2 = 0.521** evidenced another important relationship between petiole length with pulp ascorbic acid content.
The leaf width and leaf length correlations with the ascorbic acid content showed significant values of r2 = 0.204 * and r2 = 0.212*, (Table 4), so it is important to pay attention to these parameters in future evaluations.
A similarity analysis was applied among the 20 highest-yielding plants with the best according to the 16 markers, in order to corroborate the correlation analyzes complemented with those of repetitivity or heritability. This similarity analysis will allow us to glimpse the validity of an indirect and early selection through vegetative characteristics.
Indirect selection of superior camu-camu genotypes using vegetative markers that could be evaluated early, along with calculations of heritability, repetitivity, and correlation with traits of economic interest, may be feasible. Maia et al. (2016), allude to this strategy and propose for "casho" (Anacardium occidentale L.) a system of intensive early selection, based on early descriptors and high heritability. Estimating the repetitivity in the selection of genetically superior trees can provide an improvement in the use of resources, a greater precision in the evaluation and less time in obtaining new cultivars due to the shorter selection cycle. The analysis of the correlations between the morphological markers and the heritability indexes are important for the precision of the superior plant selections. In this sense, Pires et al. (2017) present an integrated method to evaluate selection indices in eucalyptus where correlation analysis is applied, multivariate and its interaction with heritability.
The present study showed us that the markers with the highest genetic control capabilities that are equal to or greater than r = 0.30 are the average fruit weight, degrees Brix, plant height, number of basal branches and petiole length. Of these, vegetative descriptors are preferable because of their predictive ability before fruiting. So, plant height and petiole length would be the applicable values for an indirect and early selection.
Table 3 Summary of repetitivity analysis for 43 camu-camu progenies
| Marker | m | zeros | r | Rm | Precision | Eficciency | X | r10 |
| %fruat | 4 | No | 0.013 | 0.051 | 0.227 | 1.960 | 30.044 | 0.120 |
| Nutofr | 4 | Si | 0.172 | 0.454 | 0.674 | 1.624 | 35.243 | 0.822 |
| Pesfru | 4 | No | 0.303 | 0.635 | 0.797 | 1.447 | 7.641 | 0.813 |
| Renfru | 4 | Si | 0.189 | 0.483 | 0.695 | 1.597 | 217.355 | 0.700 |
| %casca | 3 | Si | 0.178 | 0.395 | 0.628 | 1.487 | 6.502 | 0.685 |
| %semil | 3 | Si | 0.195 | 0.422 | 0.649 | 1.468 | 6.963 | 0.708 |
| %pulpa | 3 | Si | 0.235 | 0.480 | 0.693 | 1.428 | 21.036 | 0.754 |
| Grabri | 2 | No | 0.377 | 0.547 | 0.740 | 1.205 | 5.623 | 0.858 |
| pH | 2 | Si | 0.145 | 0.254 | 0.504 | 1.321 | 0.398 | 0.630 |
| Aciasc | 2 | No | 0.077 | 0.142 | 0.377 | 1.363 | 1708.00 | 0.463 |
| Altpla | 2 | Si | 0.440 | 0.611 | 0.782 | 1.178 | 2.167 | 0.887 |
| Numrab | 2 | Si | 0.356 | 0.525 | 0.725 | 1.214 | 1.980 | 0.847 |
| Numbrb | 2 | No | 0.183 | 0.310 | 0.556 | 1.300 | 1.938 | 0.691 |
| Lonpec | 2 | No | 0.311 | 0.475 | 0.689 | 1.235 | 5.354 | 0.819 |
| Lonhoj | 2 | No | 0.046 | 0.088 | 0.296 | 1.383 | 68.152 | 0.324 |
| Anchoj | 2 | No | 0.062 | 0.116 | 0.341 | 1.372 | 29.126 | 0.397 |
Lejend: %fruat: % attacked fruits, nutofr: total number of fruits, pesfru: average fruit weight; renfru: fruit yield, %casca: %fruit peel, %semil: %seed, %pulpa: %pulp, grabri: brix degree; pH: pH, aciasc: ascorbic acid content, altpla: plant heigh, numrab: number of basal branches, numbrb: number of basal shoots, lonpec: length of petiole, lonhoj: leaf length, anchoj: leaf width.
Table 4 Important and statistically significant correlations in genetic testing of 43 camu-camu progenies
| Descriptor | lonpec | nutofr | pesfru | Pesfru | aciasc | Renfru |
| Altpla | 0.165** | 0.164* | 0.124* | 0.201** | 0.316* | |
| Diabas | 0.183** | 0.163** | 0.163* | |||
| Numrab | 0.137** | 0.174* | ||||
| Numrat | 0.194** | 0.170* | ||||
| Anchoj | 0.237** | 0.191* | 0.204* | |||
| Lonhoj | 0.212* | |||||
| Renfru | -0.152* | 0.970 | 0.301** | 0.241* |
Pearson coefficient significance (*p = 0.95; **p = 0.99).
Legend: lonpec: length of petiole, nutofr: total number of fruits, pesfru: average fruit weight. aciasc: ascorbic acid content, altpla: plant heigh, diabas: basal diameter, numrab: number of basal branches, numrat: number of terminal branches, anchoj: leaf width, lonhoj: leaf length, renfru: yield fruit.
Matias et al. (2016) studied the relationship between the traits of 28 peach cultivars and their direct and indirect effects on the content of ascorbic acid and carotenoids. The yellow color of the pulp was found to have the potential for indirect selection for carotenoid content. In contrast, Quijano (2020), found many polymorphic bands in samples of Pouteria lúcuma collected in northern Peru, but with low genetic differentiation between the areas of origin of the samples.
Among the selections for 16 morphological markers, we consider that the fruit yield is the most important for its economic value. We could select reliable genetic material for each marker, which we can classify according to its use in: a) Of direct interest and utility, such as fruit yield, total number of fruits, ascorbic acid content, average fruit weight, % of peel, % seed and % pulp. This taking into account that in recent years the shell and the seed have also been products with demand in the market for dehydrated products and b) Of indirect interest due to their probable relationship or interdependence that they may have with the descriptors of group a. There, the remaining 9 descriptors are considered.
On correlations, repetitivity and degree of similarity between the descriptors, we can deepen the analysis to identify useful tools for selecting superior genotypes.
The plant height descriptor for having a significant correlation with fruit yield, (r2 = 0.316 *) consistent with high levels of similarity repetitivity (s = 0.65) (r = 0.44) may be the best indicator that allows the indirect selection and predictive value in the first months of plant age. Discrimination due to plant height can be favorably carried out in the first year of planting. Due to the similarity with the yield (s = 0.70) the shell percentage, also shows a highly significant and negative relationship of r2= - 0.183**. However, to apply this predictor we would have to wait for the first harvest. The very low value of the heritability of ascorbic acid (r = 0.08) is already known (Pinedo, 2013). But there is a significant correlation with performance (r2 = 0.241*), so it is necessary to emphasize this trend by testing with enough clones to calculate heritability more accurately. However, given the low genetic control of the content of ascorbic acid, the agronomic management option is viable given the significant positive correlation with the nutrients of magnesium and phosphorus in the soil and negative with aluminum (Abanto et al., 2016). Concomitantly, Guijarro et al. (2017) when studying Diplotaxis erucoides, they found a strong environmental dependence on the content of ascorbic acid in the leaves, the same that was higher in field conditions compared to the greenhouse.
On a larger scale, when we talk about plant selection, it is pertinent to mention the correspondence between variability and environmental conditions. In other words, the varieties with the best performance in one geographic area will not necessarily be the best in another relatively distant region. In camu-camu, observations were made in this regard when comparing relatively distant natural populations (Pinedo et al., 2011). So too, when selecting variants of Carica papaya, Alvarez et al. (2019) found important differences between studied localities, and the need for varietal adaptation to local conditions.
Selections
During the years 2013 to 2016, individual selections were made according to 16 morphological markers, the most important being:
Plant height (altpla): 140907 (7), TT0812 (5), 141107 (10), BMC1 (5) , BMC1 (7), TT0812 (7), 141707 (7), 140907 (1), 141707 (6), 141805 (2).
Average fruit weight (pesfru): Clon64-9, TT0725-4, Clon64-8, Clon61-3, 141001-7, Pc0504-3, 150714-8, I3-2, Clon64-10, TT0725-10.
Fruit yield (yield): TT0725-9, TT0812-5, TT0725-4, Pc0504-5, BMC1-8, Pc0504-6 Clon64-8, Pc0504-8, TT0725-6, TT0812-3.
Ascorbic acid (aciasc) content: Ct0818 (5), Clon64 (8), 04-15-01 (7), Clon61 (3), I-3 (8), NN0323 (3), NY0805 (5), 14 - 02-09 (2), Ct0818 (6), NY0805 (8).
% of attacked fruits (% of fruit): BMC1-1, PVC3-8, 11-15-01-2, TT0725-10, Pc0504-4141101-2, TT0725-2, 150205-3, NY0805-10, 141004- Four.
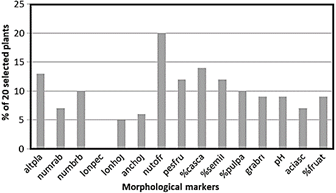
Figure 6 Degree of similarity among the 20 selected individuals with the highest fruit yield compared to the 20 individuals selected by 15 descriptors. Legend: altpla: plant heigh, numrab: number of basal branches, numbrb: number of basal shoots, lonpec: length of petiole, lonhoj: leaf length, anchoj: leaf width, nutofr: total number of fruits, pesfru: average fruit weight, %casca: %fruit peel, %semil: %seed, %pulpa: %pulp, grabri: brix degree, pH: pH , aciasc: ascorbic acid content, %fruat: % attacked fruits.
Table 5 Comparison of correlation coefficients and similarity with performance and repetitivity for 16 morphological markers in 43 camu-camu progenies
| Markers | Correlatión with yield (r2) | Similarity with yield (s) | Repeti-tivity (r) |
| Altpla | 0.316* | 0.65 | 0.44 |
| Numrab | 0.429* | 0.35 | 0.36 |
| Numbrb | 0.130 | 0.50 | 0.18 |
| Lonpec | -0.152 | 0.00 | 0.31 |
| Lonhoj | 0.114 | 0.25 | 0.05 |
| Anchoj | - 0.150 * | 0.30 | 0.06 |
| Nutofr | 0.238 ** | 1.00 | 0.17 |
| Pesfru | 0.301 ** | 0.60 | 0.30 |
| %casca | - 0.183 ** | 0.70 | 0.18 |
| %semil | 0.510 | 0.60 | 0.20 |
| %pulpa | 0.540 | 0.50 | 0.24 |
| grabri | 0.139 | 0.45 | 0.38 |
| pH | - 0.207 | 0.45 | 0.15 |
| aciasc | 0.241 * | 0.35 | 0.08 |
| %fruat | 0.125 | 0.45 | 0.09 |
| renfru | 1.000 | 1.00 | 0.19 |
Legend: altpla: plant heigh, numrab: number of basal branches, numbrb: number of basal shoots, lonpec: length of petiole, lonhoj: leaf length, anchoj: leaf width, nutofr: total number of fruits, pesfru: average fruit weight, %casca: %fruit peel, %semil: %seed, %pulpa: %pulp, grabri: brix degree, pH: pH , aciasc: ascorbic acid content, %fruat: % attacked fruits, renfru: yield of fuit.
In the selection for fruit yield of 20 individuals (Table 7), the TT population (Tigre-Tipishca) is present with six individuals (F2) of which three are half-sisters who come from sexual propagation of TT0725 (F1).
For the other markers analyzed, Table 5 summarizes the repetitivity, precision and efficiency coefficients, where the height of the plant stands out due to greater genetic control (r = 0.44). The same that in the fourth year reached a value of rm = 0.611 and that in the tenth would reach a r10 = 0.887. Another important descriptor for its potential for indirect selection is petiole length, which reached rm = 0.475 in the fourth year. In Figure 5, five markers with greater genetic control are highlighted, of which the most predictive for the possibility of evaluating them in the short term are plant height and petiole length. Likewise, Bardales et al. (2016) found a high contribution of plant height (75.99%) to genetic divergence among the populations of Roraima, Brazil.
The interrelationships between fruit yield and the vegetative markers with the highest predictive capacity and the most easily measurable (Table 4) in combination with the repetitivity or heritability indexes will allow choosing priority descriptors as selection criteria. Apparently, the plant height/fruit yield ratio could become one of the first predictive tools for selecting high-yielding individuals.
The main product of the present work, as already mentioned, is the selection of high-performance plants with an r = 0.19 that reached rm = 0.48 in the fourth year of evaluation, 69% precision and an efficiency of 1.59. This test of 43 progenies shows us a different picture of fruit performance compared to previous evaluations of the material. It is observed that the TT progeny (Tigre-Tipishca) stands out with several half-sisters for fruit yield. The lower productive capacity of the absolute control (T MIX) was confirmed, the origin of which was from a heterogeneous sample of material of unknown origin, which did not show good attributes that confirmed its basic nature in terms of selection.
Conclusions
Applying the repetitivity analysis for four harvests, a selection was made for each descriptor under study; Regarding fruit production, the Tipishca population of the Tigre river stood out, occupying 5 of the first 10 places of merit. Two naturals recombinant individuals were detected for three important descriptors: fruit yield, fruit weight, and ascorbic acid content from the Putumayo-Cedro and Tigre-Tipishca rivers.
Regarding the possibilities of indirect selection using heritability and correlation calculations, the descriptors that showed the greatest capacity for genetic control are average fruit weight, brix degree, plant height, number of basal branches and petiole length. Of these, vegetative descriptors are preferable because of their predictive ability before bearing fruit. Of these, the variable height of the plant is considered more appropriate. In addition to the heritability and correlation criteria, the new similarity criterion is proposed.


