1. Introduction
Avocado (Persea americana) is a tropical fruit, native to America, which is found mainly from the north region of South America to Mexico (Gómez-López, 2002; Rosero, Cruz, Osorio, & Hurtado, 2019). Contains an important source of bioactive compounds with effects health benefits (Calderón-Oliver et al., 2016). Hass variety is the most common worldwide (Stahl, Mirom, Stern, & Goldway, 2019). The avocado seed and peel are promising and economical candidates for the recovery of phenolic compounds that can be used in the food, cosmetic or pharmaceutical sector (Figueroa, Borrás-Linares, Lozano-Sánchez, & Segura-Carretero, 2018a). Avocado seed is ~16% of weight of the fruit and presents a good anti-cancer, antihypertensive, anti-inflammatory, anti-diabetic, hypocholesterolemic, insecticidal potential and antimicrobial (Dabas, Shegog, Ziegler, & Lambert, 2013; Calderón-Oliver et al., 2016). Combined use of extraction and detection techniques in liquid chromatography (HPLC) coupled to highly sensitive detectors (quadrupole time of flight (Q-TOF) and mass (MS)) have allowed the identification of groups of phenolic compounds such as condensed tannins, flavonoids and phenolic acids in the seed and shell of avocado (Figueroa et al., 2018b; Kosińska et al., 2012). Extraction of polyphenols is generally carried out using solvents such as methanol and acetone, limiting the use of these extracts as natural additives (Kosińska et al., 2012). In this sense, the use of solvents generally recognized as safe (GRAS) is important (water, ethanol or their mixtures). UAE has been shown to be much more efficient than maceration extraction, yielding 1.77 times higher (Nipornram, Tochampa, Rattanatraiwong, & Singanusong, 2018).
The optimum extraction of phenolic compounds, especially in avocado peel, has been studied by Trujillo‐Mayol, Céspedes‐Acuña, Silva, & Alarcón‐Enos (2019), who used microwaves and ultrasound, in the latter method time and temperature were taken as independent variables. In this research, it is stated the need to optimize the solvent variable (ethanol/water) besides the classic variables of time and temperature; also, it is stated to extrapolate the study to the analysis of phenolics in avocado seed, which has already been studied with the use of microwaves (Weremfo, Adulley, & Adarkwah-Yiadom, 2020). The development of mathematical models such as surface response and neural networks will allow the description of the chemical process of UAE and predict the phenolic yield by effect of temperature, time and ethanol/water concentration (Ramić et al., 2015).
Response surface methodology (RSM) is a tool that combines statistics with mathematics for the optimization of a process that can involve a series of response variables whit the independent variables (Betiku, & Ajala, 2014), this correlation of variables occurs through a second-order equation, providing acceptable results and reducing the number of experimental runs (Betiku, & Ajala, 2014; Onoji, Iyuke, Igbafe, & Daramola, 2017).
Artificial neural networks (ANN) are a learning tool based on information processing similar to the human brain (Betiku, Okunsolawo, Ajala, & Odedele, 2015). Groups of interconnected neurons serve to solve complex nonlinear processes between the input and output variables of a system (Nazghelichi, Aghbashlo, & Kianmehr, 2011; Ameer, Chun, & Kwon, 2017). Therefore, the objective of this work was to model with RSM and ANN the extraction of phenolic compounds in avocado peel and seed, optimizing the temperature, solvent concentration and extraction time.
2. Materials and methods
Avocado of the Hass variety was used at a stage of maturity with 30% of dry matter, suitable for export. The fruits were harvested on the same land and under the same growing conditions in the district of Moro, province of Santa, department of Ancash, Peru (9° 8′ 20″ S and 78° 10′ 59″ W). In general, the experimental procedure presented in Figure 1 was followed. Samples were taken to the laboratories of the Institute of Agroindustrial Research (IITA) of the National University of Santa (UNS), Nuevo Chimbote, Peru, where they were washed and disinfected with sodium hypochlorite at 100 ppm. Later, the fruits were cut transversely to separate peel, seeds and pupa; in order to cut and dry the seeds and peel separately, in an oven (POL.EKO, model SLW-115STD, USA), at a temperature of 40 °C for a period of 24 hours. The samples were taken to a grinding and sifting module (Model MDMT-60XL, Series JP 001 0112), until some flour with a particle size < 1 mm was obtained. Finally, the ground samples were stored in 120 mL amber glass bottles in a drying hood.
2.1. Characterization residues avocado
Moisture of the seeds and peels were obtained with AOAC 931.04 in a POL.EKO stove (model SLW-115STD, USA). Proteins were determined according to the Kjeldahl Method AOAC 2001,11 in a Foss kit (Labtec™ LINE model, China). Fat content was obtained according to AOAC 963.15 in a Foss grease extractor kit, model SOXTEC™ 2043, China). Ashes were calculated by incineration of organic matter based on AOAC 972.15 in a Thermo Scientific ™ muffle (Barnstead Thermolyne™ model, USA). The crude fiber determination was determined according to the NMX-F-090-1978 method in a FOSS equipment (model Fibertec™ 1023, China), which is based on the acid and alkaline digestion of the sample. Finally, the carbohydrate was made by difference: % Carbohydrates = 100 - (% Protein +% Fat +% Ash +% Fiber +% Moisture). The antioxidant activity was determined with the DPPH method (2,2-diphenyl-1-picrylhydrazyl) following the methodology described by Kaderides et al. (2019), a reaction mixture (3 mL) consisting of 1 mL of methanol, 1 mL of DPPH in methanol (0.3 mM), and 1 mL of extract was measured on a UV-visible equipment (Jasco, model: V- 670, USA) at a wavelength of 517 nm, the results were expressed in micro mole of Trolox equivalent/mg of sample (µmol TE/mg).
2.2. Ultrasound-assisted extraction (UEA)
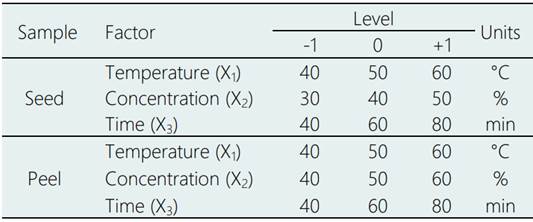
Method of Singanusong, Nipornram, Tochampa, & Rattanatraiwong (2014) with modifications was used. One gram of dry milled sample (seed and peel) was added into glass tubes with caps (30 mL maximum volume) and thoroughly mixed with 20 mL of ethanol / water at three concentrations (Table 2). Ultrasonic Cleaner Cole-Parmer kit (Model 8892-26, Series QPC010698219F, USA) was used as an ultrasound source at a power of 100 W (volumetric power, 25 W/L) and frequency of 42 kHz annealed at the bottom. The liquid level in the submerged tubes was lower than the liquid in the bath for maximum ultrasonic energy. Three temperatures and three analysis times were programmed (Table 2); the samples were subsequently centrifuged at 8000 rpm in 8 min at temperature of 4 °C in a SIGMA Centrifuge unit (model 2-16, series 100978, Germany), the obtained supernatant was called “extract”.
2.3. Phenolic content determination
Total phenolic content of the avocado seed and peel extracts were determined using the Folin-Ciocalteu method with slight modifications (More & Aryal, 2019). A gallic acid solution (10 mg/ml) was dissolved in concentrations of 2-20 mg/L to build a calibration curve. For analysis, 900 µL of the extract plus 2400 µL of distilled water were added to a 2 mL Eppendorf tube and vortexed. Then 150 µL of Na2CO3 and 300 µL of Folin-Ciocalteu reagent were added and again stirred, left to stand for 15 min in the dark and at room temperature. Finally, the absorbance of the supernatant at a wavelength of 726 nm was measured on the UV-visible spectrophotometer (Jasco, model: V-670, USA) using a 1 cm quartz cuvette with an optical path against a prepared target to the same conditions. Results were reported as milligrams of gallic acid equivalent per gram of dry weight (DW) of avocado peel or seed (mg GAE/g).
2.4. Response surface methodology (RSM)
The use of the Box-Behnken design (BBD) and the statistical software Minitab version 18, served to obtain the ANOVA of the regression equation and the analysis of coefficients (Pareto). The second-order model was fitted to each response in terms of temperature, solvent concentration, and reaction time in the levels indicated by the Table 1.
Where: Y is the content of phenolic compounds; X1, X2, …, Xk, are the UAE factors; (0 is the intercept, (i (i=1, 2, …, k) are the linear coefficients, (ij (j=1, 2, …, k) are the quadratic coefficients, (ij (i=1, 2, …, k; j=1, 2, …, k) are the interaction coefficients of the regression model; ε is the experimental error of the model. The least squares method was used to estimate the β coefficients. RSM optimization was accomplished using a desirable function provided by Minitab version 18.
2.5. Artificial neural networks (ANN)
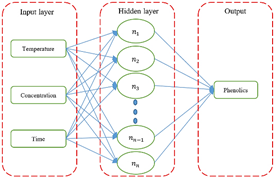
Phenolic content was determined using multilayer complete advanced neural networks (MFF). The ANN architecture was designed with three neurons in the input layer and one neuron in the output layer (Figure 2). Various topologies were tested to determine an optimal ANN network, especially for calculating the number of neurons in the hidden layer. For the transfer of information from the hidden layer and the output layer iteratively, different functions such as sigmoid, hyperbolic tangent and identity were tested. ANNs were trained using up to an adequate level of iterations. The networks were trained by Incremental Back Propagation (IBP). The experimental data obtained from the DBB were used in training (70%) and for the validation tests (30%). IBM SPSS Statistics version 25 software was used.
2.6. Model prediction
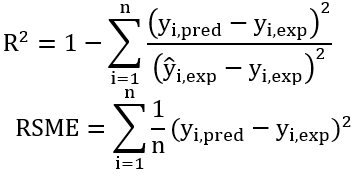
RSM and ANN models were correlated with the experimental responses, calculating the coefficients of determination (R2) and the root mean square error (RMSE) using the predicted values (yi,pred) and experimental values (yi,exp) generated by RSM and ANN.
Where: n is the number of experimental data and ŷi,exp is the average experimental value. The models were acceptable as R2 was closer to the value of 1 and the RSME values were as small as possible (Kaderides, Papaoikonomou, Serafim, & Goula, 2019; Agu et al., 2018).
3. Results and discussion
3.1. Characterization seed and peel avocado
Seed and peel of avocado represent 15.5 and 9.3% with respect to the fruit similar to those presented by Rosero et al. (2019). The results regarding the chemical composition of avocado seed and peel (Table 2) are scattered compared to the literature. For example, for avocado seeds: moisture values 5.3% - 34.3%, protein 1.3% - 17.9%, ash. 2.4% - 3.8%, fat 0.3% - 16.5%, fiber 2.8% - 26.3% and carbohydrates 44.7% - 80.1% (Bahru, Tadele, & Ajebe, 2019; Ejiofor, Ezeagu, Ayoola, & Umera, 2018). In the case of peels the ranges are moisture 65% - 76%, ash 0.8% - 1.6%, protein 1.5% - 6.3%, fat 2.8% - 11%, fiber 6.9% - 58% (Saavedra et al., 2017; Morais et al., 2015; Gondim, Moura, Dantas, Medeiros, & Santos, 2005). This dispersion of results may be due to the different analysis methods, fruit variety, ripening time, geographic location, among others (Jiménez et al., 2020). The antioxidant capacity in the seeds was superior and significantly different of peel, generally the antioxidant power in the avocado structure is presented in the order of seed > peel > pulp (Rodríguez-Carpena, Morcuende, Andrade, Kylli, & Estévez, 2011).
Table 2 Chemical composition
| Components % | Seed | Peel |
| Moisture | 8.637 ± 0.028b | 5.715 ± 0.078a |
| Protein | 1.914 ± 0.500b | 3.887 ± 0.012a |
| Ash | 1.423 ± 0.059b | 2.146 ± 0.032a |
| Fat | 1.675 ± 0.223b | 17.287 ± 0.556a |
| Fiber | 19.941 ± 0.220b | 27.393 ± 0.440a |
| Carbohydrate | 66.410 ± 0.434b | 43.571 ±0.889a |
| DPPH (µmol TE/mg) | 402.969±4.330a | 316.187±3.268b |
Components with equal letters do not show a significant difference (p < 0.05).
3.2. Modeling and optimization by RSM/ANN
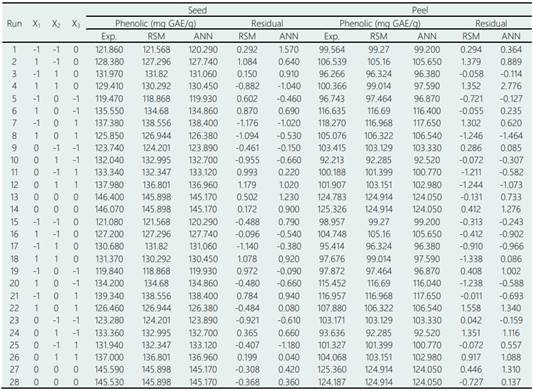
Results of the BBD experiments with the RSM show the experimental values (observed) and the predicted values for the phenolic components in seed (Y1) and peel (Y2) of avocado (Table 4). The equation that relates the independent variables (X1, X2, X3,) to the response variables (Y) is shown below:
ANOVA of the models obtained for the extraction of polyphenols in avocado seeds and shells were statistically significant with a confidence level of 95% (p < 0.05). The model of polyphenols extracted in seeds determined that all the terms of the equation are significant, however, in the model of polyphenols extracted in peel, the term X1X2, was not significant (p = 0.052). Pareto analysis determined the effects (positive / negative) of the terms on the models obtained (Betiku et al., 2015). On the polyphenols in seeds X1, X2 and X3 showed a positive (synergistic) effect, while X1X2, X1X3, X2X3, X1 2, X2 2 and X3 2 showed an effect negative (antagonist), in the case of the peel only X1 and the combination X2X3 showed a positive effect while X2, X3, X1X2, X1X3, X1 2, X2 2 and X3 2 showed a negative effect.
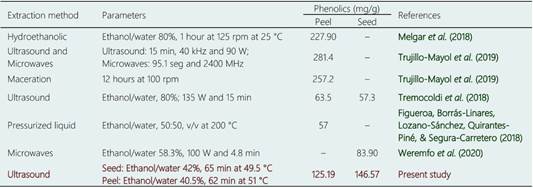
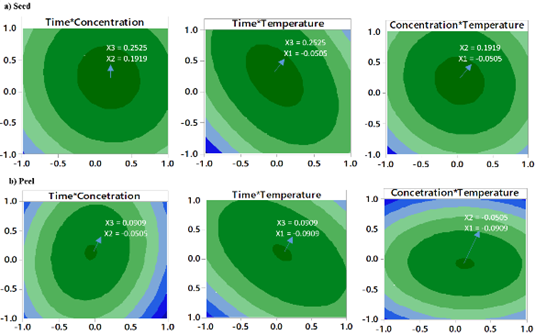
The optimal conditions for the extraction of phenolics in avocado shell and seed are presented in Figure 3 and were compared with the results of other authors (Table 3). There was a lower extraction efficiency in the peel compared to microwave methods and maceration; however, with respect to the seed, the results showed to be more efficient than those presented by Tremocoldi et al. (2018). On the other hand, the models generated by the correlation between the experimental and predicted values of the RSM for seeds and peels (Table 4) were significant (R2 = 0.9909, RMSE= 0.7486 and R2 = 0.9926, RMSE= 0.8720, respectively (p < 0.05) (Figure 4a-b).
The results regarding the phenolic content were found in the range of 121.86 to 146.4 mg GAE/g for seed and 92.21 to 124.91 mg GAE/g for peel (Table 4). Various solvents used in extraction of phenolic compounds have been reported on these avocado structures as: acetone, methanol, ethyl acetate or their mixtures with water. Phenolic concentrations are generally found for seeds from 1.55 to 292 mg GAE/g and for peels from 1.81 to 227.9 mg GAE/g (Wang, Bostic, & Gu, 2010; Morais et al., 2015; Pahua-Ramos et al., 2012; Rodriguez-Carpena et al., 2011; Calderón-Oliver et al., 2016; Melgar et al., 2018). These phenolic components in the seeds and peels of avocado tend to increase with the ripening of the fruit, the explanation for this phenomenon is probably due to the release of tannins located in the structure of the cell wall (López-Cobo et al., 2016).
The higher design levels BBD corresponding to temperature, ethanol concentration and extraction time caused a drop in the content of polyphenols (Figure 3), this may be due to the that many compounds are hydrolyzed and oxidized at high temperatures, especially when extraction occurs over long periods (Bi, Yang, Sun, Chen, & Zhang, 2011; Dai, & Mumper, 2010). Temperatures > 60 °C decrease the phenolic content in extracts (Akowuah, Mariam, & Chin, 2009). Optimization of the UAE using ethanol has been carried out in concentrations ≈50%, for example, 55% has been used in obtaining flavonoids in Cryptotaenia japonica (Lu et al., 2015); 55% to obtain polyphenols in lime peel (Rodsamran, & Sothornvit, 2019) and 42.9% to obtain polyphenols in Melastoma sanguineum (Zhou et al., 2017).
Table 4 Experimental phenolic content and predicted by RSM/ANN for seeds and peel avocado
Exp.: Experimental value.
Zhang et al. (2020) using RSM obtained an optimum performance of 29.66 mg/g of polyphenols in Desmodium triquetrum L. with a solvent/solid ratio of 30%, temperature of 40 °C, reaction time of 20 min, ultrasonic power of 160W and 60% ethanol. Hayat et al. (2009) also used the RSM to optimize the extraction of citrus peel, obtaining as adequate factors the power of 152 W, the solid/solvent ratio of 16%, the extraction time of 49 seconds and the methanol concentration of 66%.
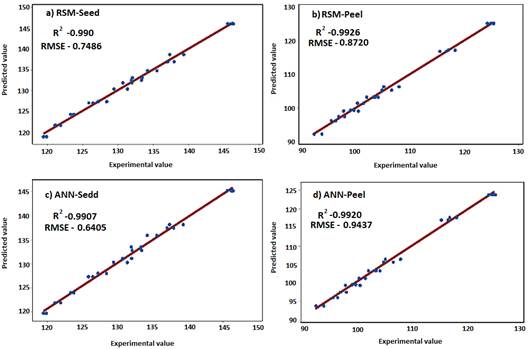
Figure 4 Correlation of the predicted model versus experimental values of phenolic components in avocado residues by RSM and ANN.
These studies consider ultrasonic powers superior to that used in this work (100 W), Arruda et al. (2018) have determined that for Ariticum peel the application of high ultrasonic powers in short times (< 5 minutes) also generates a high extraction efficiency. For example, Shirsath et al. (2017) improved the curcumin extraction yields (72% efficiency) in the UAE with an ultrasonic power of 250 W and a frequency of 22 kHz (lower than that applied in our study, 42 kHz), in addition to using ethanol as a solvent and finding parameters optimum solid / liquid ratio 40%, temperature 35 °C and particle size 0.09 mm.
The phenolic content in avocado residues by testing different ANN architectures and topologies using incremental back propagation (IBP) with a topology of 3 - 6 - 1 was determined, that is, an optimal number of 6 neurons, this determination was calculated by varying the number of neurons between 1 and 10 for the only hidden layer. The success of the prediction algorithm was achieved by applying the sigmoid function for data treatment (hidden layer and output layer), this sigmoid function has been used in ANN topologies for the prediction of oil extraction in Terminalia catappa L. grains, biodiesel production from shea butter (Vitellaria Paradoxa) and synthesis of biodiesel from oil from Thevetia peruviana (Agu et al., 2018; Betiku et al., 2015; Betiku, & Ajála, 2014). The ANN learning was completed using 100 000 iterations and the importance levels of the input variables in the model generated for seeds had the order: temperature, 45% > concentration, 32.3% > time extration, 22.7%) and for the peel: concentration, 41.2% > time extraction, 34.9% > temperature, 24%).
Optimization ANN established in seeds a phenolic content of 145.170 mg GAE/g with the variables of temperature input at 49.5 °C, solvent concentration 42% and reaction time of 65.5 min. While for the avocado peel it was obtained at 124.05 mg GAE/g for the variables of temperature input at 51 °C, concentration 49.5% and extraction time of 62 min. The ANN predictive models (Figure 4c-d) also presented high correlation and a low root mean square error in seeds (R2 = 0.9907, RSME = 0.6405) and peels (R2 = 0.9920, RSME = 0.9437). Qadir et al. (2019) worked with RSM and ANN models and through a central compound design and maximized phenolic extraction in Morus Alba leaves using an enzyme concentration of 5%, temperature 70 °C, incubation time 45 min and pH 8.5. Finally, Vinatoru, Mason, & Calinescu (2017) highlights the UAE as efficient to obtain optimal yields of phenolic compounds in vegetable raw materials, in addition this technique compared to traditional methods such as leaching, distillation and cold compression avoids the degradation of the extracted compounds.
4. Conclusions
Phenolic compounds present in avocado residues were obtained by means of ultrasound-assisted extraction (UAE), optimizing the variables of temperature, solvent concentration and extraction time by response surface methodologies (RSM) and artificial neural networks (ANN), with higher contents phenolic in seeds (145.170 - 146.569 mg GAE/g) than in peels (124.050 - 125.187 mg GAE/g). The experimental values determined from the Box - Behnken design were correlated with the predicted values of RSM and ANN, finding models with R2 = 0.9907 y RSME < 0.9437 mg GAE/g. The UAE method is presented as an attractive method to take advantage of these bioactive components present in avocado, its use and its investigation in other variables such as particle size, types of solvent, solid/liquid ratio, power and ultrasonic frequency are recommended.


