


 Inglés (pdf)
 Articulo en XML
 Referencias del artículo
 Enviar articulo por email
 Citado por SciELO
  Similares en
SciELO
Similares en
SciELO 
 Permalink
1. Introduction
Soursop leaves possess natural occurring compounds like acetogenins, phenolics and alkaloids to which a variety of therapeutic properties are attributed. To take advantage of their benefits they must be extracted from the plant tissue. However, the extraction implies a subsequent protection of the extracted compounds due to their sensibility when exposed to conditions that differ from the original matrix (Garavand et al., 2019).
Microencapsulation is a technique used for preserving extracted active principles by forming packages at micro scale. This technology protects the metabolites of interest through their entrapment inside a coating material that prevents direct exposure to factors such as light, oxygen and humidity (Saikia et al., 2015).
Among the variety of techniques used for bioactive compounds microencapsulation, spray drying and freeze drying stand out from others due to their technological versatility (Ogrodowska et al., 2017). During spray drying microencapsulation (SDM), the solvent present in a drop previously generated by a nozzle is instantaneously evaporated, this technique is widespread due to its low cost and practicality. Meanwhile, freeze drying microencapsulation (FDM) involves the sublimation of the solvent, which is achieved at freezing temperatures and low pressure (Nickerson et al., 2014). This is suitable for thermosensitive compounds; but needs a longer process and higher operative costs.
Technological parameters related to the microencapsula tion technique employed, determine the physicochemical and morphological characteristics of the resulting particles, among which are moisture, morphology, solubility, encapsulation efficiency and permeability (Li et al., 2019). These characteristics are crucial for maintaining the properties of the active principle through time. Jamdar et al. (2021) compared SDM and FDM for enzymes from aqueous wheat germ extracts, using mixtures of maltodextrin and whey protein as encapsulants, founding that SDM allowed higher values for moisture, solubility, encapsulation efficiency, enzyme and DPPH free radical scavenging activity. However, for curcumin encapsulates (Guo et al., 2020), as well as for polyphenols from “Japanese quince” juice (Turkiewicz et al., 2020), it has been reported higher encapsulation efficiency for FDM in comparison with SDM. Both, SDM and FDM techniques are used for encapsulating polyphenols since they not only offer protection from physical factors but from degradation during gastrointestinal digestion, which increases bioavailability and bioaccesibility (Annunziata et al., 2020).
Extraction phases have been studied for soursop leaves by Vit et al. (2014) obtaining higher rates of antioxidant capacity for ethanolic extracts. The authors stressed the need for further studies for their stabilization. Earlier research enabled to microencapsulate hydroalcoholic extracts and obtain spherical particles of irregular surface using SDM and maltodextrin as encapsulant (Jordán-Suárez et al., 2018), but no study of optimization has been performed. Also, it is unknown if annonacin (one of the main bioactive metabolites) was preserved after microencapsulation.
The aim of this investigation was to optimize the parameters for microencapsulating a hydroethanolic extract of soursop leaves after selecting a drying technology among spray and freeze drying.
2. Materials and methods
2.1 Materials and reagents
Soursop leaves obtained from a farm located in Pisco (Ica, Peru) were dehydrated up to 12% moisture for 10 days at environmental temperatures (without sunlight exposure) followed by oven drying until 10% moisture and mechanical grinding (Thomas Scientific 3383-L30). The species was previously authenticated by the herbarium Augusto Weberbauer of the National Agrarian La Molina University. As encapsulating agents, gum Arabic (Nexira food) and maltodextrin of DE: 10 - 12 (Frutarom) were used. The main analytical reagents were ethanol 99.9%, acetic acid, Folin-Ciocalteu, sodium carbonate and methanol 99.9%, from Merck (Germany). Gallic acid, ABTS, Trolox and DPPH from Sigma-Aldrich (USA), and annonacin 94% (JMC, USA).
2.2 Foliar extract preparation
Powdered dry leaves (g) were macerated in a hydroalcoholic solution (mL) (1:36) for 30 min at 70 °C. The mixture was then cooled to 30 °C and was filtered through a nylon fiber. The recovered liquid was centrifuged at 4000 rpm (Neofuge 18R, Heal Force) for 30 min at 18 °C and the supernatant was collected for further procedures.
2.3 Microencapsulation technique selection
To choose a microencapsulation technique, a factorial design (23) to maximize encapsulation efficiency (EE) was assembled including as factors: Microencapsulation technique (SDM or FDM), type of encapsulant (MD or GA), and encapsulant concentration (5% and 10%, w/w). Mixtures according to the previous design were gradually homogenized (OV5, Velp Scientific) at 10000 and 14000 rpm for 5 min.
The mixtures for FDM were frozen at - 80 °C for 24 h and then the solvent was sublimated in a benchtop lyophilizer (VirTis SentryTM, SP Industries) at - 60 °C and 100 mTorr of vacuum pressure for 96 h. Then, the powder was homogenized using a mortar and pestle (Saikia et al., 2015). For SDM, the mixtures were fed into a spray dryer (SD-Basic, LabPlant) at 10 mL/min, using a nozzle of 1 mm diameter and chamber at 140 ºC. All treatments were hermetically kept in dark glass flasks for their later characterization of morphology and encapsulation efficiency (EE).
2.4 Optimization of the selected technique
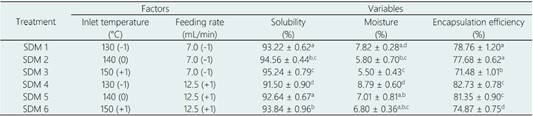
After selecting SDM, the temperature of the drying chamber (130, 140 and 150 °C) and feeding rate (7 and 12.5 mL/min) were optimized using a multilevel factorial design to minimize moisture and to maximize solubility and encapsulation efficiency. This experiment was performed at standard conditions for nozzle diameter (1 mm) and 10% of MD, parameters that were determined in the previous stage. The encapsulate obtained was characterized in terms of solubility, moisture, antioxidant capacity, morphology, color, percentage of defective particles and annonacin content.
2.5 Methods for characterization of encapsulates
Morphology by scanning electron microscopy (SEM)
Samples from SDM were put on the upper surface of metallic stubs covered with a double-sided tape followed by vacuum immobilization with a gold bath (S150, Edwards). Photographs were taken using a microscope JSM-6380LV, JEOL. The samples from FDM were directly analyzed using a SEM-EDS microscope (Quanta 200, FEI). Microphotographs were taken with a magnification from 1000 to 6000x.
Encapsulation efficiency (EE)
Encapsulation efficiency of phenolic compounds was calculated using the equation (1) as described by Saikia et al. (2015):
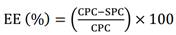 (1)
(1)Where, CPC and SPC correspond to the phenolic content inside and on the surface of the encapsulates, respectively. Both, CPC and SPC were determined according to Jordán-Suárez et al. (2018).
Physicochemical analysis: Moisture, solubility and color
Water content in microencapsulated extracts (3 ± 0.2 g) was determined using an infrared moisture analyzer (Li et al., 2019). Solubility was calculated according to Jordán-Suárez et al. (2018). The color of the liquid extract (without encapsulant) and the resulting encapsulate at optimized conditions was determined as described by Dewi et al. (2017) using the CIELAB scale.
Antioxidant capacity (DPPH and ABTS)
The encapsulates from FDM (25 mg) and SDM (50 mg) were mixed with 1 mL of methanol (80%). Samples were orbitally shaken (200 rpm) for 6 h at room temperature. Then, they were centrifuged at 9000 rpm for 15 min and the supernatant was collected to be analyzed.
The DPPH assay was performed according to Jing et al. (2015), with some modifications. The supernatant (100 µL) was mixed with 500 µL of DPPH solution (0.4 mg/mL), then 700 µL of a methanolic solution (80%) was added. This mixture was vortexed for 15 s at 1200 rpm. After 30 min of reaction in the absence of light, the absorbance of 130 µL was read in a microplate reader at 517 nm. Antioxidant capacity was calculated from a standard curve made at Trolox concentrations ranging from 0.01 to 0.12 µMol/mL.
The ABTS assay was done as described by Thaipong et al. (2006), with some modifications. The stock solution was prepared mixing equal volumes of ABTS (7.4 mM) and K2S2O8 (2.6 mM), followed by incubation in the dark for 12 h at room temperature. Later, the solution was diluted with methanol (80%) to adjust the absorbance at 1.1 ± 0.02. A volume of the supernatant (150 µL) was mixed with 1350 µL of the ABTS diluted solution. Then it was vortexed for 10 s at 1200 rpm; after 6 min of reaction in absence of light, absorbance of 150 µL aliquots was read at 734 nm (PowerWave XS2, Biotek), using methanol as a control. Antioxidant capacity was calculated from a standard curve of Trolox (0.1 - 0.7 µMol/mL).
Percentage of defective particles
Particles showing fragmentation, ballooning and folding in half were considered as defective due to their implications on the core preservation and powder technological properties. Defective particles were counted from SEM photos at 3000x using ImageJ™ and were expressed as percentage. This assay was adapted from Paramita et al. (2010).
Annonacin content
This analysis was performed for dry leaves and for the encapsulate at optimum conditions. Quantification was carried out using a standard curve elaborated from a methanolic solution of annonacin (0.9 mg/mL). Increasing volumes of the standard (2 to 15 μL) were automatically applied (Linomat V, CAMAG) onto an HPTLC plate at 150 nL/s with a band length of 6 mm and 14 mm between tracks. The development of the plate was carried out at 25 ± 2 °C and 40% of relative humidity in a double channel chamber (20×10 cm) up to 7 cm, using a mixture of chloroform/cyclohexane/diethilamine (5:2.5:2.5 v/v) as saturation solvent and mobile phase. Subsequently, the plates were dried and scanned at 210 nm (TLC scanner IV, CAMAG) operating in reflectance-absorbance mode. The slit dimension was kept at 5×0.45 mm with a scanning speed of 20 mm s-1. Data was analyzed using the WinCATS (V1.2.1) software.
The extract for quantifying annonacin in leaves was prepared as described by Bonneau et al. (2017), with some modifications. Grinded dry leaves were successively macerated (3 times) with CH2Cl2 (10% m/v) in falcon tubes for 3 h at 200 rpm. After extraction the tubes were centrifuged for 15 min at 4000 rpm. Then, the supernatant was filtered using 0.45 µm syringe filters. The collected liquid was concentrated to dryness at low pressure and moderate temperature (45 °C). The dry extract was reconstituted with methanol (2 mL) and sonicated for 5 min.
For quantifying annonacin in encapsulates, 300 mg of the powder was mixed with 1 mL of ethanol, acetic acid and distilled water (50:8:42). The mixture was shaken for 15 min at 200 rpm (MRC™, model TOS-4030FD), followed by filtration (0.45 µm). The samples (4 μL) were then seeded onto an HPTLC plate using the conditions previously described. The annonacin concentration (mg/g powder) was calculated from the standard curve constructed using the area under the curve of peaks that were revealed using the scanner IV (CAMAG™) for each standard concentration in the plates.
3. Results and discussion
3.1 Selection of the microencapsulation technique
Morphological analysis
SEM images showed remarkable differences in morphological features among spray dried and freeze dried encapsulates (Figure 1). Microparticles originated by SDM exhibited a spherical shape of heterogeneous size which is characteristic of this technique (Li et al., 2015). Furthermore, this behavior is dependent on the encapsulant type and concentration (Ramírez et al., 2015).
Treatments from SDM using MD showed a similar morphology to those made of GA (Figure 1). Likewise, increasing the encapsulant concentration did not cause a reduction of shrinkage since there were corrugated particles at 10% in both cases. This contrasts with the fact that at higher encapsulant concentrations, the sphericity should be higher (Li et al., 2015). In a previous study (Jordán-Suárez et al., 2018), the sphericity of microparticles made using MD with higher DE (18 - 20) increased noticeably at 10 %. This behavior could indicate that the lower maltodextrin DE the higher concentration to achieve more spherical particles.
In contrast with SDM, the microstructure of freeze-dried encapsulates was different due to the carrier agent (Figure 1). Microparticles with GA exhibited a porous net-type structure, whereas particles with MD showed a glassy structure in the form of flakes. During FDM, the structural support offered by the water disappears after having been sublimated and the encapsulant emerge as a porous matrix (Ezhilarasi et al., 2013). As a result, it is obtained particles of heterogeneous size, which do not have an edged core, in which the extract, containing the bioactive compounds, is embedded in the matrix. According to Che Man et al. (1999), the flattened aspect of freeze-dried encapsulates originates due to the pressure and temperature conditions.
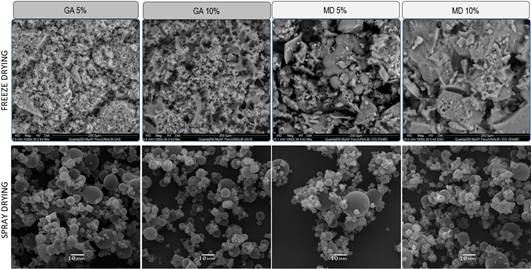
Figure 1 Micrographs taken at magnification level of 1000x showing the microstructure of soursop leaves extract microencapsulated through freeze (SEM-EDS) and spray drying (SEM). The scale for SMD (10 µm) and FDM (200 µm) are not equivalent due to the adjustment to fit into the figure.
Encapsulation efficiency of phenolic compounds
Significant differences in EE (p < 0.05) were found among both encapsulation techniques which favored spray drying (Table 1). When increasing the encapsulant concentration an increase in EE is observed for both encapsulants. This behavior is mainly attributed to a thickening of the polymeric structure which prevents degradation of phenolic compounds from factors such as temperature, humidity, oxygen, and light.
Table 1. Encapsulation efficiency in each treatment as effect of technique
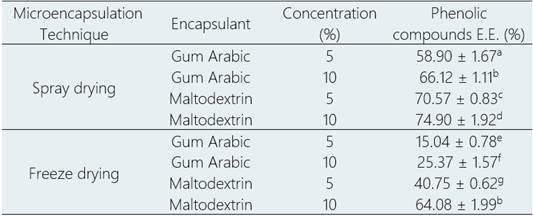
Different letters as superscript indicate significant difference between treatments (p-value < 0.05).
In relation to the type of encapsulant, the treatments with MD showed higher EE than the equivalents treatments using GA. The effect of the technique was demonstrated through differences that favor SDM over FDM for trapping phenolic compounds when comparing the best treatment of each technique (MD at 10%). This same behavior has been reported for anthocyanin microencapsulation (Zhang et al., 2020). Additionally, the disadvantage for FDM could be associated to the morphology of the particles, since the extract is not contained in a definite internal core.
In this study, treatments from FDM showed EE values ranging from 15.04% to 64.08%. However, there are studies (Ezhilarasi et al., 2013) in which EE is higher than 90%. It is important to mention that EE depends on the characteristics of the active principle, the type of encapsulant, as well as the affinity between them. Also, the variety of methodologies for calculating EE may hinder the comparison.
According to the analysis, SDM was the most efficient technique to encapsulate phenolic compounds with the combination of maltodextrin (DE: 10 - 12) at 10%. In order to improve the properties of microparticles, different levels of feeding rate and inlet temperature were studied later, considering the type and encapsulant concentration as constants.
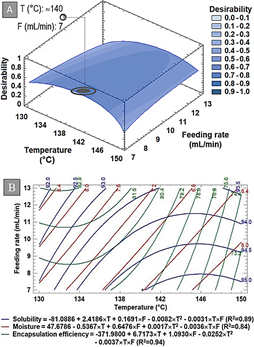
Figure 2 Response surface of multiple effects analysis (A) and Contour plot (B). T and F represent the temperature and the feeding rate.
3.2 Spray drying optimization
The effect of combining temperature and feed rate at different levels on the moisture, solubility and EE of the encapsulates from SDM (06) are shown in Table 2. These response variables are normally used for SDM optimization (Rubiano et al., 2015).
A high EE indicates an optimum performance of the encapsulant (Chranioti & Tzia, 2014). Likewise, the obtention of low moisture powders avoids caking and increases the yield of the drying process (Figueroa et al., 2016). Elsewhere, if the destination of the powder includes the step of reconstitution in water, is desirable to maximize solubility.
Each response was analyzed ANOVA independently giving factorial models with R2 over 0.8 with no significant (p > 0.05) lack of fit. For optimization purposes, the three response variables were simultaneously analyzed as function of Desirability (Figure 2A). The interaction of the three variables can be visualized on the contour plot (Figure 2B).
When the feeding rate increased there was an increase in moisture (Table 2). This occurs due to an incomplete solvent evaporation as a consequence of the relative quick speed the liquid is fed into the nozzle, which minimizes the time to lose moisture (Mezhericher et al. 2010). The abovementioned causes the particles to stick on the spray dryer chamber, causing the yield process to decrease (Figueroa et al., 2016). In general terms, encapsulation at 12.5 mL/min produced less soluble particles than those originated at 7 mL/min, which influences dispersion in water due to the formation of aggregates (Çam et al., 2014). However, particle agglomeration, as well as, high moisture, exerts a protective effect on phenolic compounds, resulting in a higher EE (Reineccius, 2004).
Furthermore, the temperature showed a significant effect on the three response variables (p < 0.05). Solubility increased with the rise of temperature, which has also been reported by Tran & Nguyen (2018). This result could be explained in terms of morphology, since the higher the temperature the lower the roughness. Therefore, the interaction with water is facilitated. By contrast, moisture decreased as temperature increased, and EE diminished simultaneously. This effect has also been described by Sun et al. (2020). The temperature level influences on thermosensitive compounds as well as on the microstructure. Although it is suggested to employ higher temperatures to reduce rough particles (Alamilla-Beltrán et al., 2005), this depends on the sensitivity of the active principle. In this investigation it was not convenient to increase temperature since the phenolics are thermosensitive. According to Aliakbarian et al. (2018), temperatures between 132 - 160 °C are optimum for encapsulating polyphenols by SDM.
3.3 Characterization of the encapsulate at optimized conditions
Morphology of particles obtained by optimized SDM
Microstructural analysis revealed microparticles of spherical shape with heterogenous size and varying topography (rough and smooth) (Figure 3).
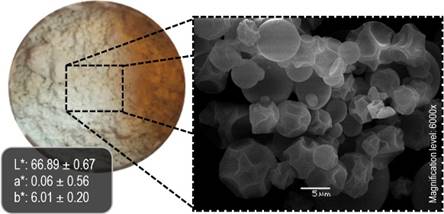
Figure 3 Color and microstructure of the microencapsulated extract at optimized spray-drying conditions. SEM photo taken at 6000x of magnification.
From a technological perspective, it is preferred that microparticles have a smooth surface since a high roughness represents a greater area of contact that allows interaction with oxygen putting at risk the interest compounds stability (Tolun et al., 2016); likewise, roughness causes flow property changes due to particle aggregation.
No defects such as cracks, fissures, or folding were found. Fragmented particles are undesirable since they lead to a poor protection of the core (Teodoro et al., 2014). Meanwhile, roughness was found in 68% of the particles. The heterogeneity in the powder microstructure suggests that although the processing conditions were optimized, further studies would be needed to obtain smoother particles. For instance, adding DE as a factor and sphericity as a response. It has been demonstrated that the usage of MD with different DE affects significatively the topography of the microparticles (Ezhilarasi et al., 2013), exhibiting a direct relation between sphericity and DE (Abd Ghani et al., 2017). In this experiment, the MD had a DE ranging from 10 to 12. In addition to the previous alternatives, indentations can be overcome by mixing encapsulants (Silva et al., 2013).
Color
The color of the optimum encapsulate is visualized in Figure 3. Remarkable differences were found for a* and b* as direct effect of encapsulation in comparison with the color of the fresh extract (L*: 69.85 ± 0.27; a*: 11.91 ± 0.09; b*: 64.17 ± 0.03). Both a* and b* values indicate a trend to red and yellow tones, respectively. According to Pelden & Meesawat (2019), yellowness is associated with the carotenoids present in the leaves. The color can be used as an indirect indicator of the encapsulation performance since freeze-dried encapsulates appeared more yellow due to a low EE. In contrast, powders from SDM were less yellow and looked whitish resembling MD. This same behavior has been reported by Barbosa et al. (2015). In general, color depends on the intrinsic features of the extract to be encapsulated and on the techniques employed. Other factors such as drying conditions (i.e. temperature), the type of encapsulant and its concentration can remarkably affect color (Suravanichnirachorn et al., 2018).
Antioxidant capacity (DPPH and ABTS)
The antioxidant capacity of the extract microencapsulated at optimum spray drying conditions was 17.88 ± 0.86 and 90.59 ± 1.19 µmol TE/g, measured by DPPH and ABTS assays, respectively. Antioxidant capacity assessed by DPPH (4.48 ± 0.22 mg TE/g) was within the range of 2.69 to 8.52 mg TE/g reported for moringa leaves extract microencapsulated by the same technique using a variety of technological conditions (Airouyuwa & Kaewmanee, 2019). As a point of comparison, the antioxidant capacity (by DPPH) of the six treatments assessed during the optimization step ranged from 3.68 to 4.53 mg TE/g. According to Tauchen et al. (2016), these values are catalogued as a weak to moderate level of antioxidant scavenging. González-Ortega et al. (2020) reported values ranging from 43.67 to 220.48 µmol TE/g (by ABTS) for olive leaves extract encapsulated by FDM. Our results fall within the range reported in this last study.
The antioxidant scavenging of soursop leaves is mainly attributed to phenolic compounds (George et al., 2015), but it is also dependent on other phytochemicals extracted jointly due to the affinity with the solvent (Roduan et al., 2019). In microencapsulated extracts, the antioxidant scavenging depends on the capacity of these compounds to resist the stress caused by technical conditions until it becomes a powder. For spray-dried soursop pulp (at 135 °C with 30% of carrier), there have not been reported differences in comparison with the initial fresh pulp (Leite et al., 2019). However, for Rosa rugosa extract microencapsulated via spray drying at 170 °C using MD (≈10%), the antioxidant capacity decreased regarding the original extract (Yu & Lv, 2019).
Annonacin content
According to HPTLC analysis, the content of Annonacin in the microencapsulated extract was 0.904 ± 0.054 mg/g. This concentration is lower than the dry leaves content (1.59 ± 0.04 mg/g) and represents a decrease due to technological stages that involve mass transfer of chemicals. The foliar content of Annonacin found in this study was higher than the value of 305.6 ± 28.3 µg/g reported by Machado de Moraes et al. (2016). Meanwhile, in terms of total acetogenins, the concentration obtained was under the range of 3.38 to 15.05 mg/g described by Machado et al. (2014). It is important to mention that the HPLC chromatograph of the sole standard (data not shown) presented isomers. However, such detail could not be visualized using HPTLC. Additionally, the bands formed for annonacin quantification could be a result of a mixture of other acetogenins, so this analysis would be quantifying total acetogenins; a similar behavior has been reported by Fernández et al. (2017).
The optimal conditions for the extract microencapsulation achieved to conserve phytochemicals originally present in the soursop leaves, to which a variety of bioactive properties are attributed. Although the extract was efficiently encapsulated into the matrix at the studied conditions, different parameters could be explored depending on the technological facilities and the final destination of the encapsulate.
4. Conclusions
Spray drying was selected for the microencapsulation of soursop leaves extract due to the higher encapsulation efficiency in comparison with freeze drying. The optimized parameters in terms of desirability were 140 °C for inlet temperature and 7 mL/min for feeding rate. Desirability was significantly influenced by solubility, EE and moisture of microparticles. Encapsulation efficiency and moisture decreased when temperature increased, but solubility increased. On the contrary, the higher the feeding rate, the higher encapsulation efficiency and moisture, but lower solubility. The optimized encapsulating process proved to be effective in the preservation of bioactive compounds originally present in the foliar extract which are recognized for therapeutic activities such as annonacin and phenolics.

