


 Inglés (pdf)
 Articulo en XML
 Referencias del artículo
 Enviar articulo por email
 Citado por SciELO
  Similares en
SciELO
Similares en
SciELO 
 Permalink
1. Introduction
The beer is the alcoholic beverage most consumed in the world (Colen & Swinnen, 2016). Some studies suggest that one beer drink consumption a day by women and two drinks by men partially reduces the risk of cardiovascular disease (de Gaetano et al., 2016). In beer production only four ingredients are necessary: water, malt, hop and yeast. The beer production process is important for sensorial properties and the nutritional quality of the final product (Blandino, Al-Aseeri, Pandiella, Cantero, & Webb, 2003). Instead of malt, other cereals are being used on beer production like barley, maize, rice, and wheat (Odibo, Nwankwo, & Agu, 2002). In several countries, like the United States of America, part of the malt can be substituted by unmalted cereals (Thompson, 2015). At Germany that substitution is forbidden. In Brazil the ANVISA (Agência Nacional de Vigilância Sanitária) allows to do the malt substitution for unmalted cereals until 45 % (Sleiman, Venturini Filho, Ducatti, & Nojimoto, 2010).
The malt replacement for other cereals implies a smaller cost production, been very valuable for the beer industry and a task for food control agencies as ANVISA and FDA (Food and Drug Administration). Some sensorial studies have been performed comparing pure malted beer and unmalted beer, showing measurable and detectable differences (Guido et al., 2007; Steiner, Auer, Becker, & Gastl, 2012; Yano, Back, & Krottenthaler, 2008).
There are some analytical methods in the literature to analyze and determine beer qualities as the one reported by (Lachenmeier, 2007) that uses FTIR associated with PCA (Principal Component Analysis) and PLS (Partial Least Squares) to determine some beers parameters like density and alcohol concentrations. Others, as the work proposed by Duarte et al. (2004) uses NMR spectroscopy combined with PCA to analyze and classify beers per alcoholic concentration and production regions. In the literature, few works were observed classifying beers made with only malted cereals and those made with a mixture of malted and unmalted cereals.
In this paper, spectrometric methods as FTIR, UV-VIS, and fluorescence were used in order to characterize local market Brazilian Pilsen beers samples, according to fabricators classification, that were pure malted or that contains a mixture of malted and unmalted cereals following the ANVISA parameters (Sleiman et al., 2010). All experimental set up was developed without any preparation process. Hence, it has been demonstrated that is possible to quickly determine patterns that distinguish the Pilsen beers samples by coupling spectrometric techniques with chemometric tools (PCA and SOM -Self Organizing Maps).
Theory and calculations
We performed a chemometric analysis of the FTIR, UV-VIS and fluorescence spectra using two techniques that are well established as chemometric tools, the PCA (Roggo et al., 2007; Sádecká & Tóthová, 2007; Zielinski et al., 2014) and SOM (Cuadros-Rodríguez, Ruiz-Samblás, Valverde-Som, Pérez-Castaño, & González-Casado, 2016; Krakowska, Custers, Deconinck, & Daszykowski, 2016; Yi et al., 2016).
The algorithms for each one of these techniques can be found on commercial software as MatLab (Inc, n.d.), Statistica (StatSoft, n.d.), Mathematica (Wolfram Research, n.d.) and others, including freeware platforms as Gnu-Octave (Eaton, n.d.) and FreeMat (Coman, Brewster, Popuri, Raim, & Gobbert, 2012). But we implemented and validated all them using Python Language (Kaplan, Levy, & Lambert, 2016) to computational optimizing them with reducing time spending and memory storage used during the calculations of the spectra analysis.
In order to calculate the PCA, the procedures and algorithm used are described on reference (Ballabio, 2015). In PCA performed, the Fisher ratio was used to variable selection (Pierce et al., 2006). In this work was used a new term to select the variables, the percentual Fisher Ratio / defined by
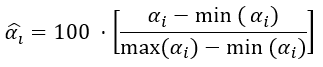
Where / is the minimum of / and / is the maximum value of /, been

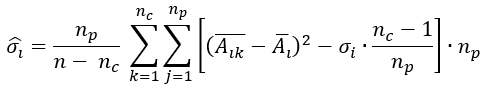
with σ 𝑖 been the interclass variance, and 𝜎 𝑖 the class variance given by
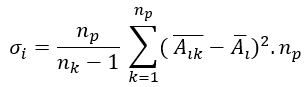
been 𝑛 𝑘 the number of the class, 𝑛 𝑝 the number of class 𝑝 elements, /the average value of the 𝑖−𝑣𝑎𝑟𝑖𝑎𝑏𝑙𝑒 on 𝑠𝑎𝑚𝑝𝑙𝑒−𝑘 and 𝐴 𝑖 the average value of the 𝑖−𝑣𝑎𝑟𝑖𝑎𝑏𝑙𝑒 in the entire set up of experimental data. And 𝜎 𝑖 , the interclass variance, was given by
The criteria to select variables to PCA was use a cutoff /> A%. All variables with equal or greater values than / were selected to use in PCA.
In fluorescence spectroscopy data the PCA was not applied, because these are a second-order data, and so other methods must be performed. These methods include PARAFAC, MPCA, SOM (Cuadros-Rodríguez et al., 2016) and so on. In this work, the SOM method was used to determine if was possible to use the second-order fluorescence spectra as technique to ranking beer samples into malted or unmalted beers.
2. Materials and methods
Samples
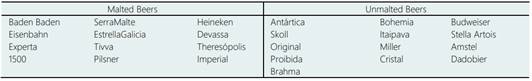
The Pilsen beers were obtained in local trade, at the Brazilian market in the Espírito Santo state. They were stored at room temperature until the instant of analysis. The beer brands are described in Table 1, separated by classes.
Twenty five samples were analyzed, being twelve of malted beers (produced only with malt as cereal) and thirteen of unmalted (produced with a mixture of malt and unmalted cereals according to fabritcators given the brazilian legislation). All these samples were analyzed by FTIR, UV-VIS and Fluorescence spectroscopy. The analyses were carried out without sample preparation. The beers' packaging was opened, and the samples were stored in glass vials until the spectroscopic analysis. For FTIR spectroscopy, a Cary 630 spectrometer (Agilent Technologies) was used, and the wavenumbers varied from 4000 to 650 cm-1, with 2 cm-1 resolutions, using a ZnSe crystal. In UV-VIS analysis, the Cary 60 spectrometer (Agilent Technologies) was used, with wavelengths between 190 and 1100 nm with a scan rate of 4800 nm min-1, and 1 nm of resolution and 10 mm of optical path lengths. The fluorescence spectroscopy analyses were carried out in a Cary Eclipse fluorescence spectrometer (Agilent Technologies),10 mm of optical path lengths, with excitation wavelength increase of 10 in 10 nm, starting at 290 nm until 490 nm. The wavelength of emission was always analyzed 10 nm bigger than excitation wavelength, until 900 nm. This spectrometer was handled with an emission and excitation slit width of 5 nm, with a scan rate of 3000 nm min-1. All samples were analyzed in triplicate.
Data Analysis
All spectra obtained were exported in .txt and the pattern recognition analysis were done. In the FTIR and UV-VIS spectra, the analysis were conducted by PCA, using the authors own software created in Python language previously validated and registered in the INPI (Instituto Nacional da Propriedade Industrial) under the number BR512020001455-0 (PyPCA), that uses the single value decomposition (SVD) algorithm. In the fluorescence spectra analyses a SOM was applied, using a authors own software created in Python language, also validated and registered in the INPI under the number BR512020001454-2 9 (PyMAO).
3. Results and discussion
PCA Analysis
In this work the differences between spectra of malted and unmalted beers were investigated by spectroscopic techniques using FTIR spectroscopy in the medium region, UV-VIS spectroscopy and fluorescence spectroscopy. Firstly, the algorithms of PCA and SOM were implemented and tested as described in the references (Ballabio, 2015; Cuadros-Rodríguez et al., 2016; Pierce et al., 2006).
The PCA and SOM algorithms were tested and validated using example problems, with a small number of inputs, and the results compared with the respective algorithms presented in the freeware software Gnu-Octave (Eaton, n.d.) and Freemat (Coman et al., 2012). In the tests we observed that the implemented algorithm using Python language was 10% faster than Octave and Freemat, with a significant reduction of average RAM storage used during the calculations. It can be observed in Table 2. In these tests, a Dell Workstation with 8Gb of RAM memory and quad-core i-7 processor under a Linux Debian Squeeze Operational System (OS) were used.
In PCAs performed two configurations were tested: i) FTIR and UV-VIS in two different data sets and ii) UV-VIS and FTIR at the same data set. In Figure 1 a typical FTIR spectra (a) and UV-VIS (b) spectra are shown.
In the first set, all the wavenumbers of the FTIR and UV-VIS spectra were used to perform the PCA of each one. In this configuration was not possible to obtain the class separation between the malted and unmalted beers for no one of the spectroscopy techniques tested. In order to solve this problem, a Fisher ratio calculation, as described in the section Theory and calculations was done for variable selection.
In this analyze for FTIR spectra, the cutoff criteria used was percentage Fisher ratio 𝛼 𝑖 >80%. Other Fisher ratio values were tested but this criteria for cutoff returned the best separation result with the minimum of variables reduction. Three principal components were selected, explained 91.23% of data variance. In Figure 2 are shown the residual Q calculation as function of the Hotelling T2 test with 95% confidence (a), PC1 versus PC2 scores (b), PC1 versus PC3 scores (c), PC2 versus PC3 scores (d), being the green circles the malted beer samples and red circle the unmalted beer samples, and PC1, PC2 and PC3 loadings (e). Assessing the scores Figure 2b, 2c and 2d it can be concluded that there was no class separation.
The Brazilian Pilsen beers analyzed have between 4.0% and 5.0% (v/v) of ethanol, being the majority compound the water. Analyzing the spectrum in Figure 1a, can be observed the O-H stretching vibration of water and ethanol in the band between 3550 to 3200 cm-1. This band is very intense because of the hydrogen bonds between the water molecules, as well as those by ethanol molecules. The C-O stretching vibration appears in 1040 cm-1. In the wavenumber 1700 cm-1 the band is assigned to C=O stretching vibrations. This bands are related to the various chemical compounds in beer, like the water solute vitamins of B group.
Table 2 Computational performance of the PCA and SOM algorithm using a Dell Workstation with core i-7, with 8Gb of RAM memory, on a Debian Squeeze OS
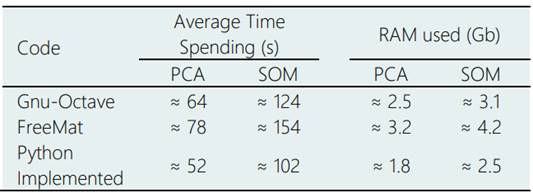
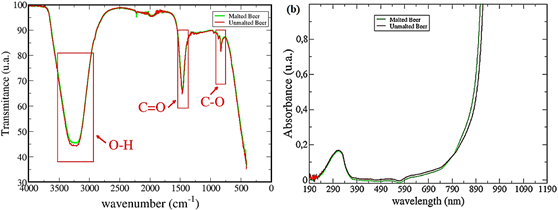
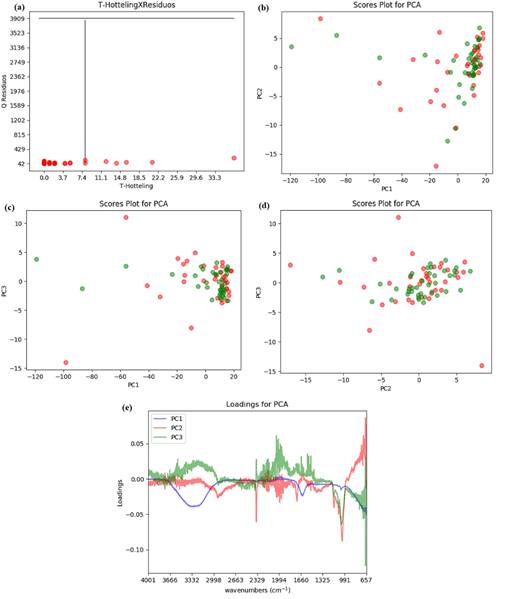
Figure 2 Graphics associated with the PCA for the beers samples FTIR spectra, considering the selected variable with percentage Fisher Ratio 𝛼 𝑖 >80% :(a) the residual Q calculation as function of Hotelling T2 test for the samples, the black lines correspond to the limiting values for each variable with 95 % confidence. (b) PC1 versus PC2 scores, (c) PC1 versus PC3 scores, (d) PC2 versus PC3 scores and (e) loadings for PC. The green circles show the malted beer samples and red circle show the unmalted beer samples.
For UV-VIS spectra analyze the cutoff criteria to variable selection used was percentage Fisher Ratio 𝛼 𝑖 > 40%. In Figure 3 are showed the residual Q calculation as function of the Hotelling T2 test with 95% confidence (a), PC1 versus PC2 scores (b), PC1 versus PC3 scores (c) and PC2 versus PC3 scores (d), being the green circles the malted beer samples and red circle the unmalted beer samples.
The UV-VIS spectroscopy coupled to PCA allowed to rank the beer samples in malted and unmalted beer. Using 3 PC's 99.76% of variance was explained. It is possible to observe in the Figure 3c that PC2 and PC3 are responsible for the separation between the two beers groups. The loadings graphics showed in Figure 3e demonstrates that the spectrum region responsible for this separation is the one with wavelengths between 432 and 648 nm. These wavelengths are associated to visible light in the red color region and near infrared, main for the PC3 contribution. On the other hand, the limiting values of the Hotelling T2 statistical test and the residual showed in Figure 3a represents that all samples have greater values when compared to the limiting of acceptance, hence the separation between the two groups cannot be confirmed and guaranteed.
In the second data set, the UV-VIS and FTIR spectra were used in the same matrix in PCA analysis. The results obtained have not enabled in sample separation between malted and unmalted beers. As the separation was possible with the UV-VIS spectra, the FTIR spectra should be the responsible by this series did not show a separation between the beer samples.
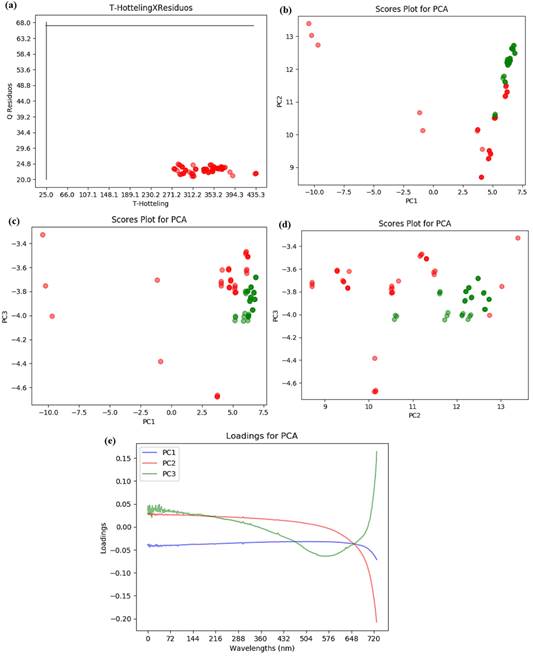
Figure 3 Graphics associated with the PCA for the beers samples UV-VIS spectra, considering the selected variable with percentage Fisher Ratio 𝛼 𝑖 > 40%, (a) The residual Q calculation as function of the Hotelling T2 test for the samples, the black lines correspond to the limiting values for each variable considering 95% confidence. (b) PC1 versus PC2 scores, (c) PC1 versus PC3 scores and (d) PC2 versus PC3.The green circles show the malted beer samples and red circle show the unmalted beer samples.
SOM Analysis
The fluorescence spectra have one more dimension than FTIR and UV-VIS spectra (second order data). A SOM was performed to analyze these spectra. The SOM parameters used were: a square lattice size L=40, with each node containing N= 26 x 136 elements (given the Fluorescence spectra produced by the Cary Eclipse equipment), initial radius 𝑟 0 = 𝐿 2 , total number of iterations N int =5000, learning rate 𝐿𝑒= 𝑁 𝑖𝑛𝑡 log( 𝑟 0 ) , initial learning rate Le0 = 0.2. The entire evaluation consumed 600 s.
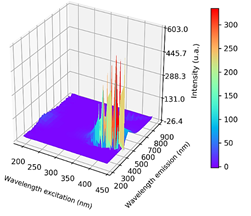
In Figure 4 are shown a fluorescence spectrum of one beer sample for each class.
The Fluorescence phenomena typically occurs from aromatic molecules. Emission spectra are dependent upon the chemical structure of the fluorophore and the solvent in which it is dissolved (Lakowicz, 2006). The beer's fluorescence activity can be explained by chemical composition because of the phenolic compounds and the other components like carbohydrates, minerals and vitamins of the B-group (Cortese et al., 2020).
In Figure 5 is showed the class separation between the malted and unmalted beers obtained with the SOM method developed. The rand index (Davé & Krishnapuram, 1997) was calculated and the result obtained was 0.85 (close to the unity). When the rand index is closer to one, more effective is the separation between the classes in SOM method. The calibration and validation were performed for this technique using the procedure proposed in reference (Petrov, Georgieva, & Jordanov, 2013). The calibration set contained 51 spectra (24 malted beer and 27 unmalted beer) and the validation set contained 24 spectra (12 malted beer and 12 unmalted beer) randomly selected. First, the SOM with the calibration set was performed and after N int =5000 iterations the validation set were introduced. The positions of the validation samples set inside the map were determined using a comparison of the euclidian distance between the cluster baricenter and sample position. We considered the closest baricenter, and the first sample neighbors of the validation sample in order to determine to each cluster it belongs. We obtained a percentage accuracy of approximately 79 to 87.5% for correct samples pattern recognition.
The average time spending to perform the entire analysis described above was ≈ 8 min per sample, compared to the ≈ 3min per sample for the FTIR and UV-VIS spectroscopy conjugated with the PCA as a chemometric tool.
Thus, fluorescence spectra associated with SOM as chemometric tool is a good approach to obtained beer separation in two classes of Brazilian Pilsen beer produced with malted or malted and unmalted cereals.
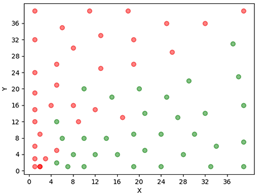
Figure 5 Graphic representing the SOM for the two classes of beers with malted beer class (green circles), and unmalted beer class (red circles) for the Fluorescence spectra, where is possible to observe the class separation. The SOM algorithm used the following specifications: square lattice size L= 40, nodes containing N= 26 x 136 elements, r0=L/2, total number of iterations Nint =5000, learning rate  , initial learning rate Le0 = 0.2.
It is necessary to reinforce that the main results shown here, were obtained for the Pilsen beer obtained in Brazilian market, and the initial sample classification was based on the beer fabricators description. Hence, other studies must be performed to check the validity of the simple proposed protocol for other origin of beers because in each country there are different legislation associated with classification and production requirements. But the proposed technique points out as a very good and useful technique to investigate frauds in beer marked when talking about malted and unmalted beers.
4. Conclusions
At the present work, to qualitatively characterize local trade Brazilian Pilsen beers into malted and unmalted classes according to the fabricator’s definitions in a fast and simple way, is possible to use the following approach without any sample preparation process: fluorescence spectroscopy associated with SOM technique with a rand index of 0.85. The model was validated and showing a percentage accuracy rate of approximately 79% - 87.5% for correct beer patter recognition. Given that the computational time spending and RAM storage demanded by the proposed software produced for the specific purpose of this investigation, were small when compared to other commercial and freeware platforms executing the same chemometric algorithms. The approximately ~8 min time spending for the calculation is the smallest for the proposed approach. In the other hand, was possible to observe that the use of FTIR and UV-VIS spectroscopy with PCA, as reported here, even using variable selection with percentual Fisher Ratio 𝛼 𝑖 > 80% (FTIR case) and Fisher Ratio 𝛼 𝑖 > 40% (UV-VIS case) were not possible obtained the classes separation with a confidence level of 95%. Future studies with controlled samples must be performed in other to support quantitative investigations, for the purposes of fraud controls in the beer market.

